- My Alerts
- Go Ad-Free
-
My Account
In App


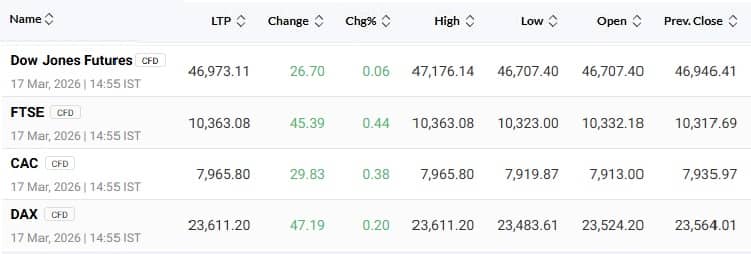
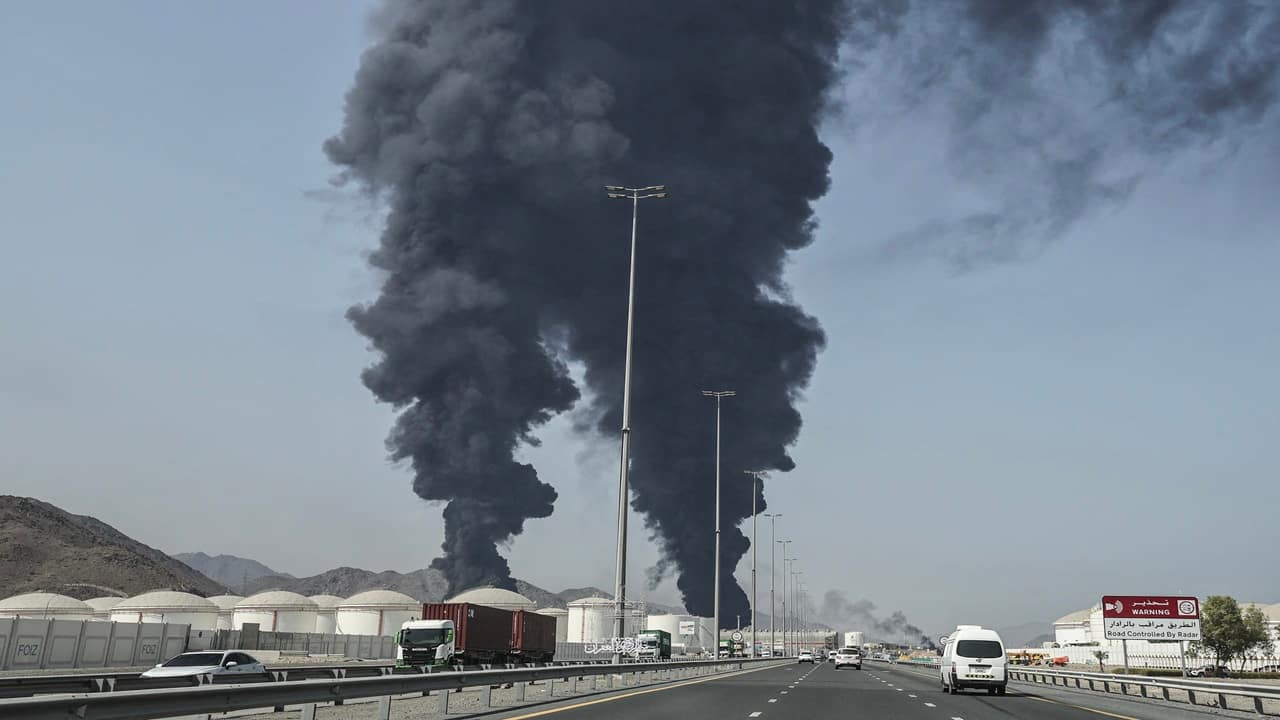
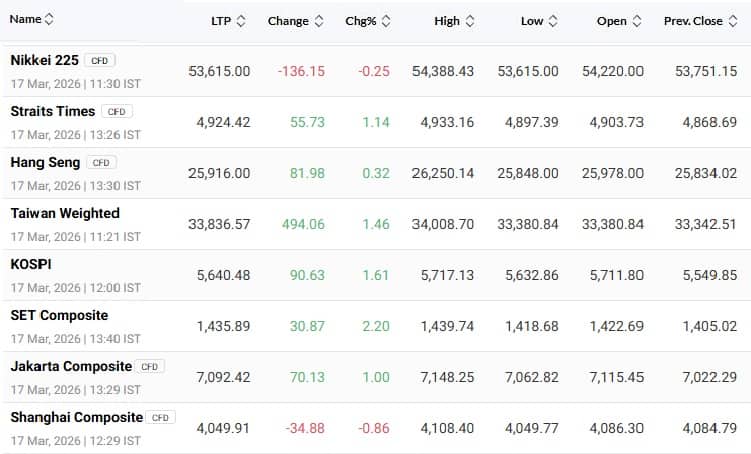
Trading Plan: Will Nifty 50, Bank Nifty extend gains for a second straight session as oil prices ease?
In case of a further uptrend, the Nifty 50 may face resistance at the 23,500–23,700 zone, followed by 24,000, but the move may look unsustainable due to a sell-on-rally approach. Meanwhile, support is placed at the 23,000–22,950 zone....Read More

Trade Spotlight: How should you trade BSE, Linde India, NHPC, PB Fintech, Bajaj Finance, HDFC Bank, and others on March 17?
The market needs follow-up buying interest and a sustainable close above the previous week's high for stability. Below are some short-term trading ideas to consider....Read More

| Name | LTP | Chg | %Chg | Open | High | Low | 52 Week High | 52 Week Low | Technical Rating | |||
|---|---|---|---|---|---|---|---|---|---|---|---|---|
| Key Indices | ||||||||||||
NIFTY 50 |
23,581.15 | 172.35 | 0.74 | 23,493.20 | 23,656.80 | 23,346.60 | 26,373.20 | 21,743.65 |
|
|||
NIFTY BANK |
54,876.00 | 462.60 | 0.85 | 54,649.10 | 54,996.00 | 54,113.15 | 61,764.85 | 48,196.10 |
|
|||
NIFTY Midcap 100 |
55,174.40 | 559.45 | 1.02 | 54,880.80 | 55,304.70 | 54,446.05 | 61,548.85 | 46,966.60 |
|
|||
NIFTY NEXT 50 |
65,021.60 | 559.30 | 0.87 | 64,722.05 | 65,161.40 | 64,261.30 | 70,833.65 | 57,250.25 |
|
|||
NIFTY 100 |
24,237.80 | 182.40 | 0.76 | 24,143.80 | 24,310.70 | 23,992.70 | 26,975.15 | 22,177.35 |
|
|||
Nifty 200 |
13,209.35 | 105.75 | 0.81 | 13,154.60 | 13,247.20 | 13,069.85 | 14,700.95 | 11,941.45 |
|
|||
NIFTY 500 |
21,669.30 | 170.50 | 0.79 | 21,585.05 | 21,729.65 | 21,446.15 | 24,144.20 | 19,519.85 |
|
|||
NIFTY Smallcap 100 |
15,912.90 | 102.55 | 0.65 | 15,888.25 | 15,957.60 | 15,765.70 | 19,224.95 | 14,084.30 |
|
|||
NIFTY MIDCAP 50 |
15,656.75 | 159.75 | 1.03 | 15,570.75 | 15,692.30 | 15,444.75 | 17,572.45 | 13,269.65 |
|
|||
NIFTY SMLCAP 50 |
7,813.50 | 51.75 | 0.67 | 7,803.90 | 7,837.05 | 7,745.00 | 9,282.70 | 6,776.05 |
|
|||
India VIX |
19.78 | -1.82 | -8.43 | 21.60 | 21.60 | 19.62 | 24.49 | 8.72 |
|
|||
NIFTY 750 TOTAL MKT |
12,143.60 | 96.40 | 0.80 | 12,095.80 | 12,177.20 | 12,018.00 | 12,177.20 | 0.00 |
|
|||
| Sectoral Indices | ||||||||||||
NIFTY Auto |
25,117.10 | 518.00 | 2.11 | 24,703.90 | 25,195.45 | 24,518.70 | 29,179.10 | 19,316.65 |
|
|||
NIFTY IT |
28,760.90 | -281.65 | -0.97 | 29,080.75 | 29,080.75 | 28,288.05 | 40,301.40 | 28,288.05 |
|
|||
NIFTY PSU Bank |
8,596.95 | 28.55 | 0.33 | 8,611.00 | 8,624.15 | 8,456.85 | 9,918.65 | 5,756.35 |
|
|||
NIFTY Fin Service |
25,724.65 | 209.40 | 0.82 | 25,624.15 | 25,795.35 | 25,426.20 | 28,562.50 | 23,305.45 |
|
|||
NIFTY Pharma |
22,597.55 | 50.35 | 0.22 | 22,632.80 | 22,733.70 | 22,492.95 | 23,540.90 | 19,121.10 |
|
|||
NIFTY FMCG |
48,104.45 | -364.40 | -0.75 | 48,612.60 | 48,612.60 | 48,040.15 | 58,485.05 | 47,826.35 |
|
|||
NIFTY Metal |
11,637.35 | 319.35 | 2.82 | 11,380.60 | 11,660.10 | 11,273.60 | 12,509.75 | 7,690.20 |
|
|||
NIFTY Realty |
711.25 | 12.60 | 1.80 | 701.10 | 714.00 | 695.00 | 1,049.70 | 685.00 |
|
|||
NIFTY Media |
1,307.90 | 14.40 | 1.11 | 1,299.45 | 1,314.55 | 1,291.20 | 1,786.15 | 1,270.65 |
|
|||
NIFTY Energy |
35,980.80 | 298.75 | 0.84 | 35,846.60 | 36,087.00 | 35,617.70 | 37,306.50 | 29,802.20 |
|
|||
Nifty Pvt Bank |
26,066.20 | 241.05 | 0.93 | 25,924.95 | 26,121.00 | 25,717.20 | 29,748.45 | 24,020.15 |
|
|||
NIFTY Infra |
8,864.20 | 88.55 | 1.01 | 8,809.20 | 8,891.35 | 8,764.75 | 9,792.60 | 7,775.80 |
|
|||
NIFTY Commodities |
9,479.25 | 109.15 | 1.16 | 9,402.90 | 9,506.05 | 9,353.05 | 10,078.60 | 7,601.40 |
|
|||
NIFTY Consumption |
10,814.45 | 120.05 | 1.12 | 10,727.90 | 10,847.55 | 10,684.55 | 12,716.20 | 10,159.85 |
|
|||
NIFTY PSE |
10,004.05 | 81.50 | 0.82 | 9,965.15 | 10,027.10 | 9,863.45 | 10,544.05 | 8,457.60 |
|
|||
NIFTY Services |
30,249.75 | 212.25 | 0.71 | 30,165.45 | 30,339.70 | 29,915.05 | 34,549.75 | 29,070.85 |
|
|||
Nifty FinSrv25/50 |
28,200.85 | 273.50 | 0.98 | 28,047.45 | 28,276.50 | 27,850.00 | 28,276.50 | 0.00 |
|
|||
Nifty Cons Durbl |
35,189.20 | 252.35 | 0.72 | 35,092.95 | 35,306.05 | 34,733.80 | 40,472.45 | 32,205.30 |
|
|||
Nifty Healthcare |
14,439.95 | 37.20 | 0.26 | 14,453.25 | 14,531.80 | 14,379.95 | 15,148.75 | 12,565.40 |
|
|||
Nifty Oil & Gas |
11,127.25 | 18.50 | 0.17 | 11,135.15 | 11,162.65 | 11,040.85 | 12,445.70 | 9,445.95 |
|
|||
NIFTY India Mfg |
14,782.35 | 188.50 | 1.29 | 14,659.25 | 14,824.75 | 14,585.85 | 14,824.75 | 0.00 |
|
|||
Nifty India Defence |
8,011.15 | 146.35 | 1.86 | 7,907.05 | 8,028.85 | 7,847.40 | 8,028.85 | 0.00 |
|
|||
| Other Indices | ||||||||||||
NIFTY MIDCAP 150 |
20,366.95 | 208.50 | 1.03 | 20,255.55 | 20,415.70 | 20,103.40 | 22,650.05 | 17,269.50 |
|
|||
NIFTY MIDSML 400 |
18,332.55 | 159.60 | 0.88 | 18,260.75 | 18,374.80 | 18,122.60 | 20,668.15 | 15,832.85 |
|
|||
NIFTY SMLCAP 250 |
14,889.50 | 84.80 | 0.57 | 14,876.60 | 14,929.60 | 14,762.20 | 18,077.35 | 13,314.70 |
|
|||
NIFTY MNC |
29,411.10 | 165.95 | 0.57 | 29,363.95 | 29,491.80 | 29,183.25 | 32,131.15 | 23,981.05 |
|
|||
NIFTY AlphaLowVol 30 |
25,289.60 | 174.30 | 0.69 | 25,162.15 | 25,357.05 | 25,039.70 | 25,357.05 | 0.00 |
|
|||
Nifty200 Momentum 30 |
28,967.20 | 353.65 | 1.24 | 28,727.50 | 29,035.30 | 28,551.20 | 29,035.30 | 0.00 |
|
|||
Nifty LargeMid250 |
15,358.35 | 136.50 | 0.90 | 15,286.55 | 15,399.30 | 15,185.45 | 17,077.75 | 13,526.30 |
|
|||
Nifty500 Mul50:25:25 |
14,931.25 | 115.90 | 0.78 | 14,878.40 | 14,970.30 | 14,780.45 | 16,681.75 | 13,318.60 |
|
|||
NIFTY CPSE |
7,064.75 | 75.20 | 1.08 | 7,024.45 | 7,082.25 | 6,961.40 | 7,252.05 | 5,521.95 |
|
|||
NIFTY MID SELECT |
12,736.30 | 121.05 | 0.96 | 12,681.80 | 12,771.85 | 12,577.70 | 14,118.40 | 10,382.55 |
|
|||
NIFTY IND DIGITAL |
7,411.70 | 45.50 | 0.62 | 7,390.65 | 7,440.75 | 7,295.30 | 9,723.25 | 7,233.65 |
|
|||
NIFTY M150 QLTY50 |
21,588.55 | 150.85 | 0.70 | 21,543.65 | 21,644.55 | 21,377.20 | 21,644.55 | 0.00 |
|
|||
Nifty Microcap 250 |
19,794.55 | 194.35 | 0.99 | 19,691.00 | 19,839.95 | 19,541.70 | 19,839.95 | 0.00 |
|
|||
Nifty Capital Market |
4,577.70 | 97.05 | 2.17 | 4,514.90 | 4,586.60 | 4,488.00 | 4,586.60 | 0.00 |
|
|||