- My Alerts
- Go Ad-Free
-
My Account
In App


HDFC Bank appoints external law firms to review ex-chairman Atanu Chakraborty's resignation
The bank said Chakraborty "did not mention any happenings or practices that were not in congruence with his personal values and ethics," adding that "no other material reasons" were indicated beyond those already disclosed....Read More
Trading Plan: Can hopes of Iran war de-escalation help Nifty 50, Bank Nifty recoup Monday’s losses?
Oversold momentum indicators, along with a bullish divergence in the RSI, signal a potential short-term recovery in the market. Hence, the Nifty 50 may face resistance in the 23,000–23,300 range, while support is placed at 22,500–22,400....Read More

Stocks to Watch Today: SEPC, InterGlobe Aviation, Coal India, GR Infraprojects, GSP Crop Science, Bluspring Enterprises, Brand Concepts in focus on 24 March
Stocks to Watch, 24 March: Stocks like InterGlobe Aviation, Coal India, SEPC, GR Infraprojects, Persistent Systems, Indian Railway Finance Corporation, GNG Electronics, Dredging Corporation of India, Wipro, Bluspring Enterprises, Brand Concepts, and GSP Crop Science will be in focus on March 24....Read More

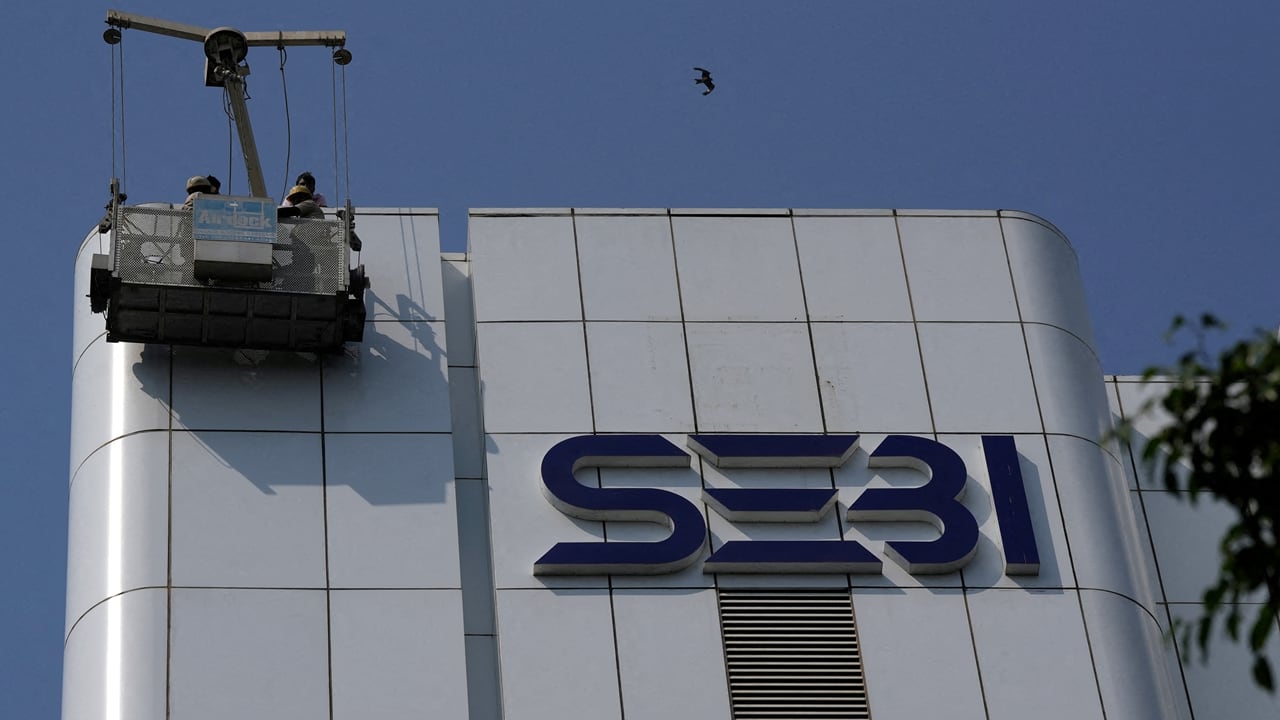
SEBI board approves conflict of interest code for WTMs, officials
The decision comes following recommendations by a High-Level Committee (HLC) chaired by former Chief Vigilance Commissioner Pratyush Sinha. The panel had called for a comprehensive, legally enforceable system to replace the regulator’s existing and fragmented code. ...Read More

Stocks to Watch Today: SEPC, InterGlobe Aviation, Coal India, GR Infraprojects, GSP Crop Science, Bluspring Enterprises, Brand Concepts in focus on 24 March
Stocks to Watch, 24 March: Stocks like InterGlobe Aviation, Coal India, SEPC, GR Infraprojects, Persistent Systems, Indian Railway Finance Corporation, GNG Electronics, Dredging Corporation of India, Wipro, Bluspring Enterprises, Brand Concepts, and GSP Crop Science will be in focus on March 24....Read More
Daily Voice: India structurally attractive if Iran war de-escalates, earnings visibility improves: Edelweiss MF’s Trideep Bhattacharya
Edelweiss MF's base case still assumes oil moderates if conflict de-escalates. Strategic stock releases by the International Energy Agency and temporary sanctions flexibility on Iranian cargoes are already acting as stabilizers, said Trideep Bhattacharya....Read More

HDFC Bank appoints external law firms to review ex-chairman Atanu Chakraborty's resignation
The bank said Chakraborty "did not mention any happenings or practices that were not in congruence with his personal values and ethics," adding that "no other material reasons" were indicated beyond those already disclosed....Read More
Trade setup for March 24: Top 15 things to know before the opening bell amid hopes of Iran war de-escalation
Experts expect the Nifty 50 to rebound in the upcoming session, with an immediate hurdle at 23,000, followed by 23,200. However, the sustainability of any such rally will be key to watch, given the overall bearish setup....Read More

| Name | LTP | Chg | %Chg | Open | High | Low | 52 Week High | 52 Week Low | Technical Rating | |||
|---|---|---|---|---|---|---|---|---|---|---|---|---|
| Key Indices | ||||||||||||
NIFTY 50 |
22,716.70 | 204.05 | 0.91 | 22,878.45 | 22,899.60 | 22,701.20 | 26,373.20 | 21,743.65 |
|
|||
NIFTY BANK |
52,140.55 | 702.80 | 1.37 | 52,384.80 | 52,495.70 | 52,079.15 | 61,764.85 | 49,156.95 |
|
|||
NIFTY Midcap 100 |
53,357.60 | 640.05 | 1.21 | 53,878.30 | 53,913.05 | 53,326.10 | 61,548.85 | 46,966.60 |
|
|||
NIFTY NEXT 50 |
61,827.35 | 412.45 | 0.67 | 62,668.15 | 62,706.55 | 61,799.30 | 70,833.65 | 57,250.25 |
|
|||
NIFTY 100 |
23,298.55 | 200.30 | 0.87 | 23,489.50 | 23,508.40 | 23,283.65 | 26,975.15 | 22,177.35 |
|
|||
Nifty 200 |
12,711.55 | 117.25 | 0.93 | 12,819.40 | 12,829.25 | 12,703.85 | 14,700.95 | 11,941.45 |
|
|||
NIFTY 500 |
20,853.30 | 189.05 | 0.91 | 21,045.45 | 21,059.20 | 20,841.45 | 24,144.20 | 19,519.85 |
|
|||
NIFTY Smallcap 100 |
15,243.20 | 144.50 | 0.96 | 15,459.70 | 15,459.70 | 15,235.10 | 19,224.95 | 14,084.30 |
|
|||
NIFTY MIDCAP 50 |
15,184.75 | 184.25 | 1.23 | 15,322.85 | 15,332.20 | 15,172.15 | 17,572.45 | 13,269.65 |
|
|||
NIFTY SMLCAP 50 |
7,471.25 | 70.65 | 0.95 | 7,576.20 | 7,576.20 | 7,466.65 | 9,282.70 | 6,776.05 |
|
|||
India VIX |
25.50 | -1.23 | -4.60 | 26.73 | 26.73 | 24.71 | 27.17 | 8.72 |
|
|||
NIFTY 750 TOTAL MKT |
11,690.95 | 107.75 | 0.93 | 11,799.00 | 11,806.35 | 11,684.50 | 11,806.35 | 0.00 |
|
|||
| Sectoral Indices | ||||||||||||
NIFTY Auto |
24,317.40 | 382.65 | 1.60 | 24,458.45 | 24,509.65 | 24,305.85 | 29,179.10 | 19,316.65 |
|
|||
NIFTY IT |
29,300.25 | 153.20 | 0.53 | 29,572.75 | 29,572.75 | 29,210.70 | 40,301.40 | 28,288.05 |
|
|||
NIFTY PSU Bank |
8,364.30 | 132.65 | 1.61 | 8,429.60 | 8,449.30 | 8,356.45 | 9,918.65 | 5,904.10 |
|
|||
NIFTY Fin Service |
24,219.05 | 259.85 | 1.08 | 24,388.10 | 24,423.55 | 24,193.50 | 28,562.50 | 23,546.50 |
|
|||
NIFTY Pharma |
22,143.95 | 90.85 | 0.41 | 22,305.95 | 22,359.70 | 22,129.00 | 23,540.90 | 19,121.10 |
|
|||
NIFTY FMCG |
45,962.75 | 125.70 | 0.27 | 46,498.50 | 46,541.60 | 45,911.50 | 58,485.05 | 45,740.90 |
|
|||
NIFTY Metal |
10,983.45 | 120.00 | 1.10 | 11,114.20 | 11,128.00 | 10,978.40 | 12,509.75 | 7,690.20 |
|
|||
NIFTY Realty |
670.20 | 6.80 | 1.03 | 675.65 | 676.55 | 667.95 | 1,049.70 | 661.35 |
|
|||
NIFTY Media |
1,264.80 | 11.45 | 0.91 | 1,272.05 | 1,278.95 | 1,263.00 | 1,786.15 | 1,245.05 |
|
|||
NIFTY Energy |
34,957.50 | 118.05 | 0.34 | 35,531.90 | 35,531.90 | 34,944.35 | 37,306.50 | 29,802.20 |
|
|||
Nifty Pvt Bank |
24,740.85 | 303.95 | 1.24 | 24,832.20 | 24,892.35 | 24,702.95 | 29,748.45 | 24,384.45 |
|
|||
NIFTY Infra |
8,646.85 | 72.95 | 0.85 | 8,731.90 | 8,735.20 | 8,642.95 | 9,792.60 | 7,775.80 |
|
|||
NIFTY Commodities |
9,121.30 | 63.15 | 0.70 | 9,231.40 | 9,231.60 | 9,117.95 | 10,078.60 | 7,601.40 |
|
|||
NIFTY Consumption |
10,452.35 | 114.35 | 1.11 | 10,528.35 | 10,550.35 | 10,446.25 | 12,716.20 | 10,159.85 |
|
|||
NIFTY PSE |
9,618.00 | 24.10 | 0.25 | 9,782.85 | 9,786.80 | 9,613.65 | 10,544.05 | 8,457.60 |
|
|||
NIFTY Services |
28,968.55 | 260.05 | 0.91 | 29,166.95 | 29,200.00 | 28,942.70 | 34,549.75 | 28,651.60 |
|
|||
Nifty FinSrv25/50 |
26,470.00 | 277.70 | 1.06 | 26,656.15 | 26,698.00 | 26,446.50 | 26,698.00 | 0.00 |
|
|||
Nifty Cons Durbl |
33,214.25 | 268.45 | 0.81 | 33,708.80 | 33,743.85 | 33,194.60 | 40,472.45 | 32,205.30 |
|
|||
Nifty Healthcare |
14,175.35 | 96.05 | 0.68 | 14,243.05 | 14,288.45 | 14,163.90 | 15,148.75 | 12,565.40 |
|
|||
Nifty Oil & Gas |
10,775.00 | 37.15 | 0.35 | 10,919.60 | 10,921.85 | 10,771.60 | 12,445.70 | 9,445.95 |
|
|||
NIFTY India Mfg |
14,224.65 | 133.75 | 0.95 | 14,354.35 | 14,360.60 | 14,220.55 | 14,360.60 | 0.00 |
|
|||
Nifty India Defence |
7,495.85 | 105.00 | 1.42 | 7,553.70 | 7,584.10 | 7,491.90 | 7,584.10 | 0.00 |
|
|||
| Other Indices | ||||||||||||
NIFTY MIDCAP 150 |
19,669.60 | 223.85 | 1.15 | 19,869.15 | 19,879.80 | 19,660.05 | 22,650.05 | 17,269.50 |
|
|||
NIFTY MIDSML 400 |
17,690.75 | 180.40 | 1.03 | 17,897.40 | 17,902.60 | 17,683.00 | 20,668.15 | 15,832.85 |
|
|||
NIFTY SMLCAP 250 |
14,345.60 | 112.75 | 0.79 | 14,556.70 | 14,556.70 | 14,339.60 | 18,077.35 | 13,314.70 |
|
|||
NIFTY MNC |
28,257.50 | 225.95 | 0.81 | 28,536.00 | 28,571.50 | 28,234.20 | 32,131.15 | 23,981.05 |
|
|||
NIFTY AlphaLowVol 30 |
24,350.60 | 215.55 | 0.89 | 24,501.80 | 24,581.50 | 24,338.95 | 24,581.50 | 0.00 |
|
|||
Nifty200 Momentum 30 |
27,723.05 | 398.10 | 1.46 | 27,876.25 | 27,940.10 | 27,706.25 | 27,940.10 | 0.00 |
|
|||
Nifty LargeMid250 |
14,798.05 | 147.95 | 1.01 | 14,933.85 | 14,943.65 | 14,790.05 | 17,077.75 | 13,526.30 |
|
|||
Nifty500 Mul50:25:25 |
14,377.85 | 131.15 | 0.92 | 14,525.90 | 14,533.05 | 14,370.50 | 16,681.75 | 13,318.60 |
|
|||
NIFTY CPSE |
6,892.95 | 1.55 | 0.02 | 7,005.30 | 7,009.75 | 6,888.50 | 7,252.05 | 5,521.95 |
|
|||
NIFTY MID SELECT |
12,323.50 | 139.95 | 1.15 | 12,453.95 | 12,461.70 | 12,314.45 | 14,118.40 | 10,382.55 |
|
|||
NIFTY IND DIGITAL |
7,383.80 | 48.35 | 0.66 | 7,470.15 | 7,473.20 | 7,377.70 | 9,723.25 | 7,233.65 |
|
|||
NIFTY M150 QLTY50 |
20,882.70 | 151.35 | 0.73 | 21,132.10 | 21,153.90 | 20,868.55 | 21,153.90 | 0.00 |
|
|||
Nifty Microcap 250 |
19,263.45 | 256.55 | 1.35 | 19,453.40 | 19,465.75 | 19,260.00 | 19,465.75 | 0.00 |
|
|||
Nifty Capital Market |
4,330.70 | 78.10 | 1.84 | 4,363.65 | 4,378.25 | 4,325.60 | 4,378.25 | 0.00 |
|
|||