- My Alerts
- Go Ad-Free
-
My Account
In App


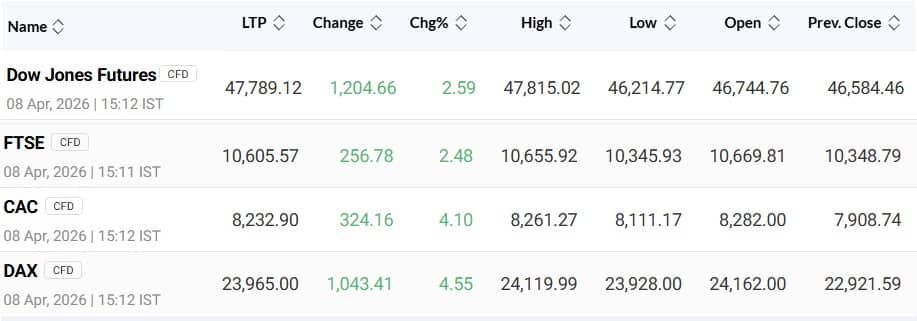
Markets will see a relief rally with short covering but continue to react to events: Kotak AMC's Nilesh Shah
Shah advised investors to remain disciplined. "Investors should follow their dharma of asset allocation. Don’t chase momentum swinging by events. Be a disciplined investor catching a falling knife," he said. ...Read More

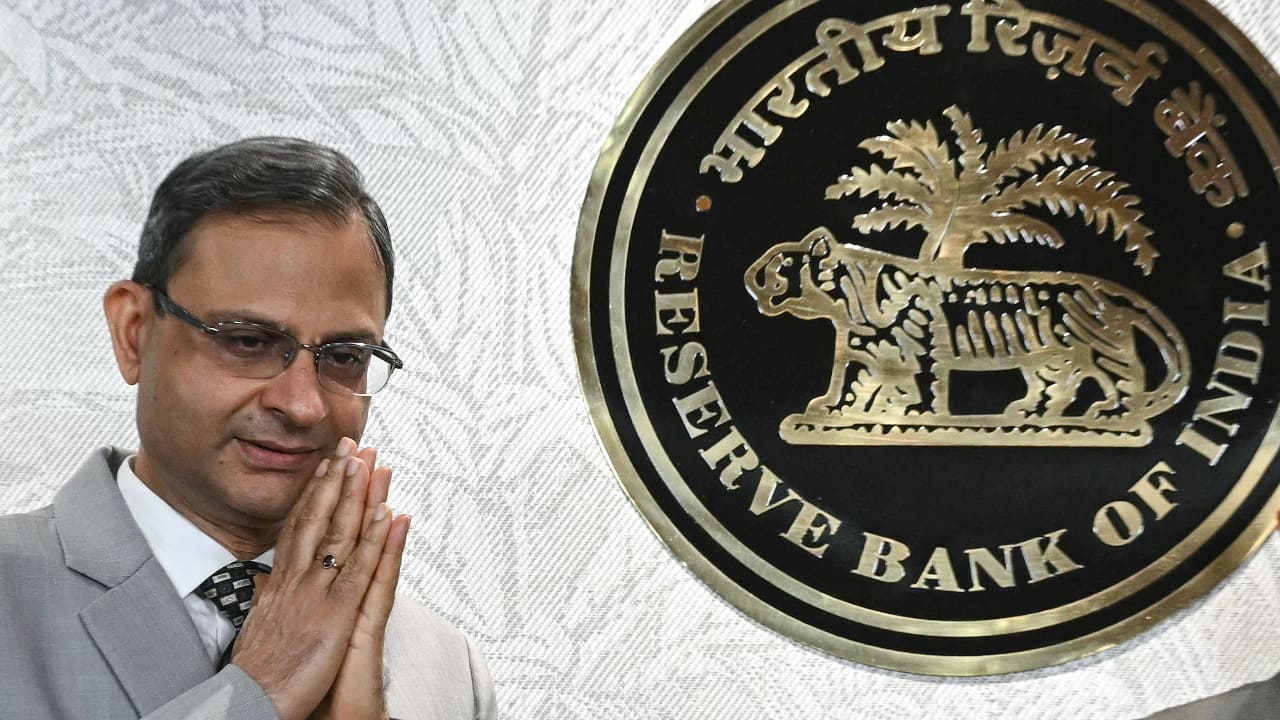
RBI widens term money market access, raises borrowing limits for primary dealers
An active term money market plays a critical role in linking the overnight money market with longer-term interest rates, improving the transmission of policy signals across the financial system, governor Sanjay Malhotra has said ...Read More

Price Action: HPCL, IOC, Petronet rally upto 8%; ONGC, Oil India dragged lower
Life Insurance Corporation of India gained 6 percent after the company announced a proposal to reward shareholders. In an exchange filing on April 7, LIC said it will hold a board meeting on April 13 to consider issuing bonus shares. ...Read More

| Name | LTP | Chg | %Chg | Open | High | Low | 52 Week High | 52 Week Low | Technical Rating | |||
|---|---|---|---|---|---|---|---|---|---|---|---|---|
| Key Indices | ||||||||||||
NIFTY 50 |
23,997.35 | 873.70 | 3.78 | 23,855.15 | 24,025.15 | 23,828.50 | 26,373.20 | 21,743.65 |
|
|||
NIFTY BANK |
55,703.90 | 2,987.65 | 5.67 | 54,904.45 | 55,778.25 | 54,797.50 | 61,764.85 | 49,156.95 |
|
|||
NIFTY Midcap 100 |
56,799.50 | 2,198.95 | 4.03 | 56,441.65 | 56,891.75 | 56,209.80 | 61,548.85 | 46,966.60 |
|
|||
NIFTY NEXT 50 |
66,145.30 | 2,994.25 | 4.74 | 65,491.35 | 66,247.25 | 65,295.05 | 70,833.65 | 57,250.25 |
|
|||
NIFTY 100 |
24,666.70 | 936.45 | 3.95 | 24,503.40 | 24,690.30 | 24,470.30 | 26,975.15 | 22,177.35 |
|
|||
Nifty 200 |
13,471.45 | 513.30 | 3.96 | 13,383.10 | 13,485.50 | 13,360.00 | 14,700.95 | 11,941.45 |
|
|||
NIFTY 500 |
22,137.10 | 840.65 | 3.95 | 21,998.60 | 22,159.50 | 21,952.40 | 24,144.20 | 19,519.85 |
|
|||
NIFTY Smallcap 100 |
16,538.05 | 694.75 | 4.39 | 16,429.75 | 16,558.35 | 16,281.55 | 19,224.95 | 14,084.30 |
|
|||
NIFTY MIDCAP 50 |
16,210.35 | 636.55 | 4.09 | 16,099.15 | 16,237.30 | 16,023.30 | 17,572.45 | 13,269.65 |
|
|||
NIFTY SMLCAP 50 |
8,078.85 | 356.70 | 4.62 | 8,000.50 | 8,089.75 | 7,939.20 | 9,282.70 | 6,776.05 |
|
|||
India VIX |
19.69 | -5.01 | -20.28 | 24.69 | 24.69 | 19.30 | 28.90 | 8.72 |
|
|||
NIFTY 750 TOTAL MKT |
12,423.35 | 472.80 | 3.96 | 12,346.75 | 12,435.60 | 12,318.40 | 12,435.60 | 0.00 |
|
|||
| Sectoral Indices | ||||||||||||
NIFTY Auto |
26,002.95 | 1,629.65 | 6.69 | 25,396.85 | 26,113.70 | 25,295.95 | 29,179.10 | 19,316.65 |
|
|||
NIFTY IT |
31,565.80 | 162.45 | 0.52 | 31,786.70 | 31,946.75 | 31,272.80 | 40,301.40 | 28,288.05 |
|
|||
NIFTY PSU Bank |
8,716.10 | 451.30 | 5.46 | 8,611.00 | 8,749.55 | 8,600.70 | 9,918.65 | 5,904.10 |
|
|||
NIFTY Fin Service |
26,053.05 | 1,367.50 | 5.54 | 25,688.65 | 26,094.30 | 25,623.90 | 28,562.50 | 23,373.95 |
|
|||
NIFTY Pharma |
21,991.20 | 122.50 | 0.56 | 22,203.50 | 22,250.50 | 21,829.60 | 23,540.90 | 19,121.10 |
|
|||
NIFTY FMCG |
47,704.25 | 724.15 | 1.54 | 47,851.65 | 48,076.80 | 47,648.30 | 58,485.05 | 45,334.15 |
|
|||
NIFTY Metal |
12,078.95 | 316.30 | 2.69 | 12,065.10 | 12,140.25 | 11,984.50 | 12,509.75 | 7,690.20 |
|
|||
NIFTY Realty |
745.75 | 47.15 | 6.75 | 732.65 | 749.75 | 731.05 | 1,049.70 | 638.65 |
|
|||
NIFTY Media |
1,349.75 | 38.85 | 2.96 | 1,347.45 | 1,361.50 | 1,334.05 | 1,786.15 | 1,245.05 |
|
|||
NIFTY Energy |
36,469.20 | 890.95 | 2.50 | 36,381.80 | 36,506.40 | 36,030.85 | 37,306.50 | 29,802.20 |
|
|||
Nifty Pvt Bank |
26,727.80 | 1,406.65 | 5.56 | 26,369.10 | 26,750.30 | 26,273.95 | 29,748.45 | 23,957.45 |
|
|||
NIFTY Infra |
9,067.30 | 359.80 | 4.13 | 9,005.90 | 9,081.30 | 8,970.25 | 9,792.60 | 7,775.80 |
|
|||
NIFTY Commodities |
9,644.35 | 281.65 | 3.01 | 9,604.45 | 9,659.55 | 9,566.10 | 10,078.60 | 7,601.40 |
|
|||
NIFTY Consumption |
11,092.95 | 388.55 | 3.63 | 11,029.95 | 11,141.30 | 10,999.15 | 12,716.20 | 10,159.85 |
|
|||
NIFTY PSE |
10,017.80 | 188.65 | 1.92 | 10,056.30 | 10,057.15 | 9,930.70 | 10,544.05 | 8,457.60 |
|
|||
NIFTY Services |
30,867.95 | 1,171.05 | 3.94 | 30,674.55 | 30,894.05 | 30,614.00 | 34,549.75 | 28,232.65 |
|
|||
Nifty FinSrv25/50 |
28,356.20 | 1,457.20 | 5.42 | 27,995.10 | 28,420.25 | 27,913.65 | 28,420.25 | 0.00 |
|
|||
Nifty Cons Durbl |
35,929.40 | 1,784.30 | 5.23 | 35,328.20 | 35,997.10 | 35,083.60 | 40,472.45 | 32,205.30 |
|
|||
Nifty Healthcare |
14,077.85 | 84.90 | 0.61 | 14,190.80 | 14,251.35 | 13,989.20 | 15,148.75 | 12,565.40 |
|
|||
Nifty Oil & Gas |
11,135.25 | 387.95 | 3.61 | 11,065.30 | 11,153.25 | 10,985.10 | 12,445.70 | 9,445.95 |
|
|||
NIFTY India Mfg |
14,894.65 | 537.00 | 3.74 | 14,818.50 | 14,917.95 | 14,765.65 | 14,917.95 | 0.00 |
|
|||
Nifty India Defence |
8,051.50 | 251.85 | 3.23 | 8,080.30 | 8,080.45 | 7,953.80 | 8,080.45 | 0.00 |
|
|||
| Other Indices | ||||||||||||
NIFTY MIDCAP 150 |
20,909.45 | 798.55 | 3.97 | 20,783.35 | 20,942.90 | 20,700.05 | 22,650.05 | 17,269.50 |
|
|||
NIFTY MIDSML 400 |
18,901.35 | 718.30 | 3.95 | 18,799.60 | 18,925.85 | 18,691.60 | 20,668.15 | 15,832.85 |
|
|||
NIFTY SMLCAP 250 |
15,483.50 | 582.55 | 3.91 | 15,420.45 | 15,498.85 | 15,260.05 | 18,077.35 | 13,314.70 |
|
|||
NIFTY MNC |
29,715.05 | 938.80 | 3.26 | 29,580.40 | 29,828.05 | 29,504.85 | 32,131.15 | 23,981.05 |
|
|||
NIFTY AlphaLowVol 30 |
25,345.45 | 886.45 | 3.62 | 25,254.75 | 25,437.25 | 25,161.15 | 25,437.25 | 0.00 |
|
|||
Nifty200 Momentum 30 |
29,917.65 | 1,621.75 | 5.73 | 29,437.35 | 29,971.70 | 29,386.80 | 29,971.70 | 0.00 |
|
|||
Nifty LargeMid250 |
15,699.60 | 597.80 | 3.96 | 15,600.25 | 15,718.05 | 15,560.50 | 17,077.75 | 13,526.30 |
|
|||
Nifty500 Mul50:25:25 |
15,311.35 | 580.80 | 3.94 | 15,222.10 | 15,326.70 | 15,172.30 | 16,681.75 | 13,318.60 |
|
|||
NIFTY CPSE |
7,049.80 | -0.55 | -0.01 | 7,124.45 | 7,124.45 | 7,002.25 | 7,252.05 | 5,521.95 |
|
|||
NIFTY MID SELECT |
13,219.90 | 599.05 | 4.75 | 13,065.15 | 13,242.95 | 13,019.00 | 14,118.40 | 10,382.55 |
|
|||
NIFTY IND DIGITAL |
7,879.80 | 177.00 | 2.30 | 7,897.95 | 7,906.75 | 7,808.50 | 9,723.25 | 7,233.65 |
|
|||
NIFTY M150 QLTY50 |
22,192.50 | 685.80 | 3.19 | 22,216.10 | 22,240.65 | 22,080.40 | 22,240.65 | 0.00 |
|
|||
Nifty Microcap 250 |
21,021.60 | 845.80 | 4.19 | 20,941.80 | 21,041.65 | 20,678.95 | 21,041.65 | 0.00 |
|
|||
Nifty Capital Market |
4,793.15 | 259.75 | 5.73 | 4,723.20 | 4,808.75 | 4,683.50 | 4,808.75 | 0.00 |
|
|||