


After touching a record high near 26,300 last Friday, the Nifty 50 has pulled back nearly 2 percent over the last three sessions. Experts attribute this to overbought market conditions following the recent rally. Additionally, concerns around China’s stimulus—which could lead foreign investors to shift from Indian equities—and uncertainty over the Iran-Israel conflict are adding pressure. Analysts suggest that the market could favour bears in the coming sessions. Immediate support for the index is seen at 25,700, with a crucial level at 25,500, while resistance is expected around the 25,900-26,000 range. Here’s a look at the ‘buy on dip’ opportunities and stocks to avoid, according to market experts.
Strong Buy Calls
Ashish Kyal, CMT, Author and Founder of Waves Strategy Advisors
Britannia Industries | CMP: Rs 6,446
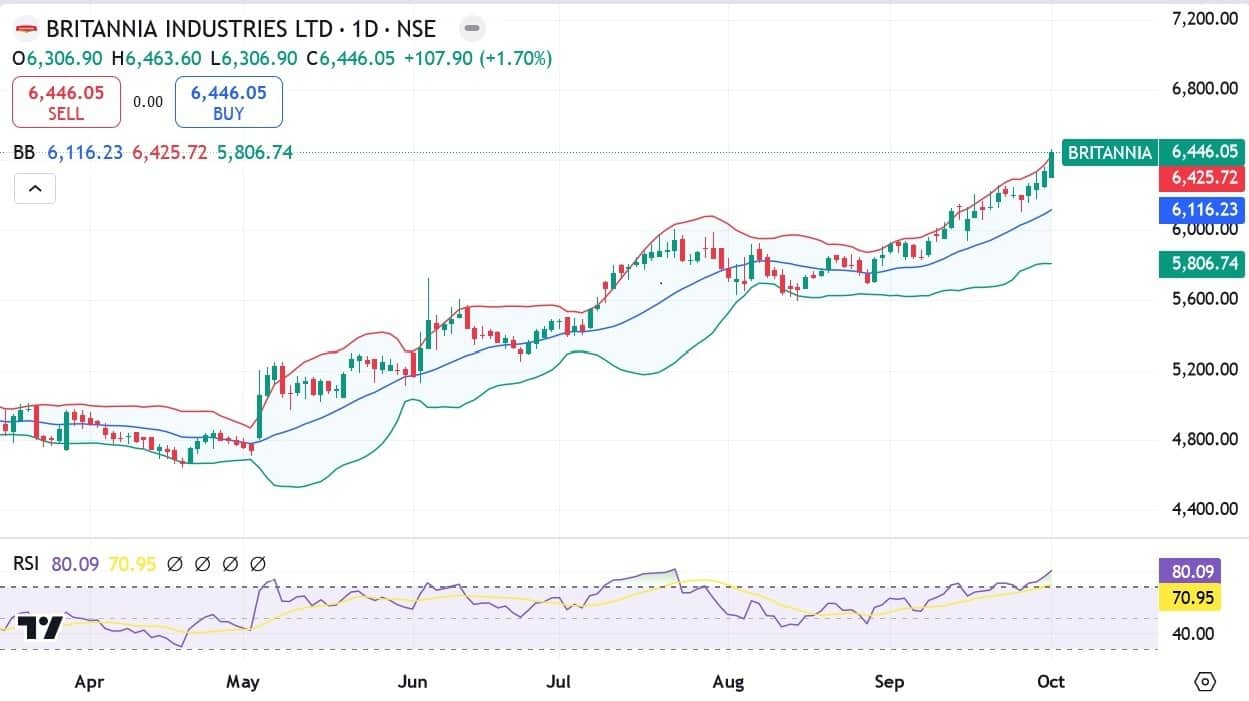
On the daily chart, Britannia has consistently made higher highs, gaining nearly 5 percent since September 26, reflecting increasing positive momentum. In the previous session, prices reached a fresh record high of Rs 6,463, despite Nifty’s sluggish movement, highlighting the strength of the underlying trend. Currently, prices have closed above the Upper Bollinger Bands, showcasing accelerated buying pressure. In a nutshell, the trend for Britannia is positive. Use dips towards Rs 6,300 as a buying opportunity.
Strategy: Buy
Target: Rs 6,750
Stop-Loss: Rs 6,100
Bajaj Finance | CMP: Rs 7,703
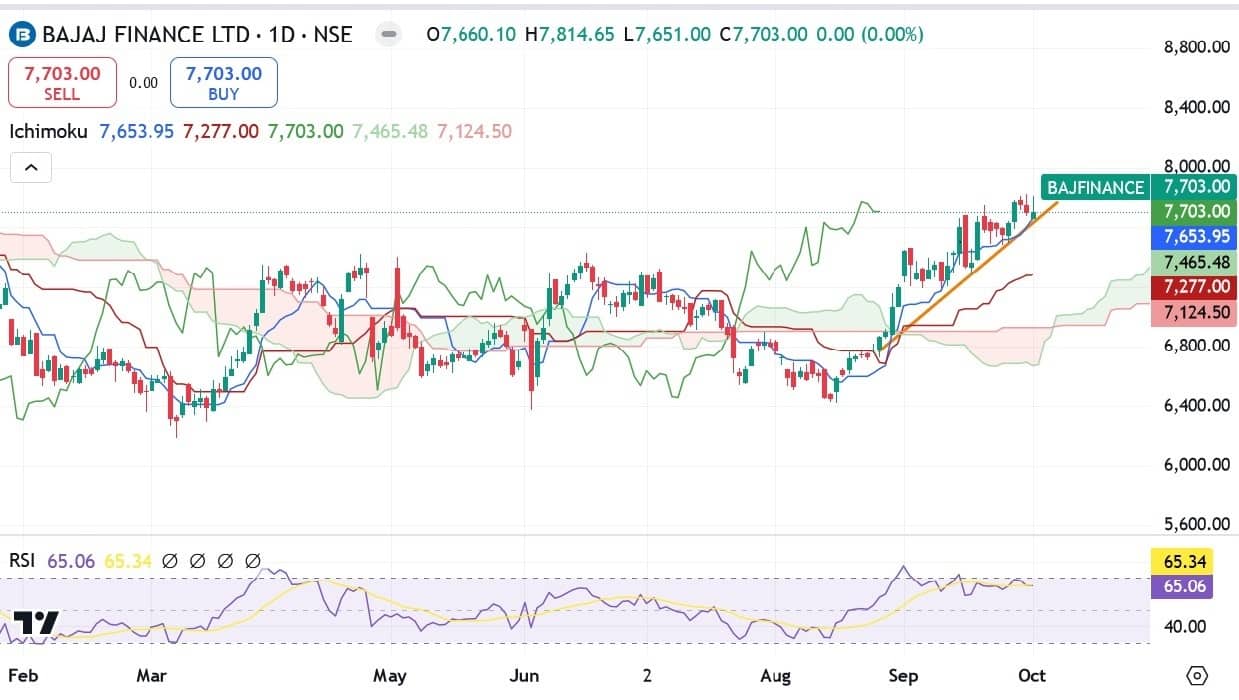
On the daily chart, Bajaj Finance prices have consistently bounced upward from its trendline, indicating increasing bullishness. Although minor dips toward the trendline were witnessed, prices closed above it, keeping the trend on the positive side. Currently, prices are trading above the Convergence line and the base line of the Ichimoku Cloud Indicator, which highlights the increasing strength of the underlying trend. Also, the RSI (Relative Strength Index) is at the 65 level, which gives space for the underlying to trend further. In a nutshell, the overall trend for Bajaj Finance is positive. A break above Rs 7,815 could lift prices to Rs 8,400, as long as Rs 7,500 holds on the downside.
Strategy: Buy
Target: Rs 8,400
Stop-Loss: Rs 7,500
Chandan Taparia, Senior Vice President | Analyst-Derivatives at Motilal Oswal Financial Services
Century Textiles and Industries | CMP: Rs 2,891
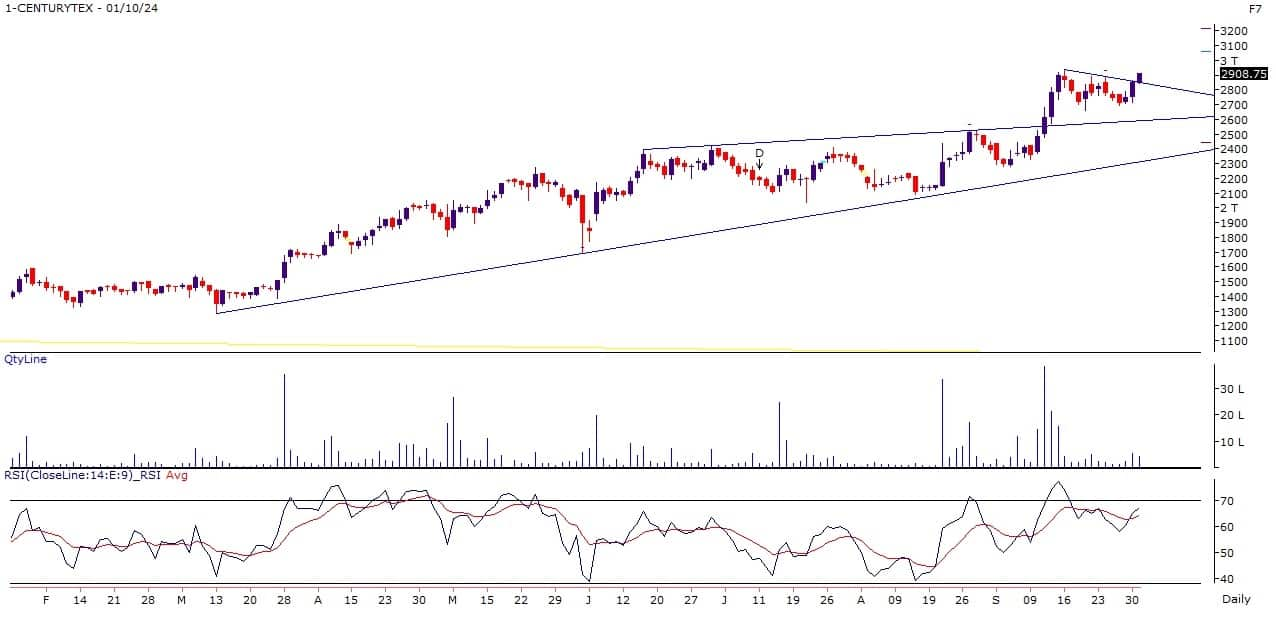
Century Textiles has been forming a higher top - higher bottom pattern on the monthly scale and is set for the next leg of its rally after consolidating for the last 13 trading sessions. It has formed a Pole and Flag pattern on the daily scale, which has bullish implications. The stock has held well above its rising support trendline, and the recent price setup suggests momentum could extend toward the Rs 3,250 zone.
Strategy: Buy
Target: Rs 3,250
Stop-Loss: Rs 2,730
ABB India | CMP: Rs 8,268

ABB India has broken out of a narrow range on the monthly charts and given a falling supply trendline breakout on the weekly scale. It is moving upward after a long consolidation period of 52 trading sessions. Buying is visible across the capital goods space, which may push prices higher. The RSI oscillator is positively placed, supporting an upward move toward the Rs 8,600-8,888 zones.
Strategy: Buy
Target: Rs 8,800
Stop-Loss: Rs 8,000
Rohan Shah, Technical Analyst at Asit C Mehta Investment Interrmediates
NMDC | CMP: Rs 244.5
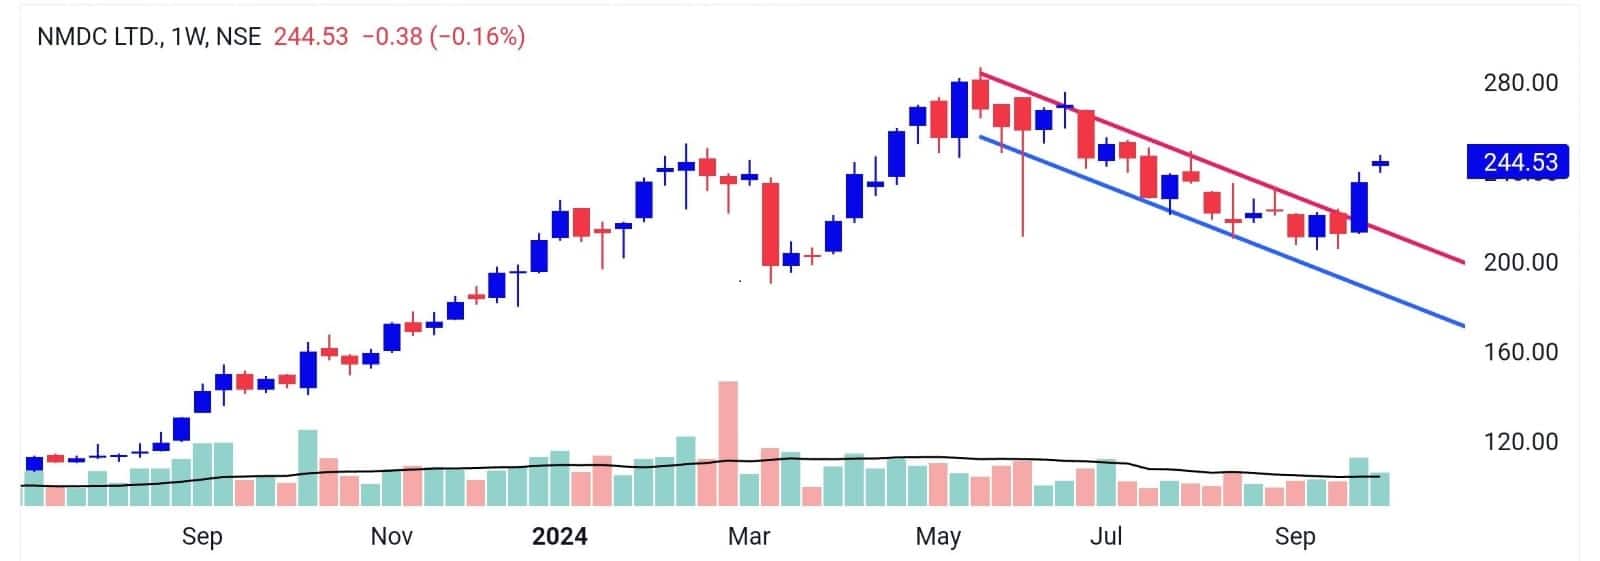
NMDC has registered a decisive breakout from a declining regression channel, indicating a potential shift from a downtrend to an uptrend. The breakout has been accompanied by a strong surge in volume and momentum, providing further confirmation. We expect the upward momentum to continue, and the stock may gradually challenge its previous swing high.
Strategy: Buy
Target: Rs 275
Stop-Loss: Rs 229
Indraprastha Gas | CMP: Rs 558.4
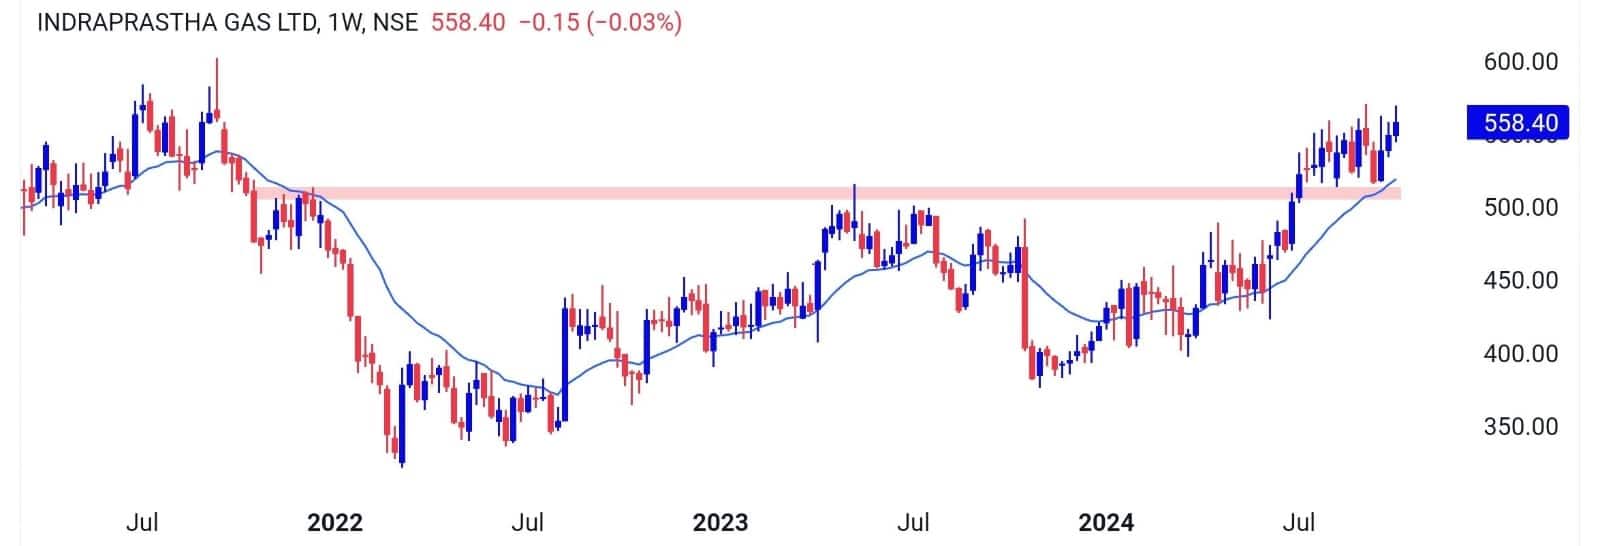
Indraprastha Gas has been trading in a range, finding support around its previous multi-month supply zone of Rs 520-510. The volume activity during this rangebound price action has been robust, with strong volume on up days and relatively lower volume on down days. Considering the price action and volume activity, we believe the stock is set to resume its uptrend and challenge its record high levels.
Strategy: Buy
Target: Rs 600
Stop-Loss: Rs 535
Virat Jagad, Technical Research Analyst at Bonanza Portfolio
Chambal Fertilisers & Chemicals | CMP: Rs 547.5
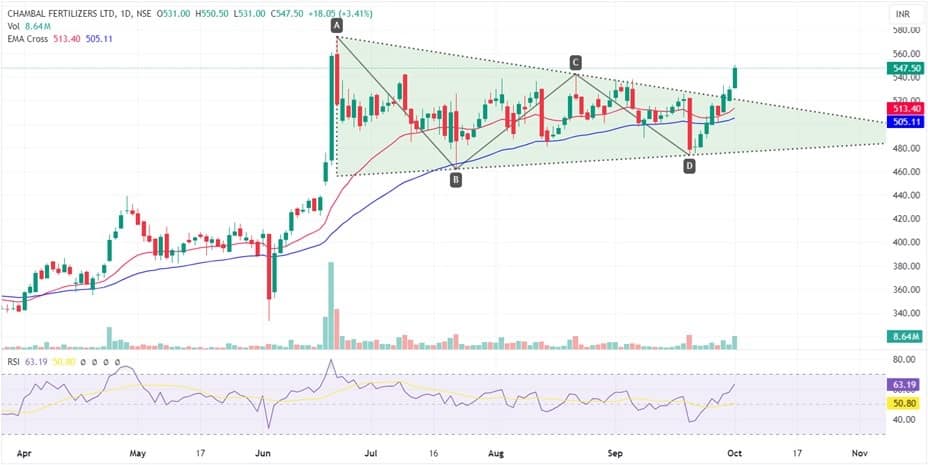
On the daily timeframe, Chambal Fertilisers & Chemicals has given a breakout from a descending triangle pattern, indicating that bulls are in control of the stock. The fast (21) EMA (Exponential Moving Average) has crossed the slow (50) EMA, indicating a positive trend, with the price trading above both EMAs, reflecting strength on the upside. The Momentum Indicator RSI is trending northward, showing strong buying interest in the stock.
Strategy: Buy
Target: Rs 600
Stop-Loss: Rs 520
Caplin Point Laboratories | CMP: Rs 2,078
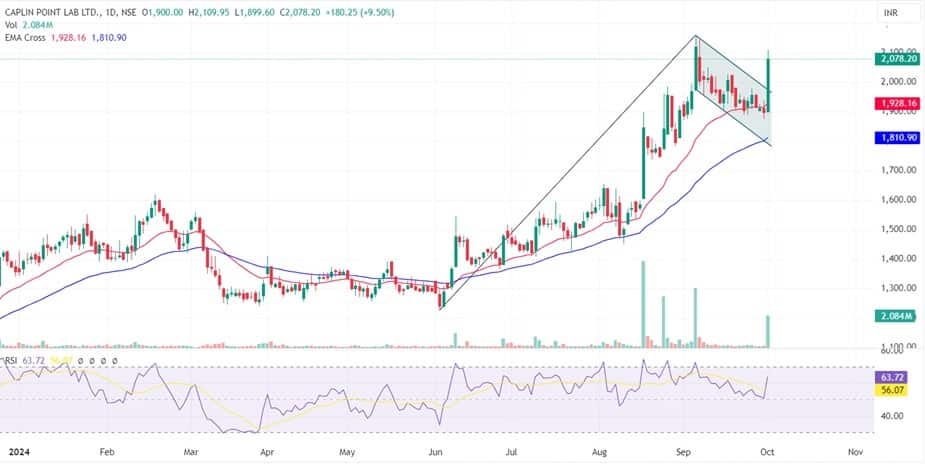
On the daily timeframe, Caplin Point has formed a Flag and Pole pattern. The current formation reflects bullish price action, indicating that buyers are keen on the stock and expect it to move higher. The stock is trading above key EMAs, which indicates a positive trend. The 20-day EMA has acted as a strong demand zone and may provide support in the coming period. The MACD indicator shows a positive crossover, confirming bullish momentum in the stock.
Strategy: Buy
Target: Rs 2,400
Stop-Loss: Rs 1,930
Stocks To Sell
Ashish Kyal, CMT, Author and Founder of Waves Strategy Advisors
Indian Raliway Finance Corporation | CMP: Rs 155.3

On the daily chart, IRFC has respected the resistance trendline, reversing downward from it, indicating that bears are in control. The Ichimoku Cloud's conversion line has acted as immediate resistance, maintaining a bearish tone and reinforcing negative sentiment. Currently, prices are trading below the convergence line, which could accelerate selling pressure. Also, the ADX (Average Directional Index) is at 49, supporting the likelihood of a continued downtrend. In a nutshell, the overall trend for IRFC is negative. A "sell on rise" strategy is recommended, with an entry around Rs 160, a target of Rs 145-150, and a stop-loss at Rs 165.
Strategy: Sell
Target: Rs 145, Rs 150
Stop-Loss: Rs 165
Swan Energy | CMP: Rs 568
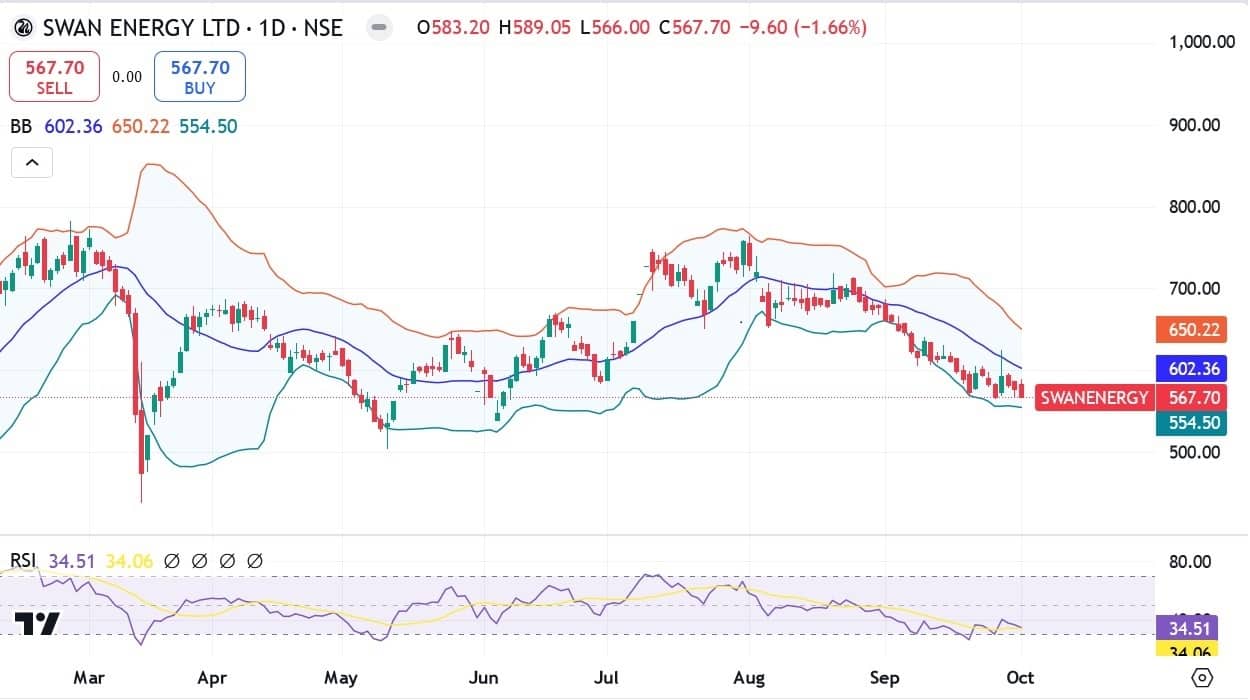
Swan Energy is currently consolidating within a downtrend between Rs 565 and Rs 595, indicating indecision. A break below this consolidation range could signal accelerated selling pressure. Prices are trading near the lower Bollinger Band, suggesting the trend remains negative. The current trend is sideways; a "sell on high" strategy is recommended, with an entry around Rs 575 and a target of Rs 555, as long as Rs 600 holds on the upside.
Strategy: Sell
Target: Rs 555
Stop-Loss: Rs 600
Chandan Taparia, Senior Vice President | Analyst-Derivatives at Motilal Oswal Financial Services
Aurobindo Pharma | CMP: Rs 1,438
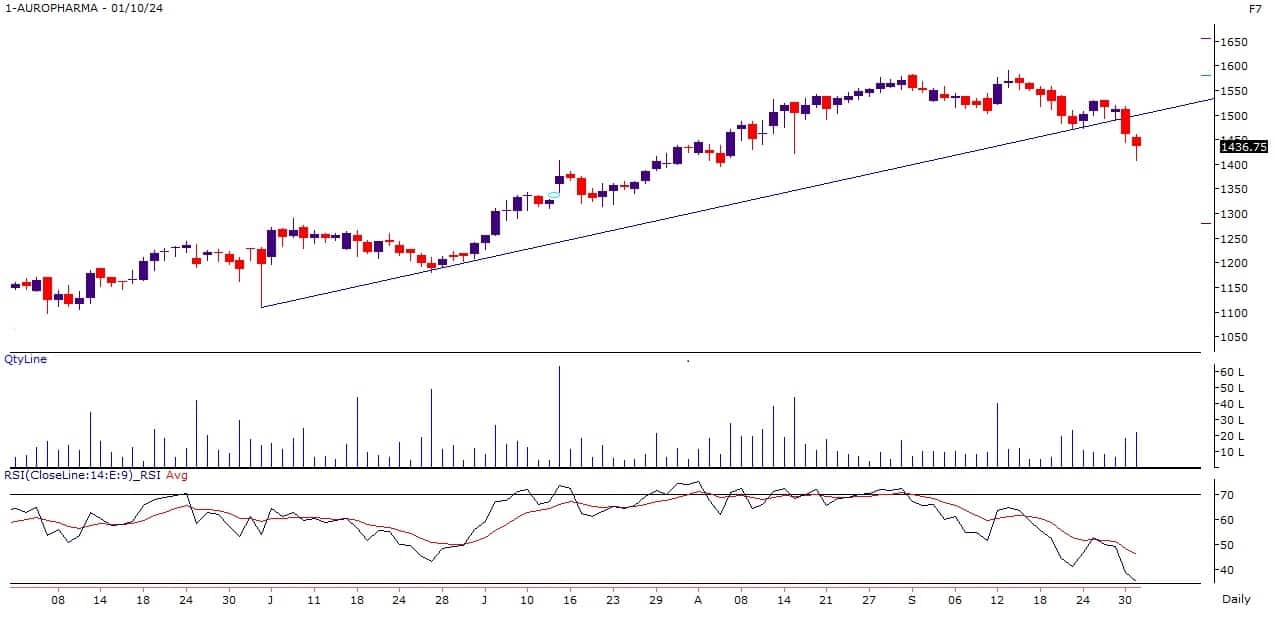
Aurobindo Pharma has been forming a lower top - lower bottom pattern on the weekly and daily scales. It has broken down from its rising support trendline, and resistances are gradually shifting lower. As long as the stock stays below the Rs 1,480 zone, any bounce can be sold, with a downside target of Rs 1,345.
Strategy: Sell
Target: Rs 1,345
Stop-Loss: Rs 1,480
Punjab National Bank | CMP: Rs 105.2

PNB has also been forming a lower top - lower bottom pattern on daily, weekly, and monthly scales. It is trading at its lowest level in the past eight months, with most technical indicators in bearish zones. Every small bounce could be sold, with a stop-loss at Rs 109 and a target of Rs 97.
Strategy: Sell
Target: Rs 97
Stop-Loss: Rs 109
Rohan Shah, Technical Analyst at Asit C Mehta Investment Interrmediates
Astral | CMP: Rs 1,974.5
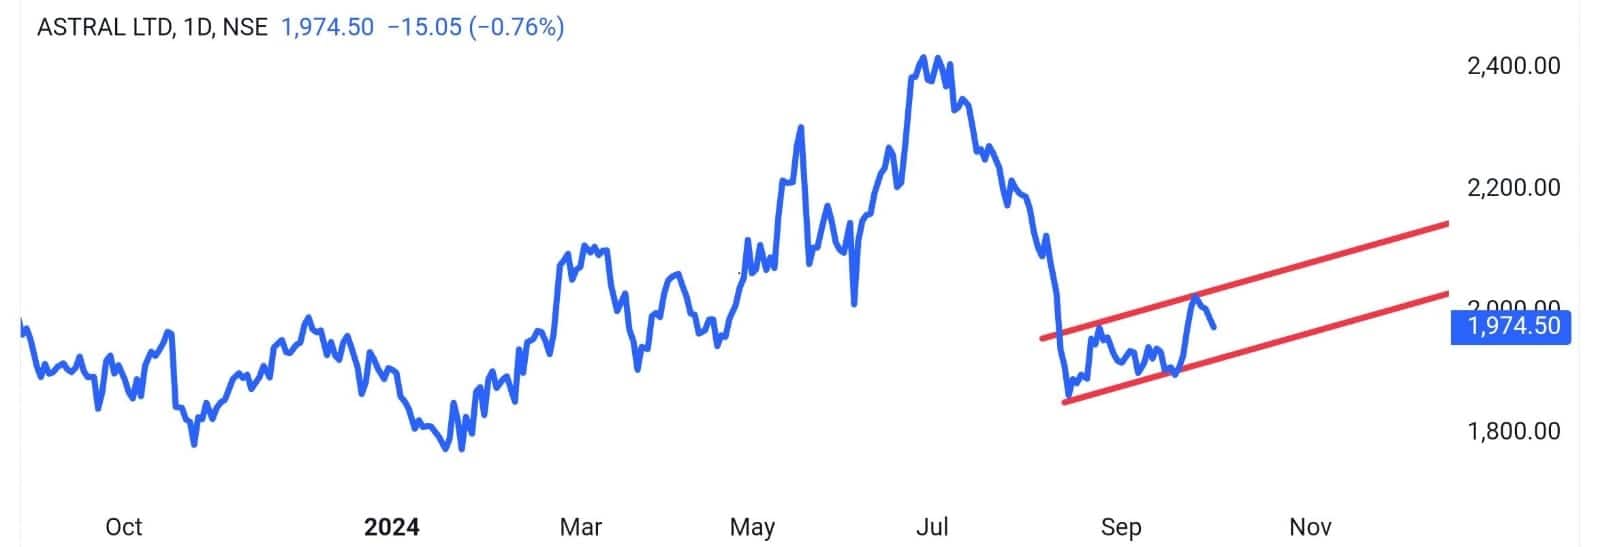
Astral has tumbled sharply from record highs, forming large red candles. After a sharp decline, the stock witnessed a small dead cat bounce, forming a potential bearish Flag pattern, typically a trend continuation pattern. We expect the stock to break down from this pattern and resume its decline.
Strategy: Sell
Target: Rs 1,800
Stop-Loss: Rs 2,060
Bata India | CMP: Rs 1,427.4
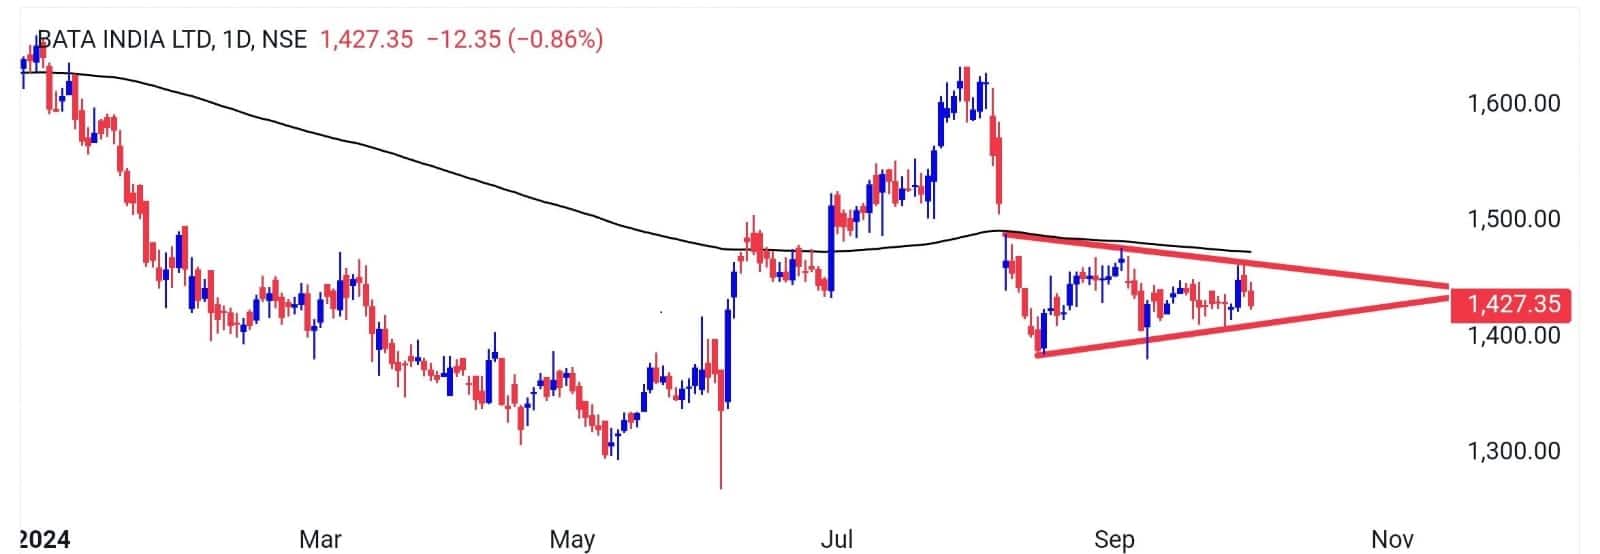
Bata India has underperformed compared to the benchmark index and has been forming lower highs and lows, indicating weakness. On the daily chart, the stock consistently faces resistance around the 200 EMA and is trading in a potential pennant pattern. Given the price action and volume activity, a breakdown from the pattern is expected, with downward momentum likely to resume.
Strategy: Sell
Target: Rs 1,325
Stop-Loss: Rs 1,475
Virat Jagad, Technical Research Analyst at Bonanza Portfolio
Bandhan Bank | CMP: Rs 195.3
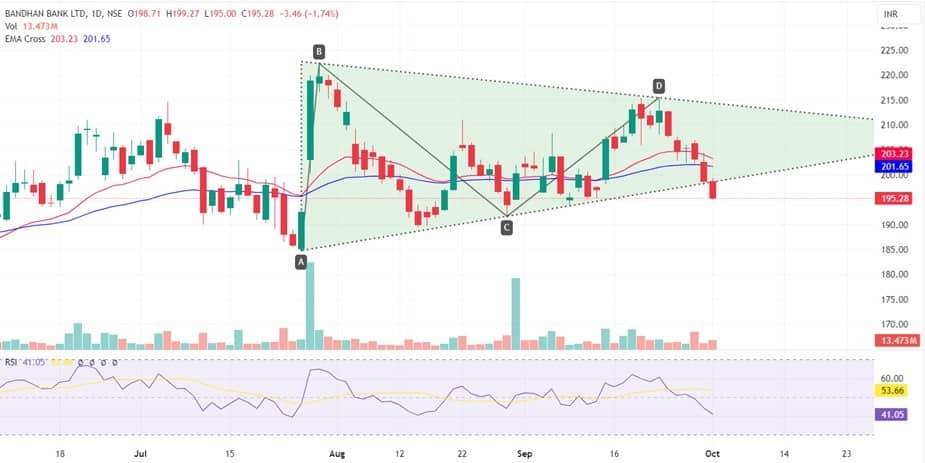
On the daily timeframe, Bandhan Bank has broken down from a Symmetric Triangle pattern, signaling bearish control. Both the fast (21) EMA and slow (50) EMA are trending downward, indicating a negative trend. The price is trading below both EMAs, highlighting weakness. The RSI has fallen below the midpoint, reflecting increased selling pressure.
Strategy: Sell
Target: Rs 182
Stop-Loss: Rs 202
Muthoot Finance | CMP: Rs 1,956

On the daily timeframe, Muthoot Finance has broken down from a rising wedge formation, signaling bearish control. The price has fallen below the 20-day EMA, signaling weakness. The bearish outlook is reinforced by a negative crossover on the MACD indicator, which aligns with the downward momentum. The RSI has also dropped below the midpoint, suggesting further downside risk in the near term.
Strategy: Sell
Target: Rs 1,850
Stop-Loss: Rs 2,000
Stocks To Avoid
Ashish Kyal, CMT, Author and Founder of Waves Strategy Advisors
State Bank of India | CMP: Rs 797
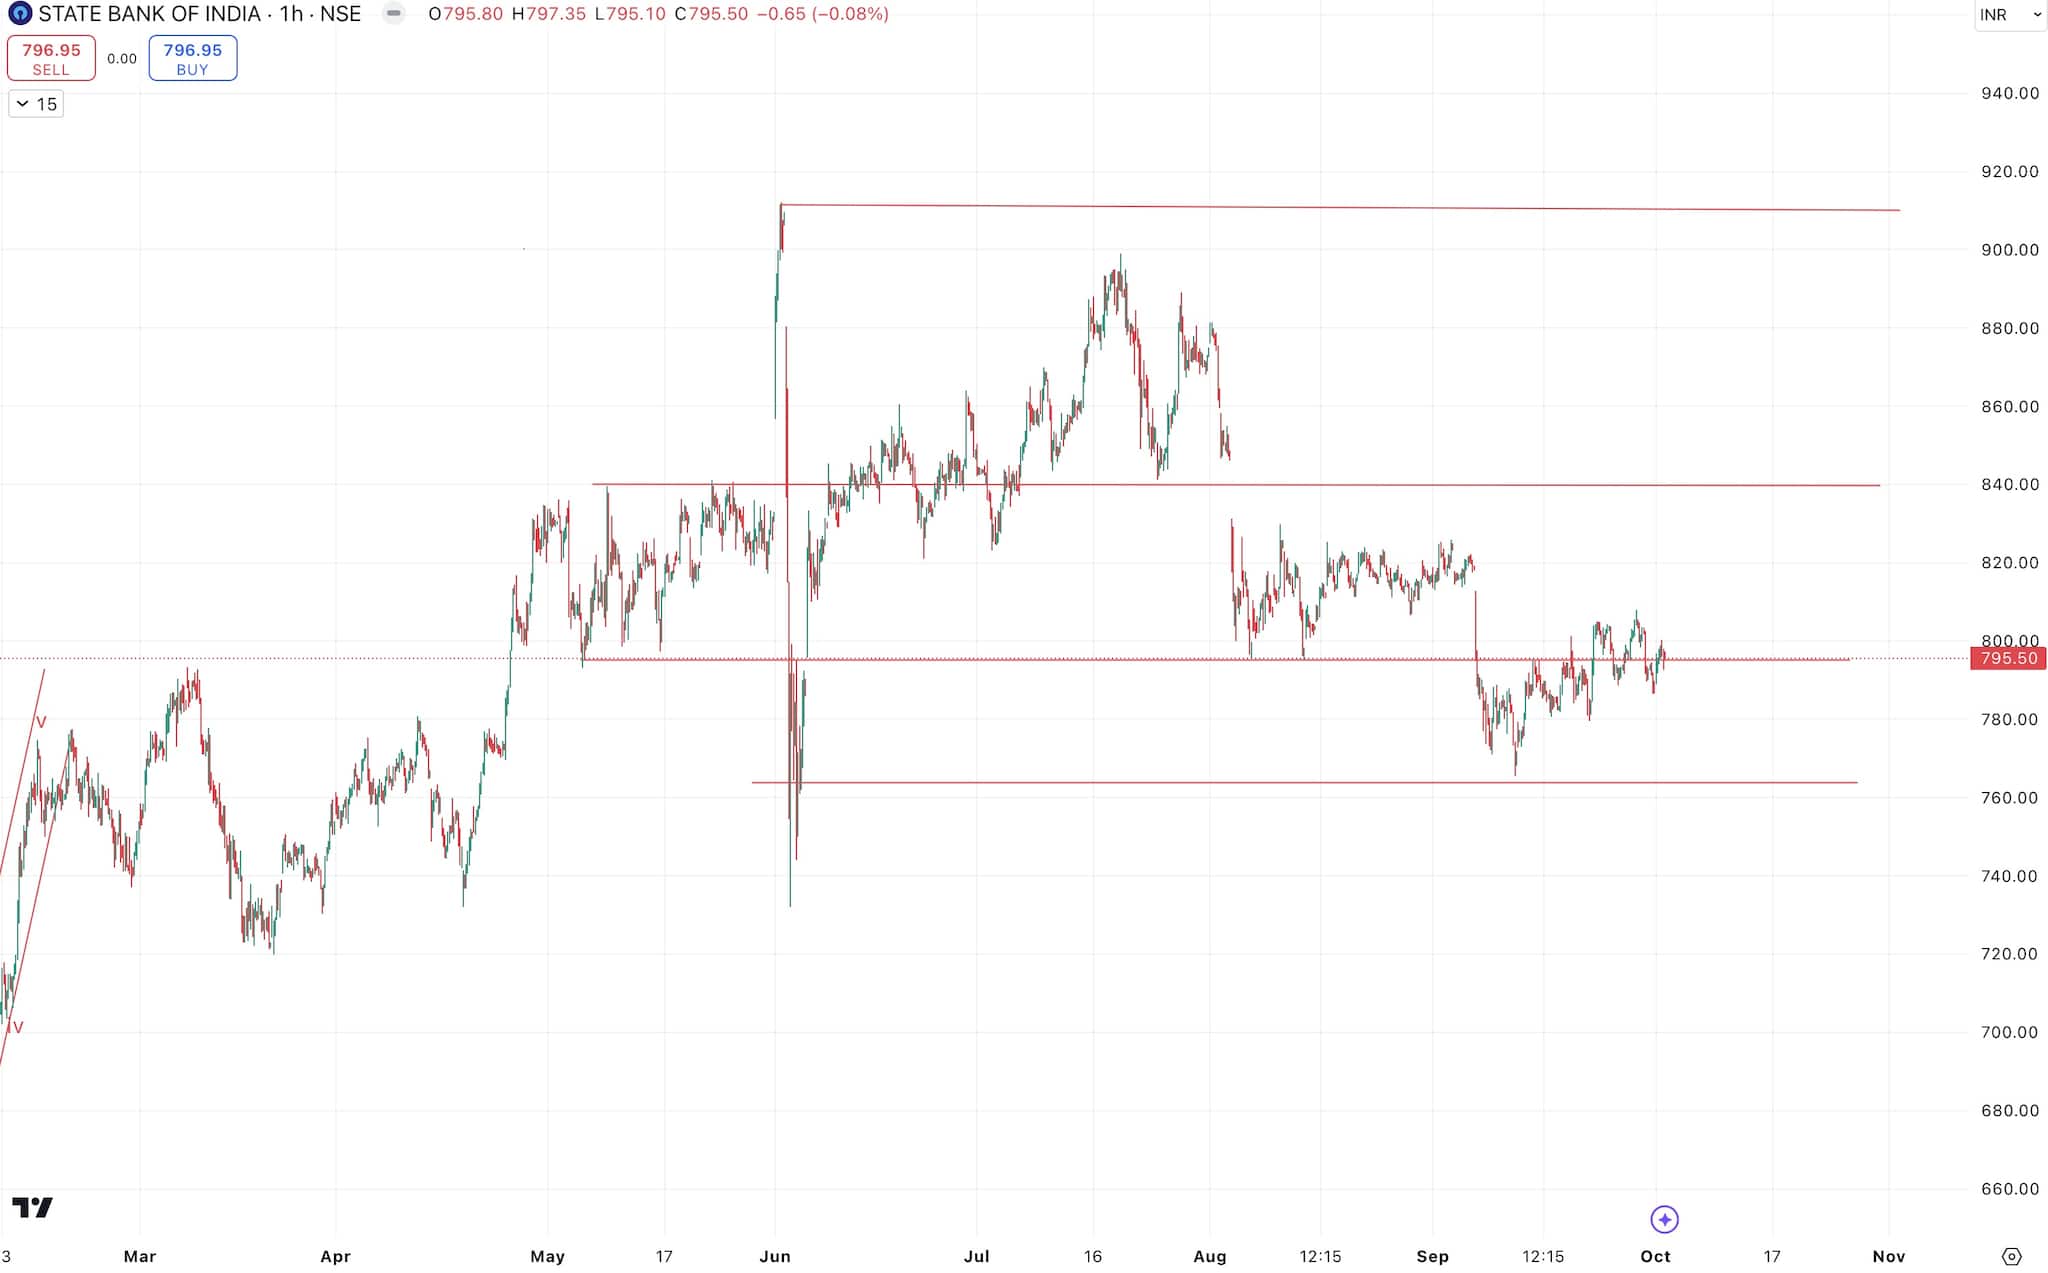
SBI has been moving within a range since June 4, with no clear direction. The stock has made false moves on either side. It is best to avoid this stock until a clear trend emerges. A break below Rs 760 or above Rs 840 is required before a fresh trading opportunity arises.
ACC | CMP: Rs 2,511
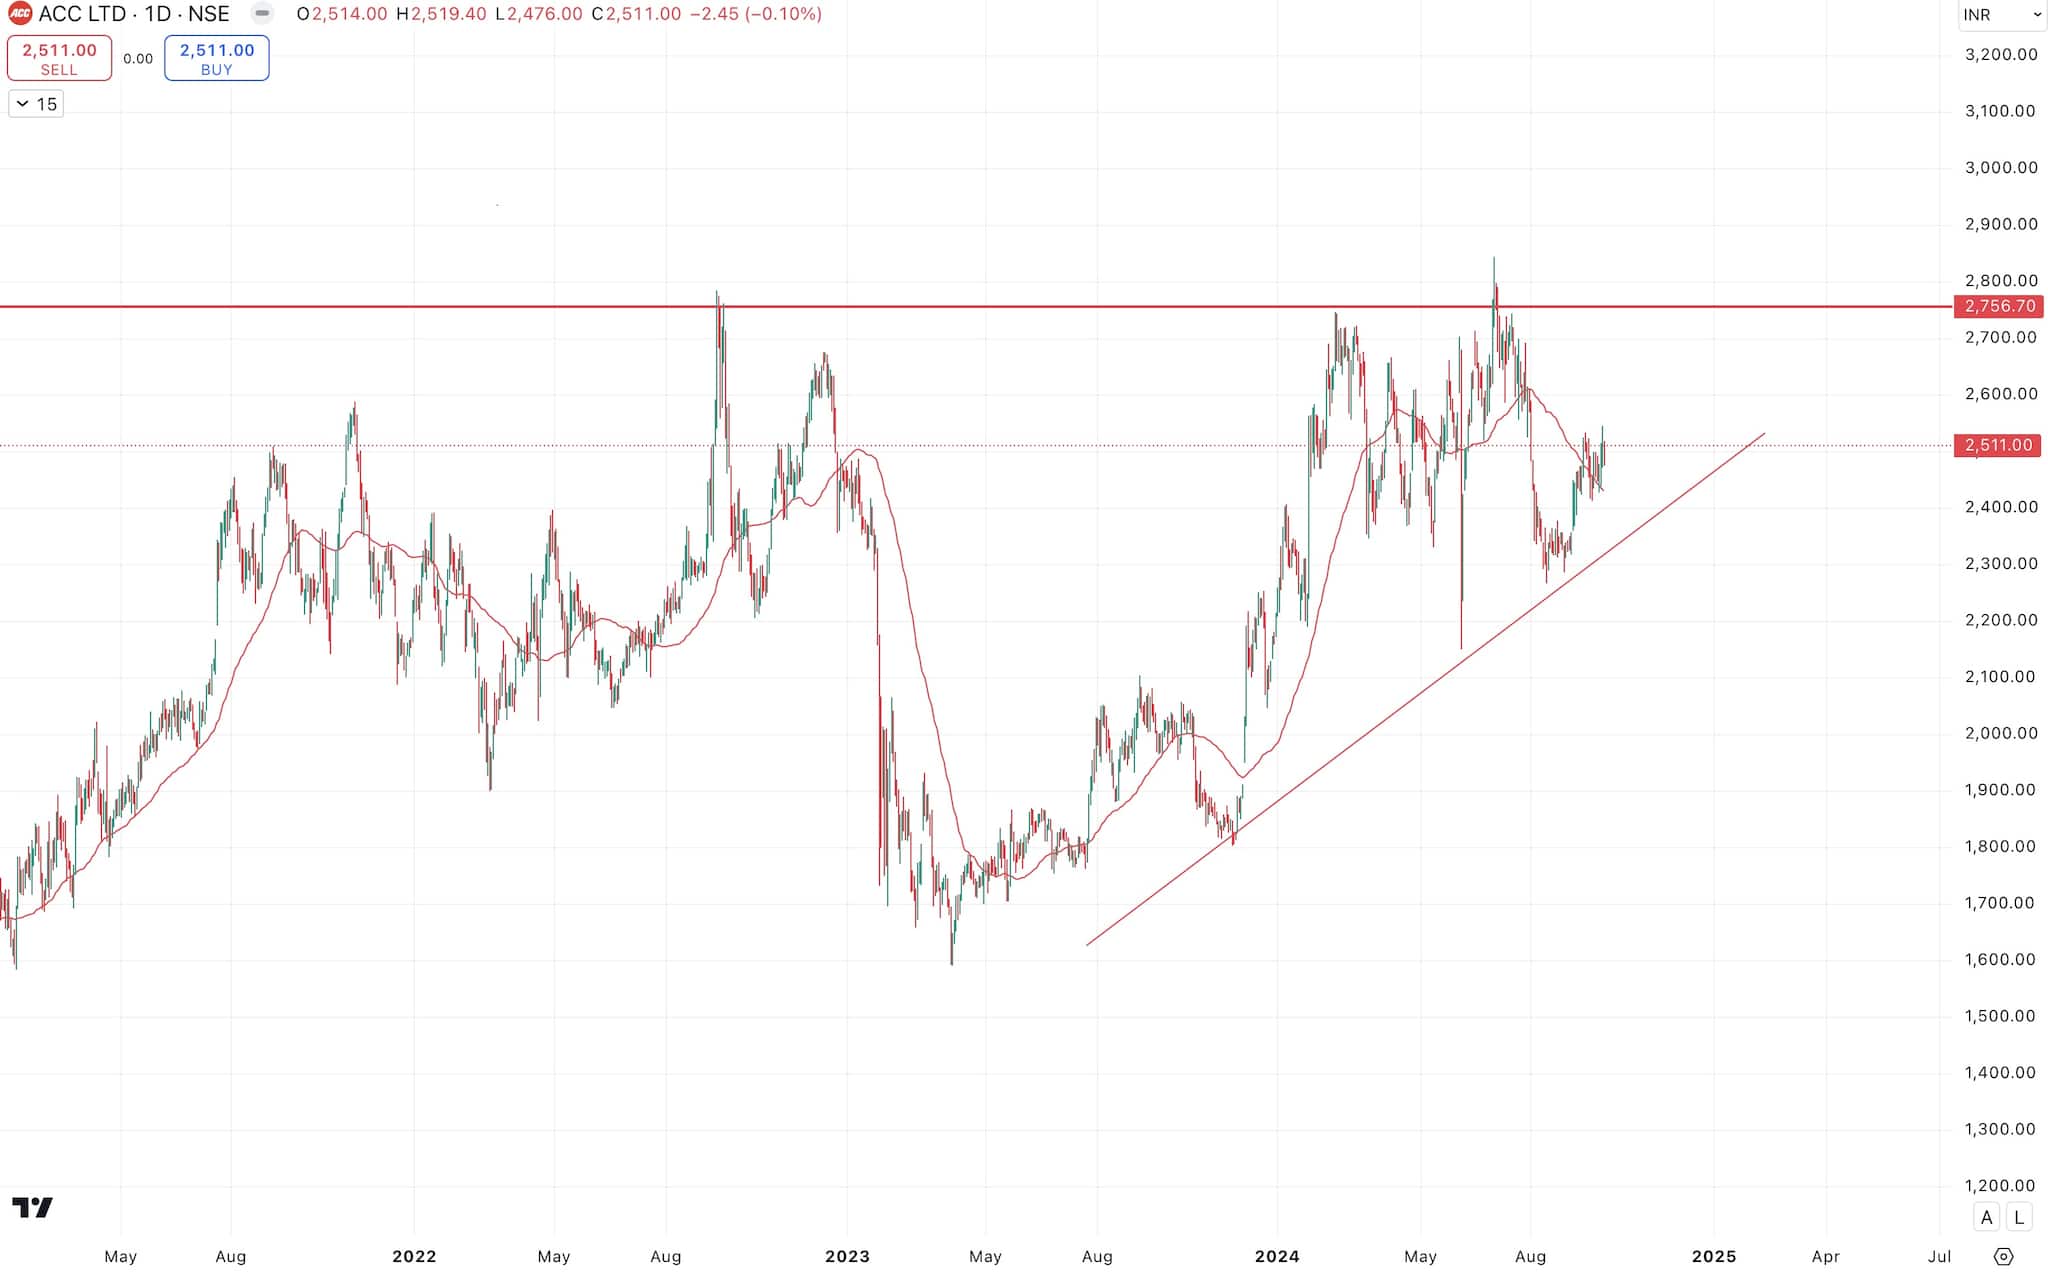
ACC has been moving lacklustre after a sharp fall in August. While the stock is showing some retracement on the upside, it is best to avoid it unless it breaks resistance around Rs 2,700. Above this level, the stock could break out and trend toward Rs 3,100. Until then, sideways action is expected, with support near Rs 2,300.
Chandan Taparia, Senior Vice President | Analyst-Derivatives at Motilal Oswal Financial Services
Delta Corp | CMP: Rs 128.5

Delta Corp has been stuck in a broad trading range, where supports are intact, but every small bounce gets sold. The RSI has flattened, providing no clear buy or sell signal. The support is at Rs 123, and resistance is at Rs 138.
Zee Entertainment Enterprises | CMP: Rs 140

Zee Entertainment is a tricky stock for traders and investors as it often turns volatile due to company-specific news. It has been moving in a downward slope, but multiple supports remain intact near Rs 125-120. The RSI provides no clear signal, and small bounces often fade. The support is at Rs 132, with a hurdle at Rs 145-148.
Rohan Shah, Technical Analyst at Asit C Mehta Investment Interrmediates
InterGlobe Aviation | CMP: Rs 4,905
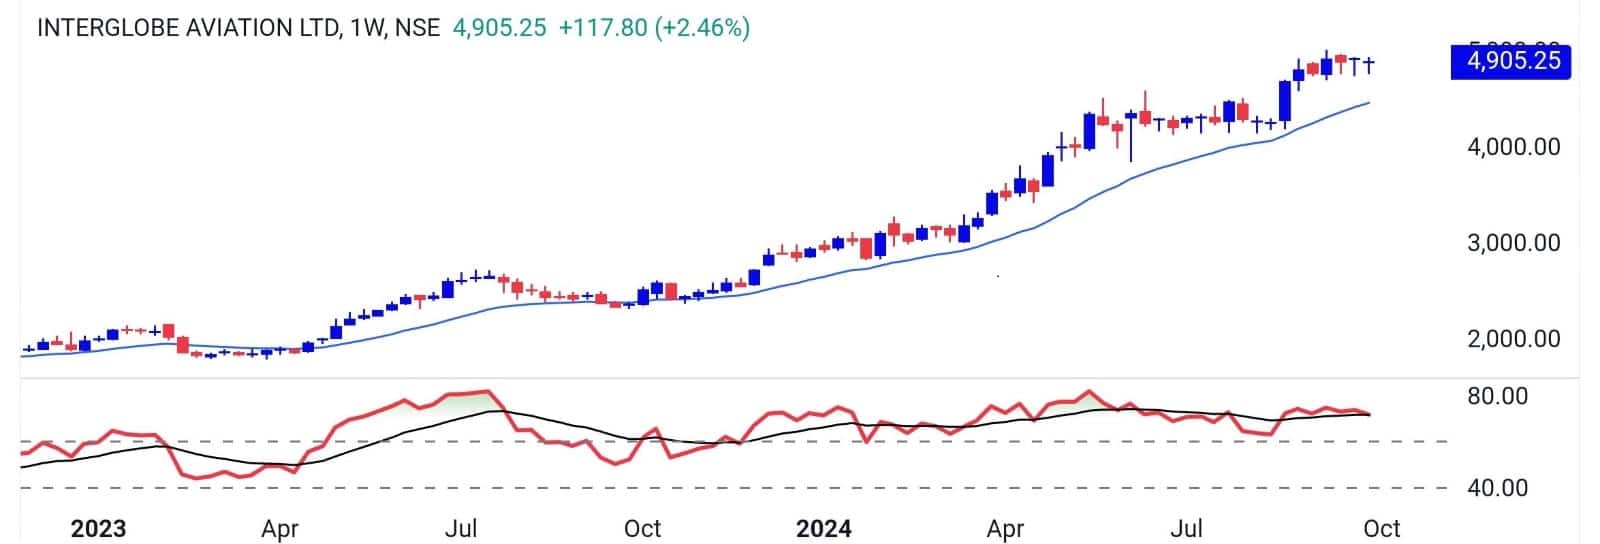
InterGlobe Aviation has been in a strong uptrend for several months. However, considering the Middle East uncertainty and rising crude oil prices, the stock price may be impacted. The stock is trading in a tight range near its high, with negative divergence in the momentum indicator against the price. On the daily chart, a potential Head & Shoulders pattern is forming (yet to confirm), suggesting it is better to avoid this stock for now. The stock may test its 20-week EMA, which is placed around Rs 4,550-4,500. The view will be negated if the price closes above Rs 5,000.
Indian Oil Corporation | CMP: Rs 179
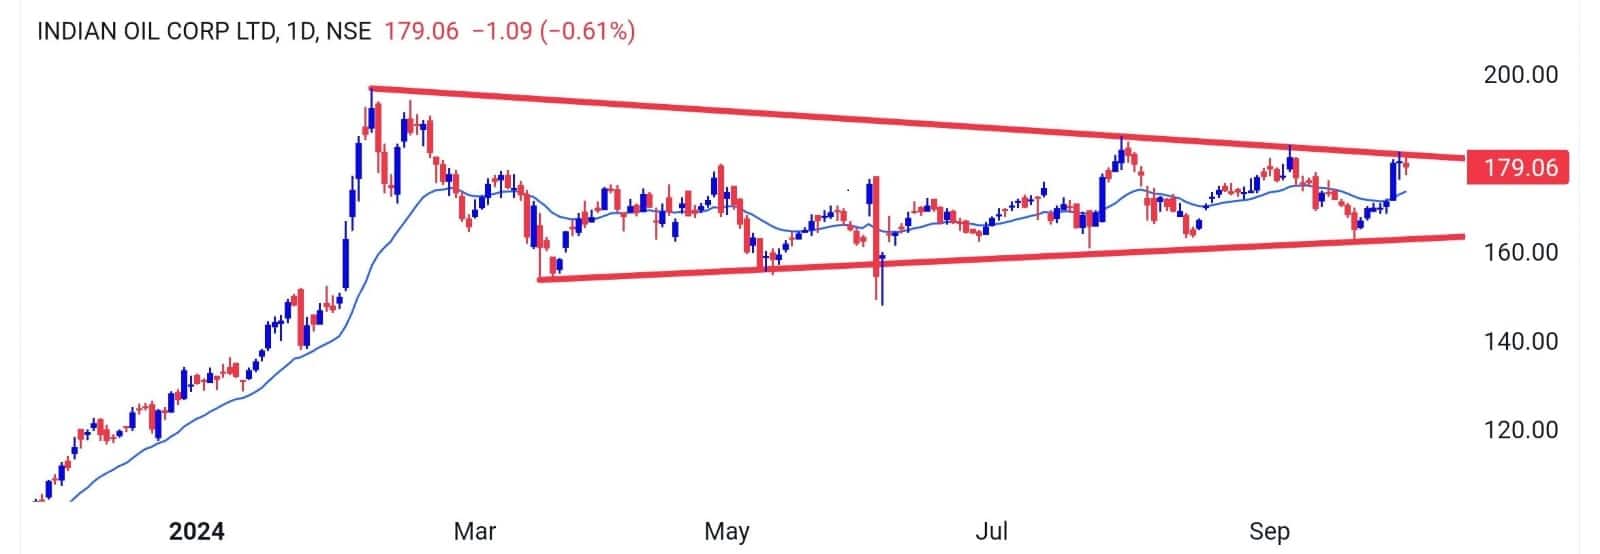
IOC has underperformed compared to its peers, and tensions in the Middle East may add further pressure. The stock has been trading in a symmetrical triangle formation for several weeks and is currently near the upper trendline of the pattern. A rise in crude oil prices may negatively impact the stock, and a failed breakout attempt could occur. It is advisable to avoid the stock until tensions in the Middle East settle down.
Virat Jagad, Technical Research Analyst at Bonanza Portfolio
Zomato | CMP: Rs 274

Zomato has been forming higher highs and higher lows, delivering over 24 percent returns in the past month. However, the possibility of profit booking is high in the near term. The recent formation of a Dark Cloud Cover candlestick pattern, typically a reversal signal, suggests potential profit-taking at current levels. Additionally, the RSI is approaching 80, indicating overbought conditions and raising the likelihood of a price correction or consolidation.
Sun Pharmaceuticals Industries | CMP: Rs 1,920
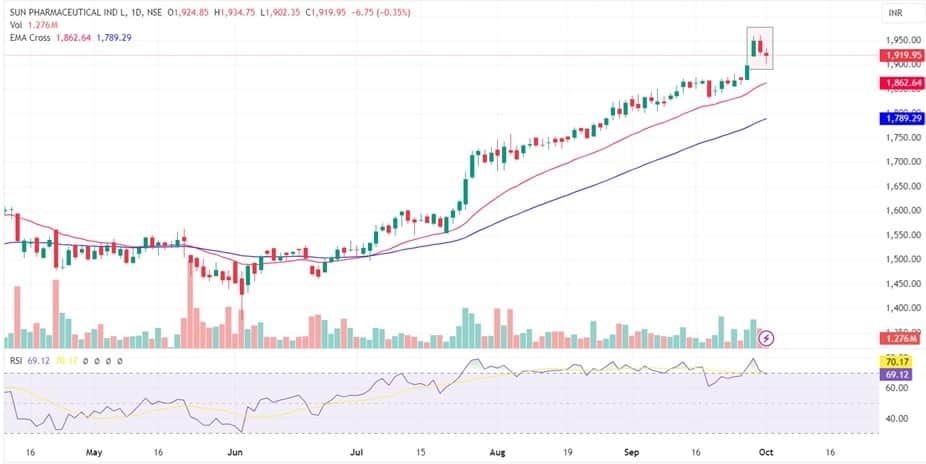
Sun Pharma recently broke out of a small range, displaying strong bullish momentum and indicating that buyers are in control. However, significant selling pressure from higher levels resulted in a long red candle, a sign of momentum exhaustion. The recent candlestick formation resembles an inside down, typically a reversal signal, suggesting profit-taking at current levels. Additionally, the RSI is in overbought territory, hinting at a potential price correction or consolidation.
Disclaimer: The views and investment tips expressed by investment experts on Moneycontrol.com are their own and not those of the website or its management. Moneycontrol.com advises users to check with certified experts before taking any investment decisions.
Discover the latest Business News, Sensex, and Nifty updates. Obtain Personal Finance insights, tax queries, and expert opinions on Moneycontrol or download the Moneycontrol App to stay updated!

Find the best of Al News in one place, specially curated for you every weekend.
Stay on top of the latest tech trends and biggest startup news.


