
The market kept the momentum alive for the fourth straight week ended July 21. Although some selling pressure in technology stocks after Infosys earnings slowed down the rally, the overall sentiment remained upbeat. FMCG stocks and Reliance Industries too weighed on the bull run in the last trading session.
The Nifty50 missed the psychological 20,000 mark target by a few points during the week and ended with nearly 1 percent gains at 19,745, the record close on a weekly basis, and formed a bullish candlestick pattern with long upper shadow on the daily charts, which indicates selling pressure at higher levels.
Friday's correction was on expected lines given the sustained bull run in the market, but it is unlikely to hold the bulls for long as experts feel such intermittent corrections make the market healthier. True to the belief, the volatility index for the Indian market hovers near its historic lows.
Consolidation and rangebound trade may, therefore, continue in the near term, with key support at 19,600-19,500 levels as breaking off this can bring more downward move in the market, whereas 19,800-20,000 may remain criticial resistance area, experts said.
"Due to the recent vertical move and overbought conditions, the next upward movement may not be as swift as the recent run. It is anticipated that there may be a correction, either in terms of time or price, so the ideal strategy would be to buy on dips and book profits at higher levels," Sameet Chavan, head research, technical and derivatives at Angel One, said.
He feels the psychological mark of 20,000 that was just missed last week remains an immediate hurdle, followed by the golden retracement target of 20,100 – 20,200. On the downside, the recent congestion breakout level of 19,600 – 19,500 is considered immediate support, and a more significant correction may occur only if this level is breached, he said.
Traders should closely monitor these levels and consider playing within this range, he advised.
Jatin Gedia, technical research analyst at Sharekhan by BNP Paribas also believes that there can be some consolidation considering the sharp rise it has witnessed in the last few trading sessions. Overall, the uptrend is still intact, and he believes that this dip is a pullback and not a trend reversal.
Let's check out the top 10 trading ideas from experts for the next three-four weeks. Returns are based on July 21 closing prices.
Expert: Vinay Rajani, CMT, senior technical & derivative analyst at HDFC Securities
Bank of India: Buy | LTP: Rs 84.45 | Stop-Loss: Rs 76.70 | Target: Rs 92 | Return: 9 percent
Downward sloping trendline breakout has seen on the daily chart. The stock price has surpassed previous top resistance of Rs 81.95. Higher tops and higher bottoms formation was seen on the daily chart.
Price rise is accompanied by jump in volumes, which confirms the bullish trend. The stock is placed above all important moving averages, indicating bullish trend on all time frames.

Bank of Maharashtra: Buy | LTP: Rs 34.25 | Stop-Loss: Rs 31 | Target: Rs 39.50 | Return: 15 percent
The stock price has broken out from Inverted Head and Shoulder pattern on the weekly charts. Stock price has surpassed previous top resistance of Rs 32.80. Higher tops and higher bottoms formation was seen on the Weekly chart.
Price rise is accompanied by jump in volumes, which confirms the bullish trend. The stock is placed above all important moving average, indicating bullish trend on all time frames.

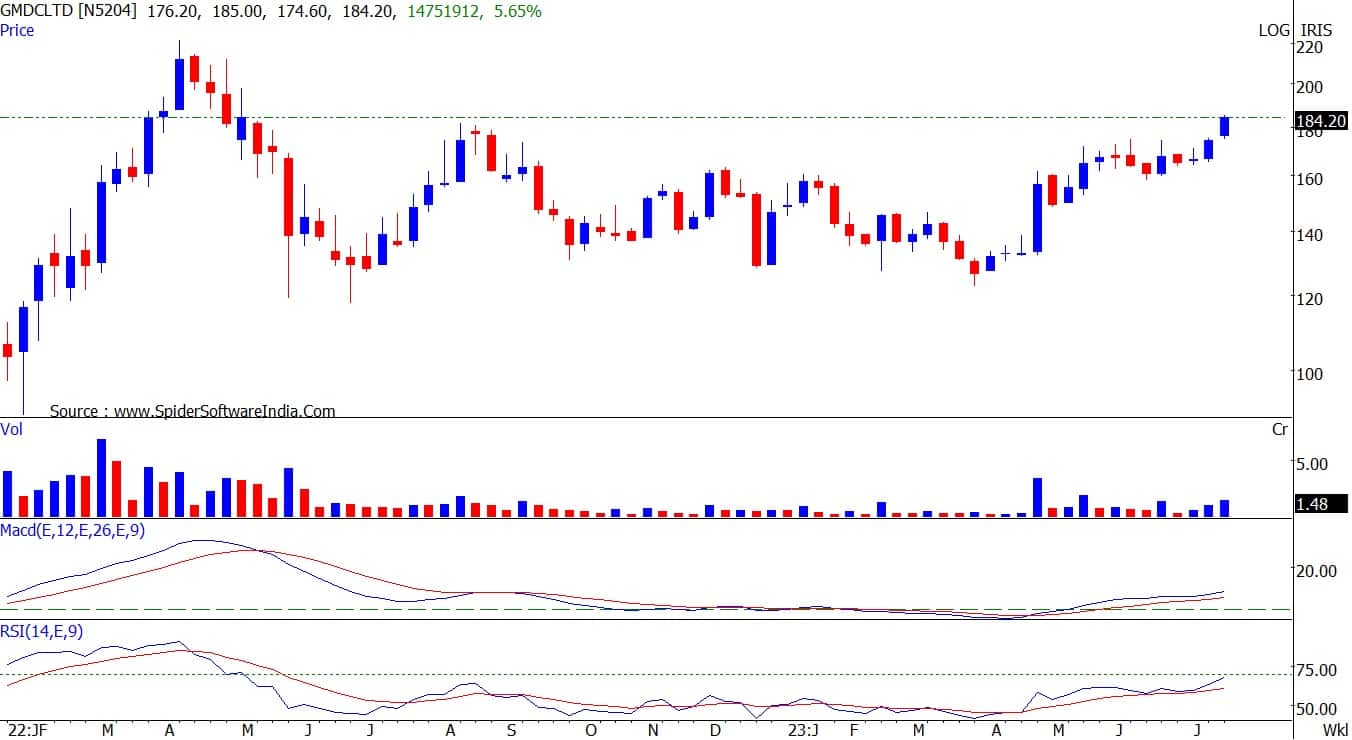
GMDC: Buy | LTP: Rs 184 | Stop-Loss: Rs 164 | Target: Rs 205 | Return: 11 percent
Gujarat Mineral Development Corporation (GMDC) has broken out from last 9-week’s price consolidation with rising volumes. The stock is placed above all important moving averages, which indicates bullish trend on all time frames.
Indicators and oscillators have turned bullish on weekly charts. PSU sector has been outperforming and same is expected to continue.
Expert: Shrikant Chouhan, head of equity research (retail) at Kotak Securities
Rategain Travel Technologies: Buy | LTP: Rs 440.65 | Stop-Loss: Rs 400 | Targets: Rs 452-525 | Return: 19 percent
The stock is moving higher along with a multiple continuation formation. In the past, it was within the trading range of Rs 425 and Rs 370. The volume-based activity ended in early July when it crossed the upper limit at Rs 425. It moved up to Rs 452, however, later it started consolidating again between Rs 425 and Rs 452.
Based on the weekly formation, we believe the stock is ready to move higher towards its all-time high which is Rs 525. The strategy should be to buy 50 percent at current levels and buy the rest at Rs 425. Place stop-loss at Rs 400. Higher side the stock can move to Rs 452, Rs 470, and Rs 525.

Radico Khaitan: Buy | LTP: Rs 1,400.30 | Stop-Loss: Rs 1,200 | Targets: Rs 1,550-1,750 | Return: 24 percent
The stock broke out of Symmetrical triangle consolidation at Rs 1,200, which gave a huge drag on sentiment and lifted the stock above its all-time high, which stood at Rs 1,294.
Technically, we believe the stock is in a trending up move, which will pull the stock towards Rs 1,550 and Rs 1,750 levels in the next few weeks or months. If it corrects till Rs 1,350 then it can be bought with a view to add more. Keep a stop-loss at Rs 1,200.

Canara Bank: Buy | LTP: Rs 338 | Stop-Loss: Rs 320 | Targets: Rs 370-390 | Return: 15 percent
Since January 2023, the stock is consolidating between Rs 342 and Rs 268. Riding on the rally in PSU banks, the stock has managed to cross Rs 342 level, which is bullish for it.
Technically, Rs 342-345 zone is an area of Fibonacci resistance. Above Rs 345, it may move towards Rs 370-390 in the coming few weeks. A buy is recommended between Rs 345 and Rs 330. Place a stop-loss at Rs 320.

Expert: Jigar S Patel, Senior Manager - Equity Research at Anand Rathi
Asahi India Glass: Buy | LTP: Rs 559.55 | Stop-Loss: Rs 520 | Target: Rs 620 | Return: 11 percent
After making a solid base near Rs 460-500 levels, which is also a potential reversal zone of the Bullish BAT pattern. Having said that, it is trading above all critical daily exponential moving averages.
Additionally, the said counter has made a Bullish Divergence near above-mentioned potential reversal zone, which is making it lucrative at current levels. Thus, one can buy between Rs 555-560 with an upside target of Rs 620 and the stop-loss would be around Rs 520 on a closing basis.

Tata Teleservices: Buy | LTP: Rs 82.60 | Stop-Loss: Rs 73 | Target: Rs 97 | Return: 17 percent
For the last 2 months, the said counter has been making base near its crucial support of Rs 70-72 which was also its monthly central pivot range (refer to the chart).
From the Indicator perspective, the daily MACD (moving average convergence divergence) has given bullish crossover above zero-line which hints further upside in the counter.
One can buy in a small tranche in the range of Rs 82-83 and another in the range of Rs 76-77 ( if tested) with an upside target of Rs 97 and a stop-loss would be Rs 73 on a closing basis.

Sterling and Wilson Renewable Energy: Buy | LTP: Rs 365 | Stop-Loss: Rs 315 | Target: Rs 430 | Return: 18 percent
For the last 3 months, the said counter has been making base near its crucial support of Rs 290-300, which was also its monthly central pivot range.
From the Indicator perspective, the weekly RSI (relative strength index) has rebounded from 45 levels, echoing further bullish bias in the counter.
One can buy in a small tranche in the range of Rs 360-365 and another in the range of Rs 340-350 (if tested) with an upside target of Rs 430 and a stop-loss would be Rs 315 on a closing basis.

Expert: Ruchit Jain, lead research at 5paisa.com
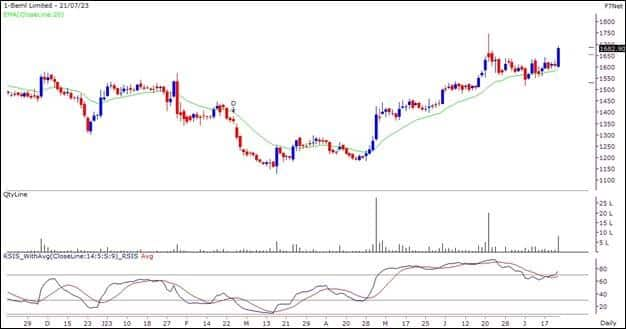
BEML: Buy | LTP: Rs 1,682.9 | Stop-Loss: Rs 1,590 | Targets: Rs 1,770-1,840 | Return: 9 percent
The recent price volume indicates bullish bias, the upmove has been supported by good volumes, while on corrections they are low. The RSI oscillator recently cooled-off from the overbought zone and has now given a positive crossover indicating a resumption of the momentum.
Hence, traders can look to buy the stock in the range of Rs 1,680-1,670 for potential targets around Rs 1,770 and Rs 1,840. The stop-loss for long positions should be placed below Rs 1,590.
ONGC: Buy | LTP: Rs 170.55 | Stop-Loss: Rs 166 | Targets: Rs 175-178 | Return: 4 percent
The stock has been forming a ‘Higher Top Higher Bottom’ structure and is thus in an uptrend. Prices had recently resisted around Rs 170, but have given a breakout above the same in Friday’s session.
The RSI oscillator in hinting at a positive momentum and hence, we expect an upmove in the stock in the near term.
Traders can look to buy the stock around current market price of Rs 170 for potential near term targets of Rs 175 and Rs 178. The stop-loss on long positions should be placed below Rs 166.

Disclaimer: The views and investment tips expressed by investment experts on Moneycontrol.com are their own and not those of the website or its management. Moneycontrol.com advises users to check with certified experts before taking any investment decisions.
Discover the latest Business News, Sensex, and Nifty updates. Obtain Personal Finance insights, tax queries, and expert opinions on Moneycontrol or download the Moneycontrol App to stay updated!


