


The market recouped more than half of its previous week's losses and climbed 250 points or 1.4 percent on the Nifty50 during the week ended February 3. The recovery is largely attributed to the short covering-led buying in beaten-down banking and financial services and select Adani Group stocks along with fall in oil prices.
The Nifty50 finally settled above the 17,800 mark, the lower band of previous trading range (17,800-18,250) seen before the recent correction, after taking strong support at 200 DMA (around 17,300).
In the near term, the index is expected to take support at 17,600, which has been holding quite well on every closing in the past six consecutive sessions, with resistance at the 18,000-18,250 zone but, considering the recent news-led activity, further volatility can't be ruled out, experts said.
"Although we managed to recover the lost ground this week, we are not completely out of the woods yet. A continuous news flow with respect to the Adani group is likely to give volatile swings on both sides," Sameet Chavan, Chief Analyst-Technical and Derivatives at Angel One, said.
As far as the levels are concerned, he feels, the immediate support is visible around 17,600; but the major sacrosanct zone remains at 17,400 – 17,300, which coincides with the 200-day SMA. "Ideally, till the time we defend this, there is no real reason to worry for," Chavan said.
On the flipside, if the market has to regain its pride, the Nifty needs to surpass 18,000 – 18,100 on a closing basis, which will confirm the completion of the recent corrective phase and market can then resume the higher degree uptrend, the expert said.
He advised that the banking space needs to be watched closely because it is likely to act as a catalyst for setting the near-term direction for the market. Apart from this, a lot of thematic moves started playing out well towards the end of the week. One must keep focusing on such potential trading opportunities, he said.
Let's take a look at the top 10 trading ideas by experts for the next three-four weeks. Returns are based on the February 3 closing prices:
Expert: Shrikant Chouhan, Head of Equity Research (Retail) at Kotak Securities
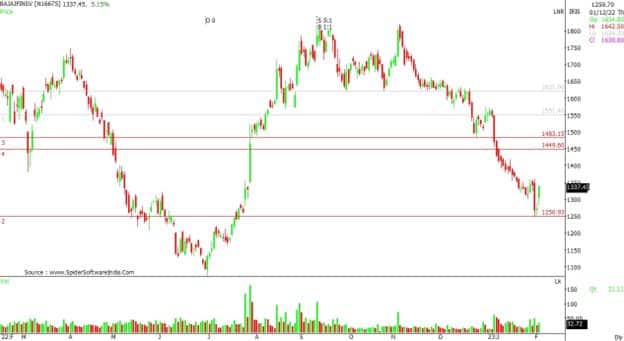
Bajaj Finserv: Buy | LTP: Rs 1,337 | Stop-Loss: Rs 1,240 | Target: Rs 1,500 | Return: 12 percent
The stock spent a lot of time between the Rs 1,800 and Rs 1,600 levels during September and November 2022. However, since the stock has broken the trading range at Rs 1,600, we saw a significant fall in the stock towards Rs 1,246 level without any meaningful pullback. The pullback has sent the stock into the highly oversold zone.
Technically, such a pattern could result in a move back to retrace the sell-off. Based on it, the positional traders should be buyers at the current levels with a final stop-loss at Rs 1,240. On the upside, it will find resistance at Rs 1,450 or Rs 1,500.
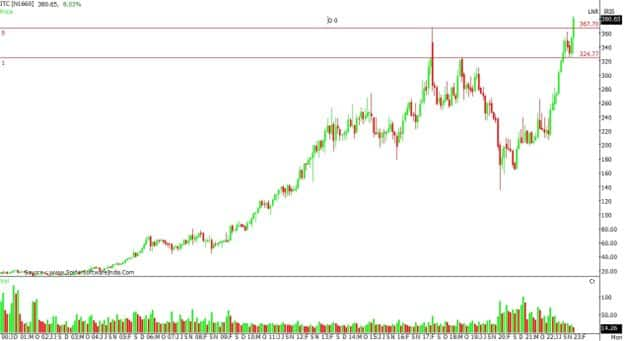
ITC: Buy | LTP: Rs 381 | Stop-Loss: Rs 350 | Target: Rs 440 | Return: 15 percent
We saw unusual movement in stock after the announcement of the budget. On the same day, it kept fluctuating between Rs 366 and Rs 329 levels, however, it managed to close at the highest point of the day. The stock broke the broad trading range at Rs 366 and closed above it on a weekly closing basis, which is positive for the long-term trend of the stock.
Technically, it has the potential to move to the next extension levels, which are Rs 400 and Rs 440. On the flip side, Rs 370 and Rs 360 should be support areas for the stock to accumulate. From a medium-term perspective, buy ITC with a stop-loss at Rs 350.
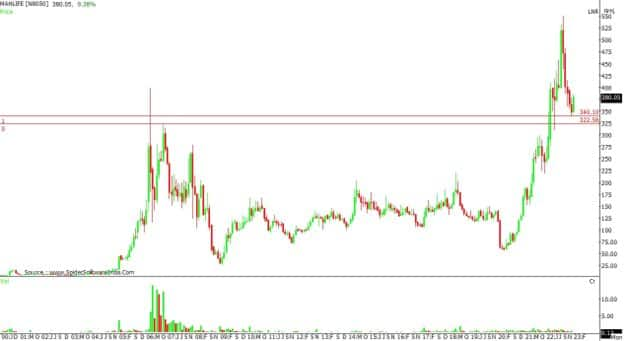
Mahindra Lifespace Developers: Buy | LTP: Rs 380 | Stop-Loss: Rs 340 | Target: Rs 460 | Return: 21 percent
From September 2022, the stock was in a vertical fall from highs of Rs 550, it fell to Rs 350 levels. However, after hitting Rs 350 levels, the stock saw a lot of volume-based activity between Rs 340 and Rs 380 levels.
Technically, the stock has fallen towards the key support area and based on the price and volume expansion, our strategy should be to buy from a medium to long-term perspective. Keep the final stop-loss at Rs 340 for all trading positions. On the upside, we can see Rs 420 or Rs 460 levels.
Expert: Vinay Rajani, Senior Technical & Derivative Analyst at HDFC Securities
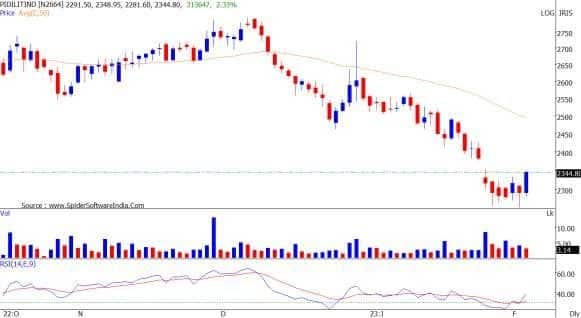
Pidilite Industries: Buy | LTP: Rs 2,342 | Stop-Loss: Rs 2,250 | Targets: Rs 2,435-2,490 | Return: 6 percent
The stock price has broken out from the consolidation which held for last 6 trading sessions. RSI (relative strength index) has exited the oversold zone on the daily chart, indicating probable bullish trend reversal.
FMCG index has been outperforming and largecap stock like Pidilite is expected to register catch up move in the coming days.
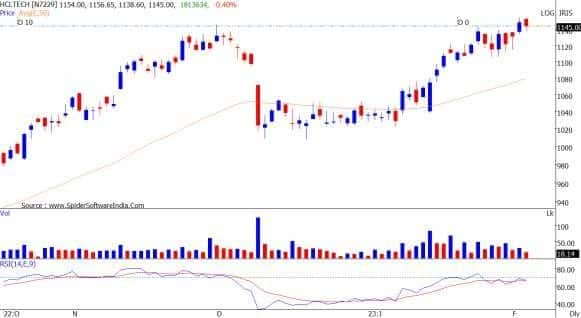
HCL Technologies: Buy | LTP: Rs 1,146 | Stop-Loss: Rs 1,090 | Targets: Rs 1,200-1,250 | Return: 9 percent
The stock price has formed bullish rounding bottom formation on the daily chart with volume rising along with the price rise. IT sector has been outperforming in the current market scenario and same is expected to continue.
The stock is placed above all important moving averages. Indicators and oscillators have also been showing strength in the current uptrend.
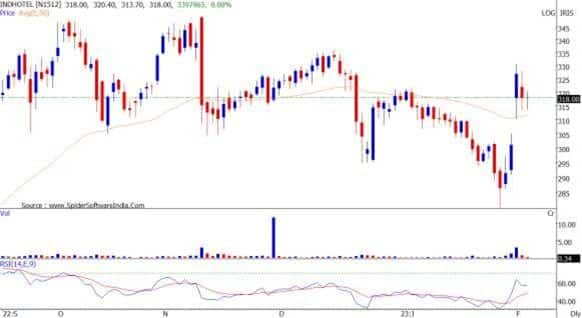
Indian Hotels: Buy | LTP: Rs 318 | Stop-Loss: Rs 300 | Targets: Rs 340-355 | Return: 12 percent
The stock price has surpassed crucial resistance of its 50-day EMA (exponential moving average), placed at Rs 318. RSI oscillator has exited the oversold zone on the daily chart.
Primary trend of the stock has been bullish as it has been holding above its 200-day EMA. Stock price has also broken out from the downward sloping trend line adjoining recent swing highs on the daily chart.
Expert: Ruchit Jain, Lead Research at 5paisa.com
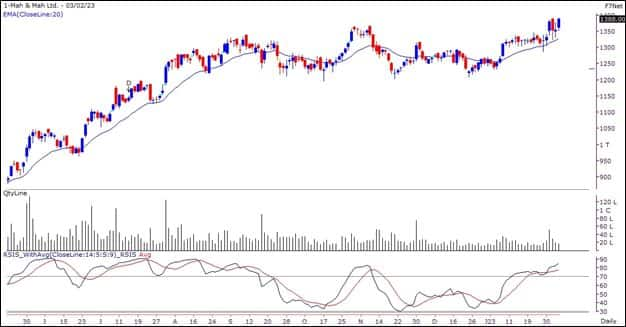
Mahindra and Mahindra: Buy | LTP: Rs 1,388 | Stop-Loss: Rs 1,320 | Target: Rs 1,500 | Return: 8 percent
The stock has been an outperformer within the Auto sector and inspite of the market volatility during last week, the stock has managed to hold above its crucial support levels. The stock is continuing its ‘Higher Top Higher Bottom’ structure while the volumes are also good along with the price upmove.
The RSI oscillator in hinting at a continuation of the momentum and hence, we expect the stock to continue its uptrend.
Hence, short term traders can look for buying opportunities around current market price of Rs 1,388 for near term targets of Rs 1,456 and Rs 1,500. The stop-loss for long positions should be placed below Rs 1,320.
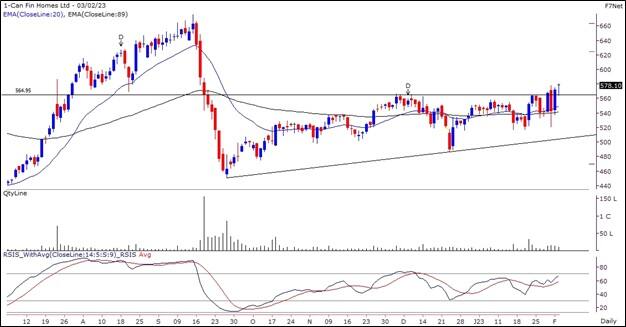
Can Fin Homes: Buy | LTP: Rs 578 | Stop-Loss: Rs 560 | Target: Rs 610 | Return: 6 percent
Recently, the stock has witnessed higher volatility as prices corrected sharply in September 2022 due to news flows. However, prices have now recovered some of those losses and have given a breakout above swing high resistance.
The RSI oscillator is hinting at a positive momentum and hence, we expect an upmove in the stock in the short term.
Hence, traders can look to buy the stock in the range of Rs 578-575 for potential targets around Rs 596 and Rs 610. The stop-loss for long positions should be placed below Rs 560.
Expert: Rohan Shah, Head Technical Analyst at Stoxbox
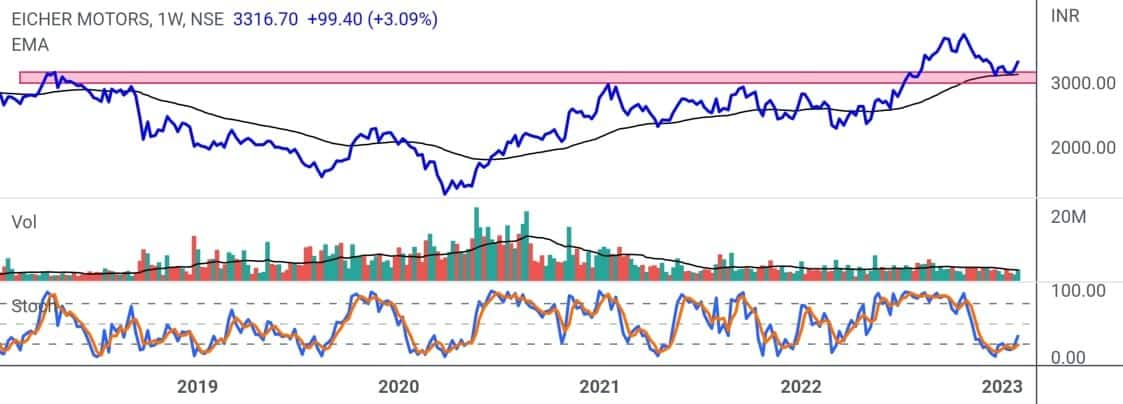
Eicher Motors: Buy | LTP: Rs 3,317 | Stop-Loss: Rs 3,200 | Target: Rs 3,550 | Return: 7 percent
In the early August 2022, the stock surpassed the supply zone of Rs 3,150-3,050 with the strong volumes, highlighting bullish signal for medium term trend. Post breakout, the stock rallied higher to new life highs and after that price witnessed profit booking dropping price to earlier resistance zones.
Recently, the stock reversed taking support around its previous support zone denotes polarity into play and indicates a robust price action.
Previous week, the stock staged a breakout from the basing pattern, which formed at the 50-weekly (EMA). The momentum indicator Stochastic, has reversed from the oversold territory with a bullish moving average crossover, compliments a bullish bias on price.
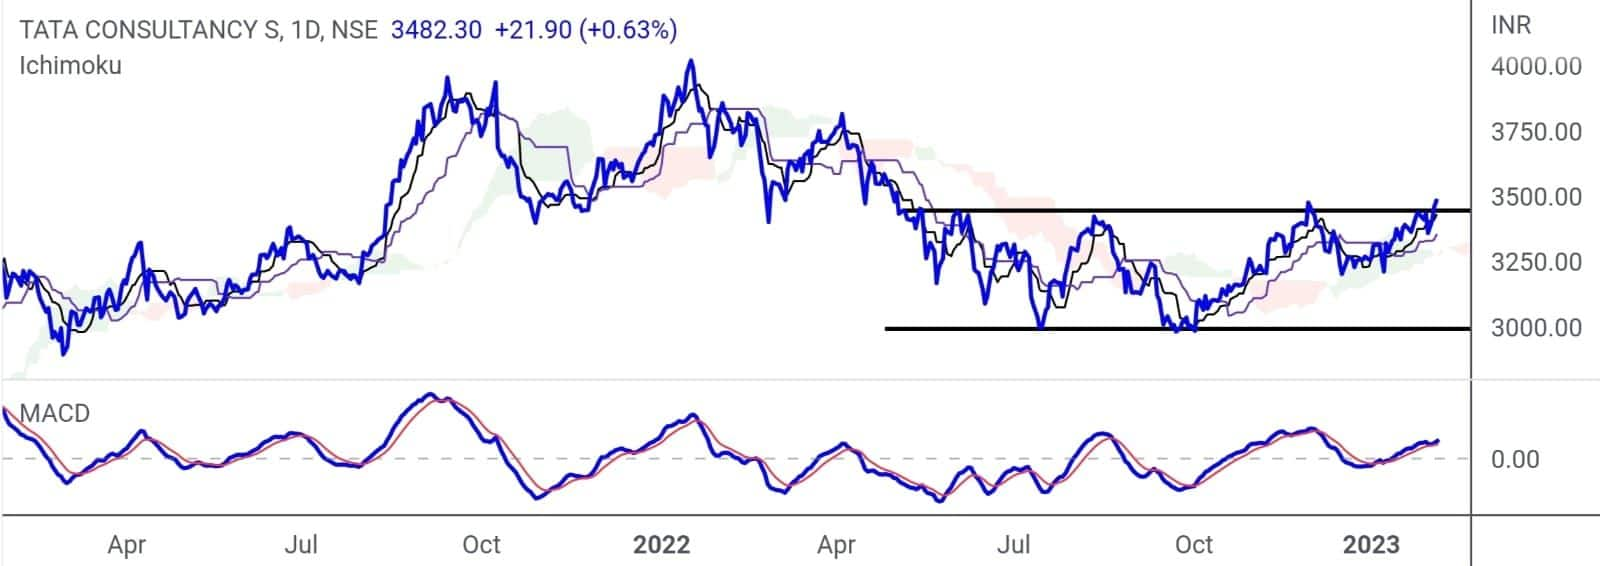
Tata Consultancy Services: Buy | LTP: Rs 3,482 | Stop-Loss: Rs 3,357 | Target: Rs 3,730 | Return: 7 percent
The stock has generated a breakout from a potential bullish Double Bottom price pattern which is a bullish signal. The stock price is trading above ichimoku clouds, the base and conversion line heading north suggests strength and momentum in price.
Even, Dollar (USD) denoting strength against Ruppee INR and NASDAQ hitting to 5-month highs, complements the bullish bias on the IT pack. MACD (moving average convergence divergence) inching higher after converging around its 9 EMA average exhibits strength in price.
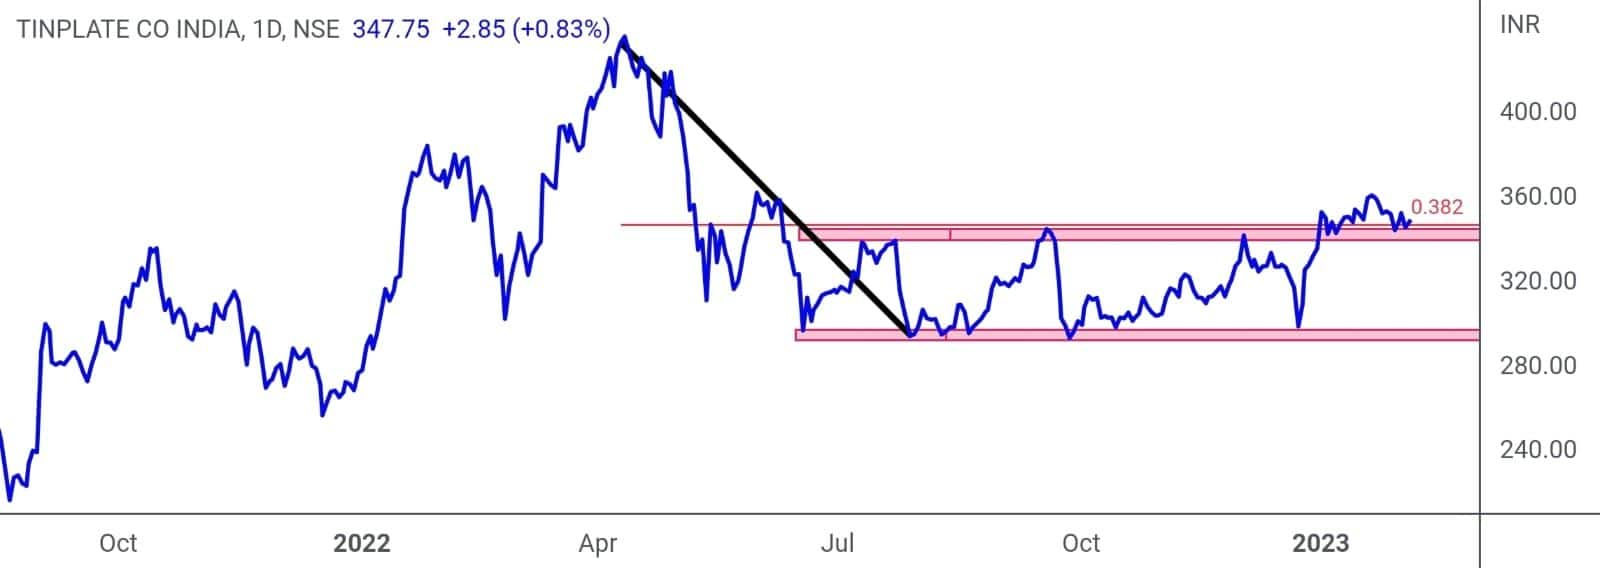
Tinplate Company of India: Buy | LTP: Rs 348 | Stop-Loss: Rs 333 | Target: Rs 375 | Return: 8 percent
Recently, the stock has concluded a breakout from multi-weekly consolidation with supportive volumes indicating a bullish price structure. Also, the stock has surpassed 38.2 percent retracement line of its prior fall after finding resistance near the same for multiple instances.
Currently, the stock stands at the polarity support and price action indicates stock is expected to witness upward momentum in the coming sessions. The stock is trading above the key exponential moving averages, highlights inherent strength in price.
Disclaimer: The views and investment tips expressed by investment experts on Moneycontrol.com are their own and not those of the website or its management. Moneycontrol.com advises users to check with certified experts before taking any investment decisions.
Discover the latest Business News, Sensex, and Nifty updates. Obtain Personal Finance insights, tax queries, and expert opinions on Moneycontrol or download the Moneycontrol App to stay updated!

Find the best of Al News in one place, specially curated for you every weekend.
Stay on top of the latest tech trends and biggest startup news.


