


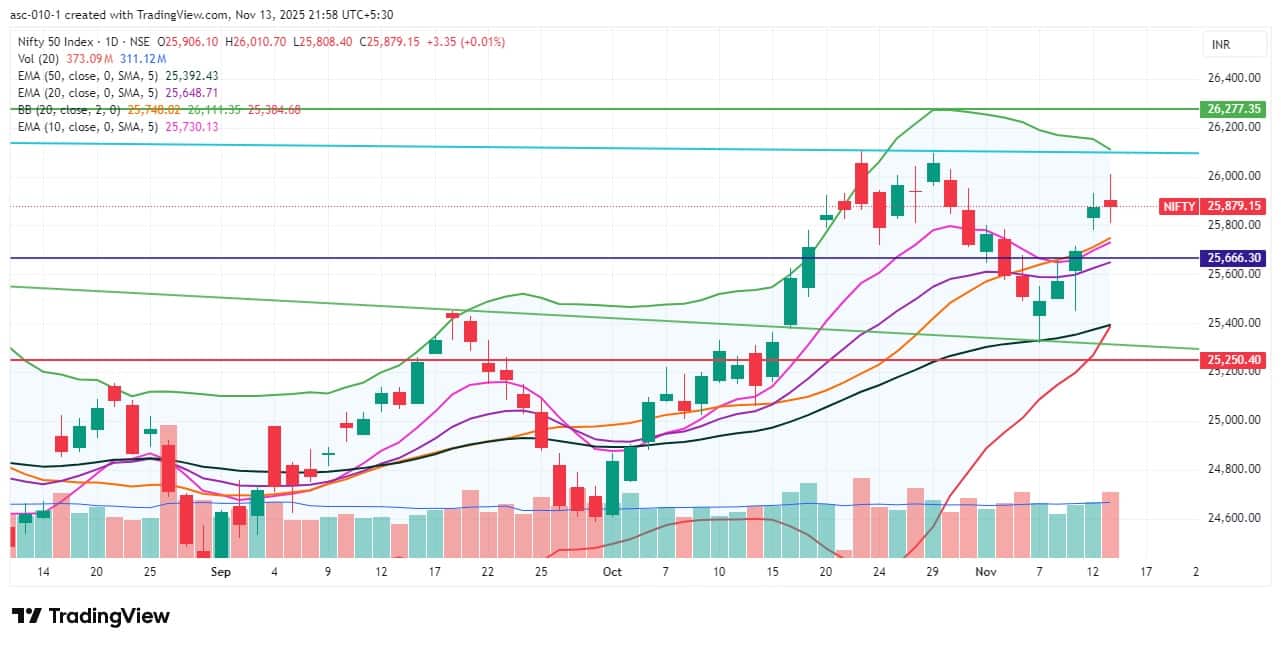
The Nifty 50 continued its uptrend and higher-high structure for the fourth consecutive session, though it lost more than 130 points from the day’s high (a tad above 26,000) to close flat with a positive bias on November 13. Further, the index stayed above all key moving averages, with improving momentum indicators. Hence, the trend remains favourable for the bulls. For a further uptrend toward the 26,100–26,200 zone, the index needs to climb and sustain above 26,000. Until then, consolidation and range-bound trading may be seen, with support at 25,800–25,700, according to experts.
Here are 15 data points we have collated to help you spot profitable trades:
1) Key Levels For The Nifty 50 (25,879)
Resistance based on pivot points: 25,977, 26,024, and 26,102
Support based on pivot points: 25,822, 25,774, and 25,697
Special Formation: The Nifty 50 formed a small bearish candle with upper and lower shadows, resembling a high-wave or Doji-like candlestick pattern on the daily timeframe, signalling volatility and indecision among bulls and bears. The short-term moving averages trended upward, with the RSI climbing to 61.36 and showing a positive crossover. The Stochastic RSI maintained its bullish crossover, while the weakness in the histogram faded further, though the MACD remained below the reference line. All these factors indicate a continuation of a healthy trend ahead.
2) Key Levels For The Bank Nifty (58,382)
Resistance based on pivot points: 58,562, 58,677, and 58,864
Support based on pivot points: 58,188, 58,073, and 57,886
Resistance based on Fibonacci retracement: 58,735, 60,142
Support based on Fibonacci retracement: 57,423, 56,685
Special Formation: The Bank Nifty sustained above the falling trendline (which earlier acted as a resistance and now serves as a support) despite witnessing pressure at higher levels. The index hit an intraday record high of 58,616 and formed a bullish candle with an upper shadow on the daily charts. It also remained above all key moving averages, with the RSI at 65.61 crossing the reference line on the higher side, while the Stochastic RSI maintained its bullish crossover. The MACD stayed in a bearish crossover above the zero line, but the weakness in its histogram faded further. All these indicators suggest underlying strength in the banking index.

According to the weekly options data, the 26,000 strike holds the maximum Call open interest (with 92.4 lakh contracts). This level can act as a key resistance for the Nifty in the short term. It was followed by the 26,500 strike (89.43 lakh contracts) and 26,200 strike (62.9 lakh contracts).
Maximum Call writing was observed at the 26,500 strike, which saw an addition of 27.18 lakh contracts, followed by the 26,000 and 26,200 strikes, which added 24.09 lakh and 22.02 lakh contracts, respectively. The maximum Call unwinding was seen at the 25,800 strike, which shed 7.65 lakh contracts, followed by the 25,700 and 25,600 strikes, which shed 5.69 lakh and 3.77 lakh contracts, respectively.
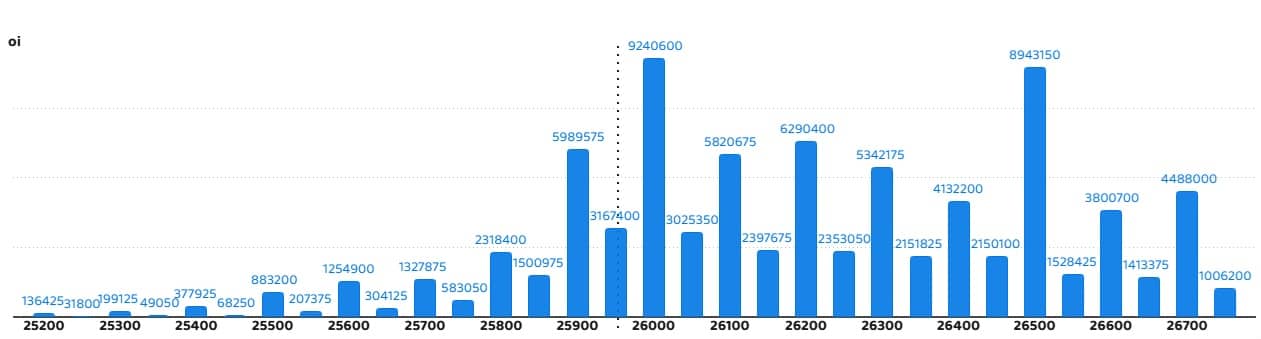
On the Put side, the maximum Put open interest was seen at the 25,500 strike (with 77.82 lakh contracts), which can act as a key support level for the Nifty. It was followed by the 25,800 strike (68.8 lakh contracts) and the 25,900 strike (58.88 lakh contracts).
The maximum Put writing was placed at the 25,500 strike, which saw an addition of 17.49 lakh contracts, followed by the 25,300 and 26,000 strikes, which added 11.14 lakh and 8.82 lakh contracts, respectively. The maximum Put unwinding was seen at the 25,350 strike which shed 10.54 lakh contracts, followed by the 25,550 and 25,600 strikes, which shed 9.76 lakh and 8.14 lakh contracts, respectively.

5) Bank Nifty Call Options Data
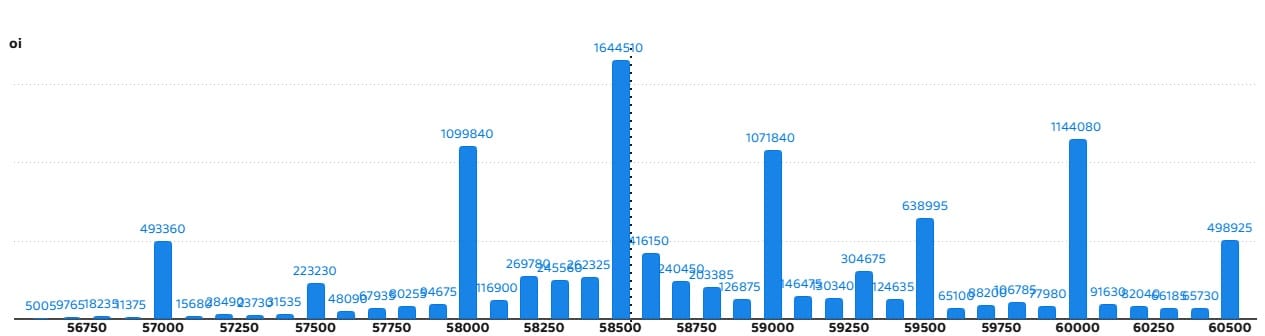
According to the monthly options data, the maximum Call open interest was seen at the 58,500 strike, with 16.44 lakh contracts. This can act as a key resistance level for the index in the short term. It was followed by the 60,000 strike (11.44 lakh contracts) and the 58,000 strike (10.99 lakh contracts).
Maximum Call writing was observed at the 58,500 strike (with the addition of 1.28 lakh contracts), followed by the 59,000 strike (57,365 contracts) and 58,700 strike (42,035 contracts). The maximum Call unwinding was seen at the 58,000 strike, which shed 2.37 lakh contracts, followed by the 58,300 and 58,900 strikes, which shed 57,540 and 42,700 contracts, respectively.
6) Bank Nifty Put Options Data
On the Put side, the 58,500 strike holds the maximum Put open interest (with 15.98 lakh contracts), which can act as a key level for the index. This was followed by the 58,000 strike (14.62 lakh contracts) and the 57,000 strike (11.79 lakh contracts).
The maximum Put writing was placed at the 58,500 strike (which added 44,345 contracts), followed by the 58,700 strike (39,340 contracts) and the 58,400 strike (38,955 contracts). The maximum Put unwinding was seen at the 57,600 strike which shed 50,330 contracts, followed by the 57,000 and 58,800 strikes, which shed 39,025 and 22,435 contracts, respectively.


The Nifty Put-Call ratio (PCR), which indicates the mood of the market, fell to 1.1 on November 13, compared to 1.23 in the previous session.
The increasing PCR, or being higher than 0.7 or surpassing 1, means traders are selling more Put options than Call options, which generally indicates the firming up of a bullish sentiment in the market. If the ratio falls below 0.7 or moves towards 0.5, then it indicates selling in Calls is higher than selling in Puts, reflecting a bearish mood in the market.

9) India VIX
The India VIX, which measures expected market volatility, dropped below the 10-day EMA and remained well below the 13 zone, though it climbed 0.43 percent on Thursday to 12.16. This continues to provide comfort for the bulls.

A long build-up was seen in 25 stocks. An increase in open interest (OI) and price indicates a build-up of long positions.

11) Long Unwinding (68 Stocks)
68 stocks saw a decline in open interest (OI) along with a fall in price, indicating long unwinding.

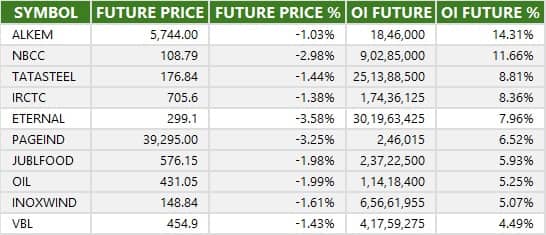
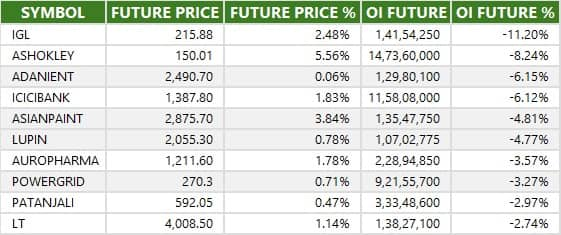
12) Short Build-up (74 Stocks)
74 stocks saw an increase in OI along with a fall in price, indicating a build-up of short positions.
13) Short-Covering (45 Stocks)
45 stocks saw short-covering, meaning a decrease in OI, along with a price increase.
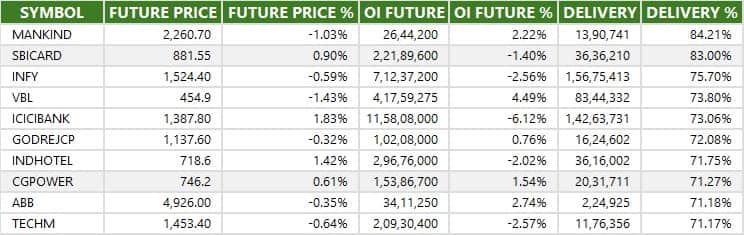
Here are the stocks that saw a high share of delivery trades. A high share of delivery reflects investing (as opposed to trading) interest in a stock.
Securities banned under the F&O segment include companies where derivative contracts cross 95 percent of the market-wide position limit.
Stocks added to F&O ban: Nil
Stocks retained in F&O ban: SAIL
Stocks removed from F&O ban: Nil
Disclaimer: The views and investment tips expressed by experts on Moneycontrol are their own and not those of the website or its management. Moneycontrol advises users to check with certified experts before taking any investment decisions.Disclaimer: Moneycontrol is a part of the Network18 group. Network18 is controlled by Independent Media Trust, of which Reliance Industries is the sole beneficiary.Discover the latest Business News, Sensex, and Nifty updates. Obtain Personal Finance insights, tax queries, and expert opinions on Moneycontrol or download the Moneycontrol App to stay updated!


Find the best of Al News in one place, specially curated for you every weekend.
Stay on top of the latest tech trends and biggest startup news.


