


The benchmark indices closed off their day's low amid rangebound trading on March 4, while the market breadth turned favourable for bulls. About 1,573 shares advanced compared to 1,066 declining shares on the NSE. The market may remain consolidative, with the continuation of the "sell on rally" strategy. Below are some trading ideas for the near term:
Amol Athawale, VP-Technical Research at Kotak Securities
Steel Authority of India | CMP: Rs 107.66

After its declining trend, Steel Authority of India (SAIL) is now in the accumulation zone, where it is trading in a rangebound mode on the daily scale. However, recent bullish activity near the lower boundary of the range is indicating good strength. The stock is expected to rebound and witness a fresh upward move from the current levels, presenting a favourable risk and reward perspective.
Strategy: Buy
Target: Rs 115
Stop-Loss: Rs 103
Voltas | CMP: Rs 1,409.55
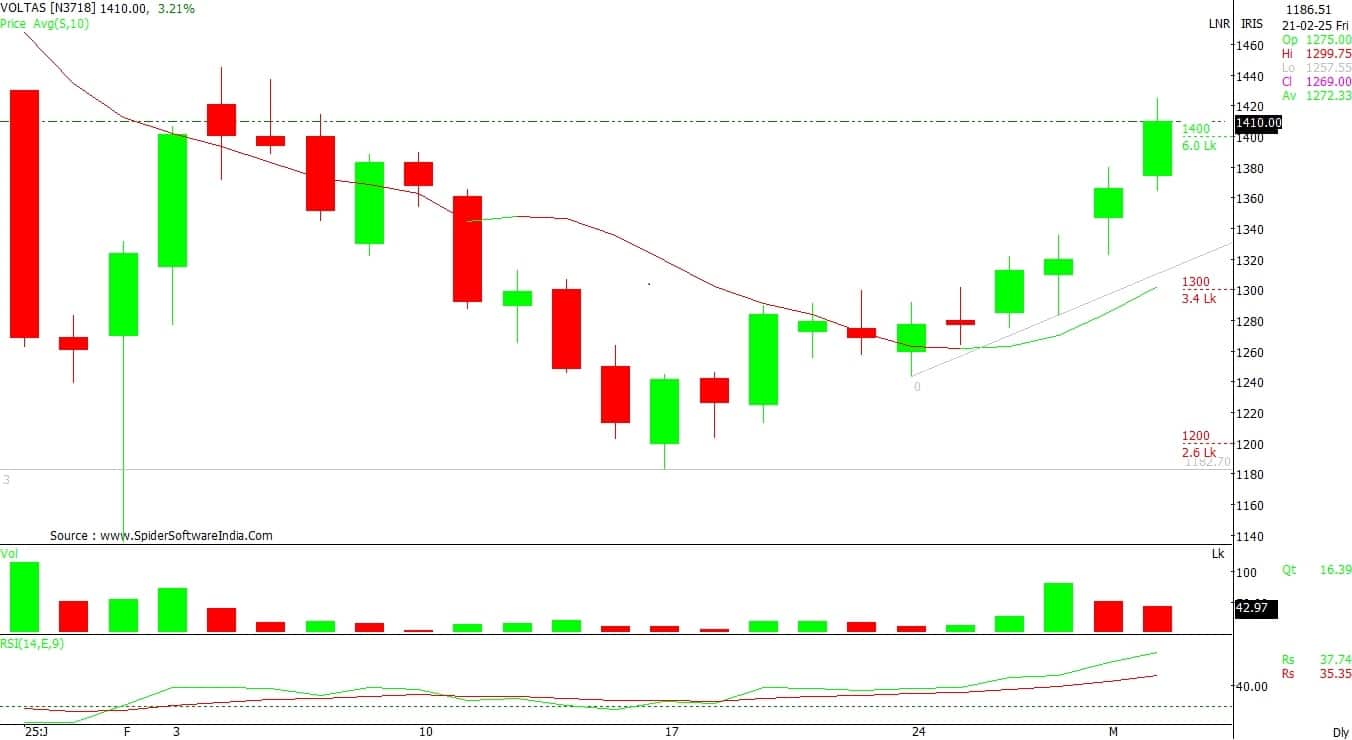
On both the daily and weekly scales, Voltas is in a rising channel chart formation, exhibiting a higher high and higher low series pattern. The counter witnessed a steady recovery from the lower levels. Additionally, the technical indicator RSI (Relative Strength Index) is indicating a further uptrend from the current levels, which could boost bullish momentum in the near future.
Strategy: Buy
Target: Rs ,1510
Stop-Loss: Rs 1,360
Cummins India | CMP: Rs 2861.1
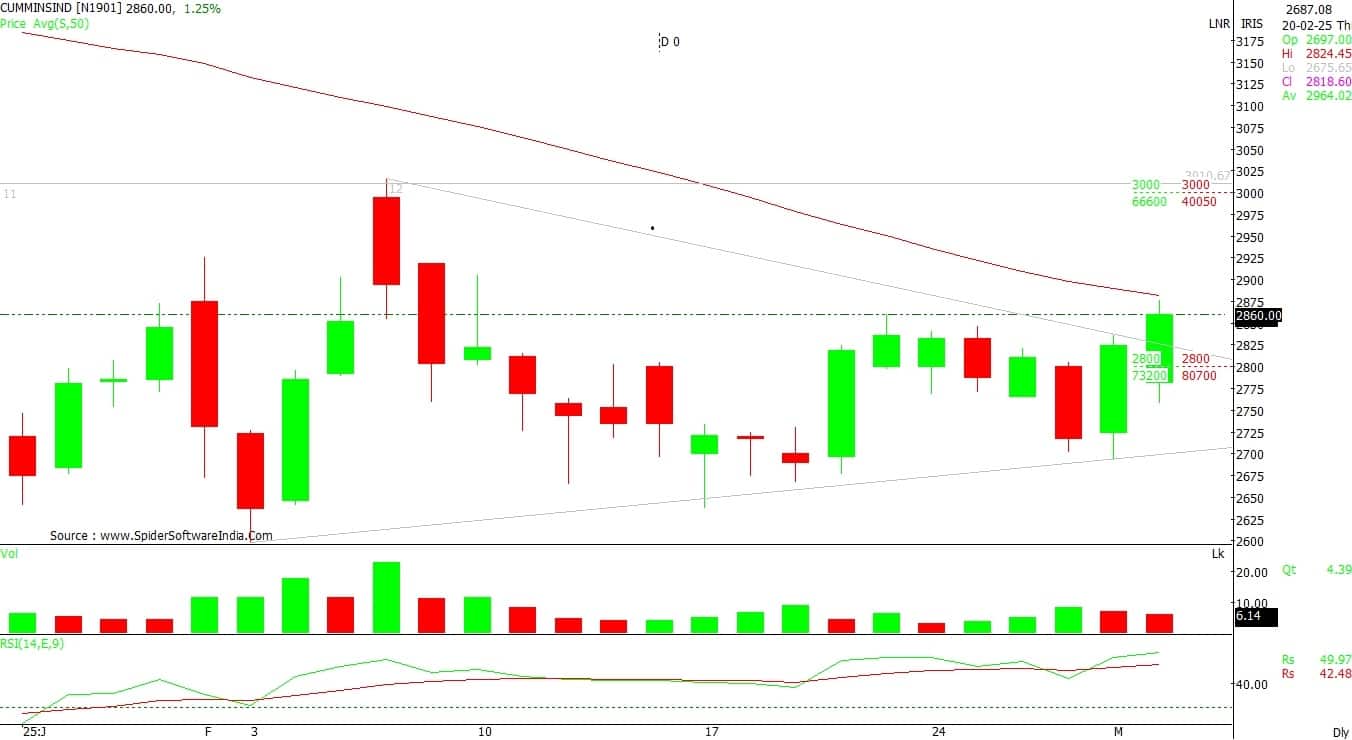
Cummins has given a breakout from its symmetrical triangle chart pattern with a strong bullish candlestick. Additionally, on the daily charts, it has formed a higher bottom, indicating further bullish movement from current levels. Unless the stock trades below Rs 2,760, positional traders can retain an optimistic stance and look for a target of Rs 3,050.
Strategy: Buy
Target: Rs 3,050
Stop-Loss: Rs 2,760
Vinay Rajani, Senior Technical & Derivative Analyst at HDFC Securities
Force Motors | CMP: Rs 7,154

Force Motors is trading above its 20, 50, 100, and 200 DMA, indicating an uptrend on all time frames. The stock has surpassed the crucial resistance band of Rs 7,000-7,050. Indicators and oscillators have turned bullish on both the daily and weekly charts.
Strategy: Buy
Target: Rs 7,650
Stop-Loss: Rs 6,850
Bharat Dynamics | CMP: Rs 1,049
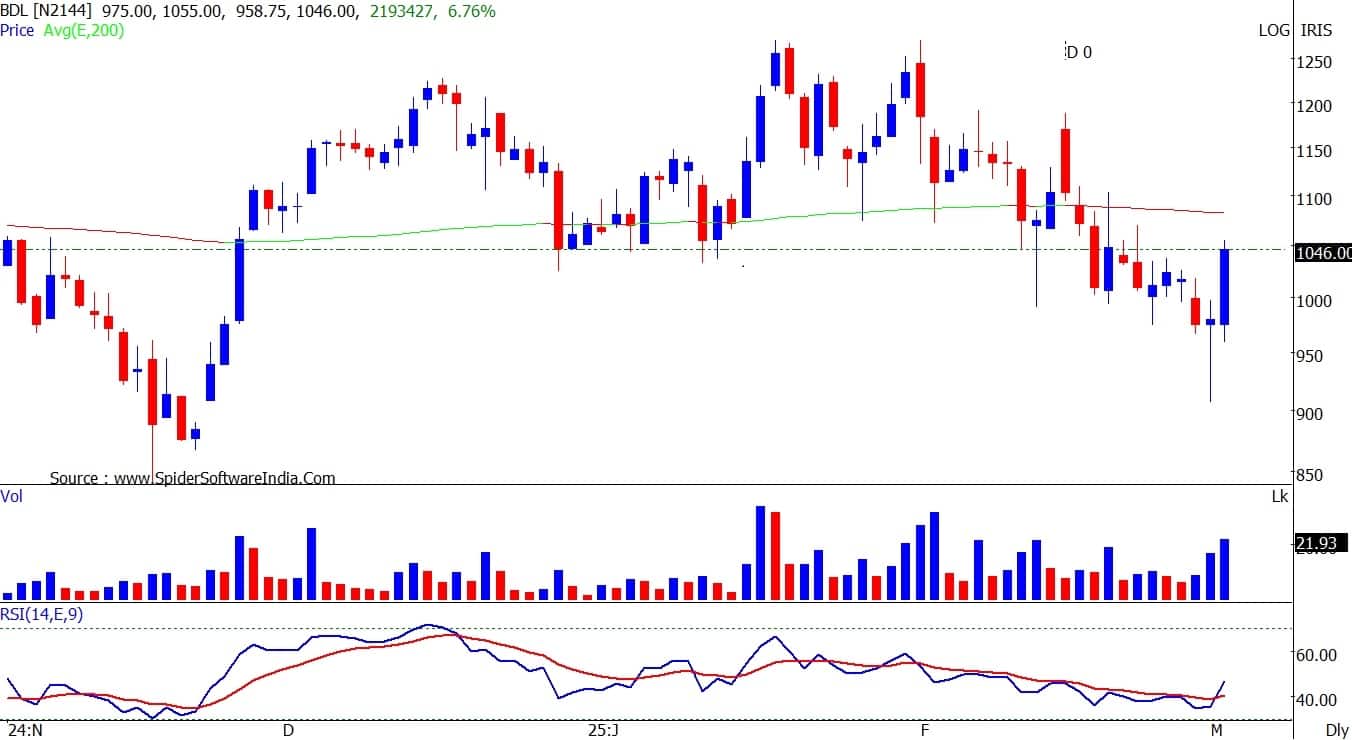
Bharat Dynamics has recently found support on its 100-week EMA and an upward-sloping trendline on the weekly charts. On March 3, 2025, the stock formed a bullish “Hammer” candlestick pattern on the daily chart, signaling a short-term bullish trend reversal.
Strategy: Buy
Target: Rs 1,125
Stop-Loss: Rs 1,000
Ashish Kyal, CMT, Founder and CEO of Waves Strategy Advisors
Schaeffler India | CMP: Rs 3,212.7
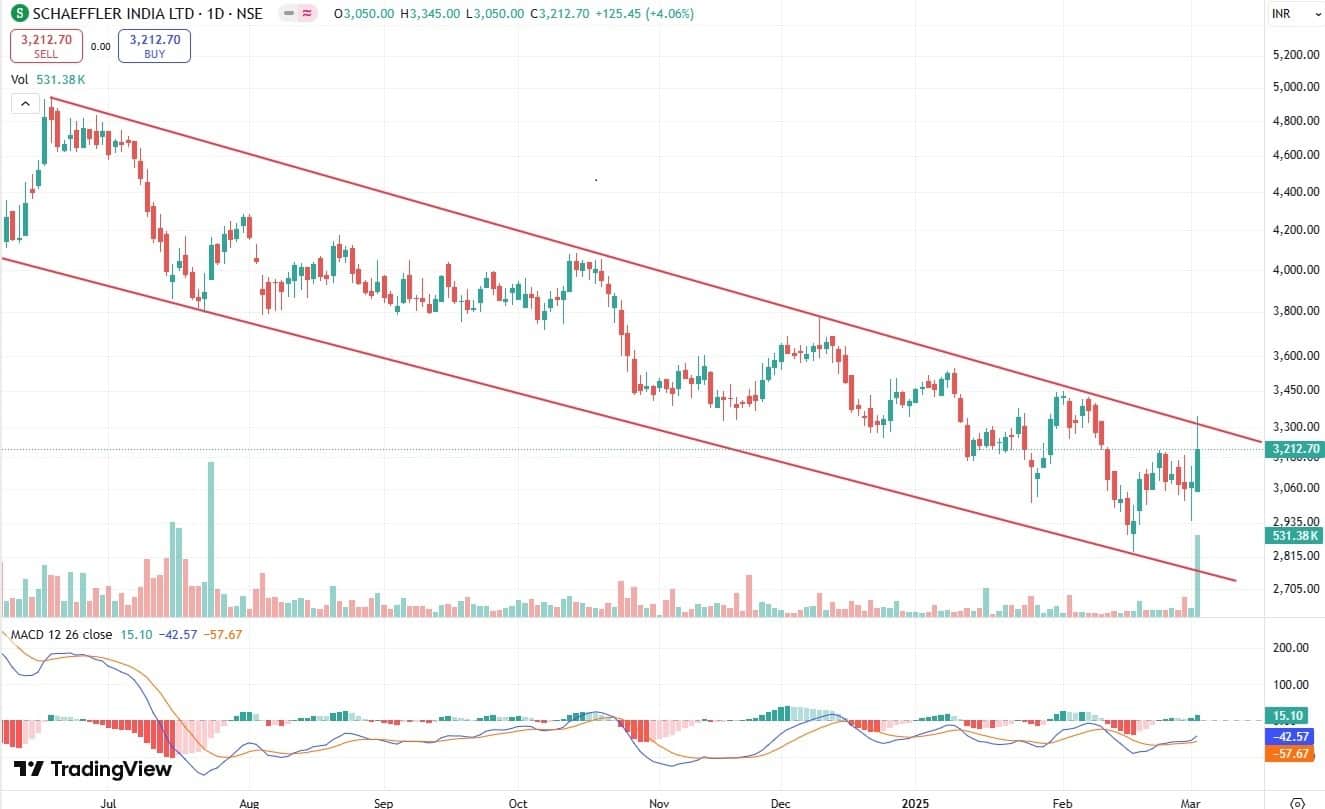
In the previous session, Schaeffler India witnessed a gain of more than 4% with a significant increase in volume, a strong bullish sign. Prices have finally managed to close above the consolidated range of Rs 3,010 to Rs 3,200 levels, indicating increasing bullish sentiment in the stock. On the daily chart, prices had been trading within a downward-sloping channel since June 2024. A breakout above it can result in a fresh rally in the stock.
Furthermore, we have applied the MACD (Moving Average Convergence Divergence) to understand the overall trend sentiment. The MACD recently witnessed a bullish crossover, which is also a positive sign.
In summary, the current trend for Schaeffler India looks positive. A break above Rs 3,255 levels is crucial for fresh buying to emerge in the stock, which can target Rs 3,390 followed by Rs 3,520. On the downside, Rs 3,120 levels are the nearest support to watch out for.
Strategy: Buy
Target: Rs 3,390, Rs 3,520
Stop-Loss: Rs 3,120
Blue Star | CMP: Rs 2,100.65

In the previous session, Blue Star closed on a positive note with a gain of 3.35%. On the daily chart, prices have protected their prior day’s low on a closing basis since February 27 and have gained more than 18% since then, despite major indices falling. This is a positive sign. Additionally, prices managed to close above the upper Bollinger Bands with a rise in volume, showcasing strength in the ongoing trend. For now, a break above Rs 2,120 is needed for bullish momentum to continue in the stock. Despite the steep rise, RSI is still trading at 62, leaving room for further upward movement.
In summary, the current trend for Blue Star is positive. A break above Rs 2,120 can lift the prices towards Rs 2,210 followed by Rs 2,300. On the downside, Rs 2,020 is the nearest support.
Strategy: Buy
Target: Rs 2,210, Rs 2,300
Stop-Loss: Rs 2,020
Fortis Healthcare | CMP: Rs 639.1

Fortis Healthcare has been moving in a rectangular range over the last few days, indicating accumulation in the stock. The price has closed above Rs 633, confirming a breakout from the said pattern.
On the daily chart, the 5 EMA (Exponential Moving Average) has crossed above the 13 EMA, signaling a bullish crossover and indicating that the short-term bias has turned positive. For now, a break above Rs 645 is necessary for fresh buying to emerge. If this happens, we can expect a move towards the previous swing high near Rs 670.
In summary, the current trend for Fortis Healthcare is bullish. A break above Rs 645 can lift the price higher towards Rs 670 followed by Rs 700, as long as Rs 618 holds as support on the downside.
Strategy: Buy
Target: Rs 670, Rs 700
Stop-Loss: Rs 618
Disclaimer: The views and investment tips expressed by investment experts on Moneycontrol.com are their own and not those of the website or its management. Moneycontrol.com advises users to check with certified experts before taking any investment decisions.Discover the latest Business News, Sensex, and Nifty updates. Obtain Personal Finance insights, tax queries, and expert opinions on Moneycontrol or download the Moneycontrol App to stay updated!
Find the best of Al News in one place, specially curated for you every weekend.
Stay on top of the latest tech trends and biggest startup news.


