


Equity benchmarks saw profit booking after a six-day winning streak, with the Nifty falling 0.4 percent on November 18 amid weakness in market breadth. A total of 2,009 shares declined against 838 advancing shares on the NSE. The market may see range-bound trading until it trades below the October high. Below are some short-term trading ideas to consider:
Amol Athawale, VP Technical Research at Kotak SecuritiesHDFC Bank | CMP: Rs 992.45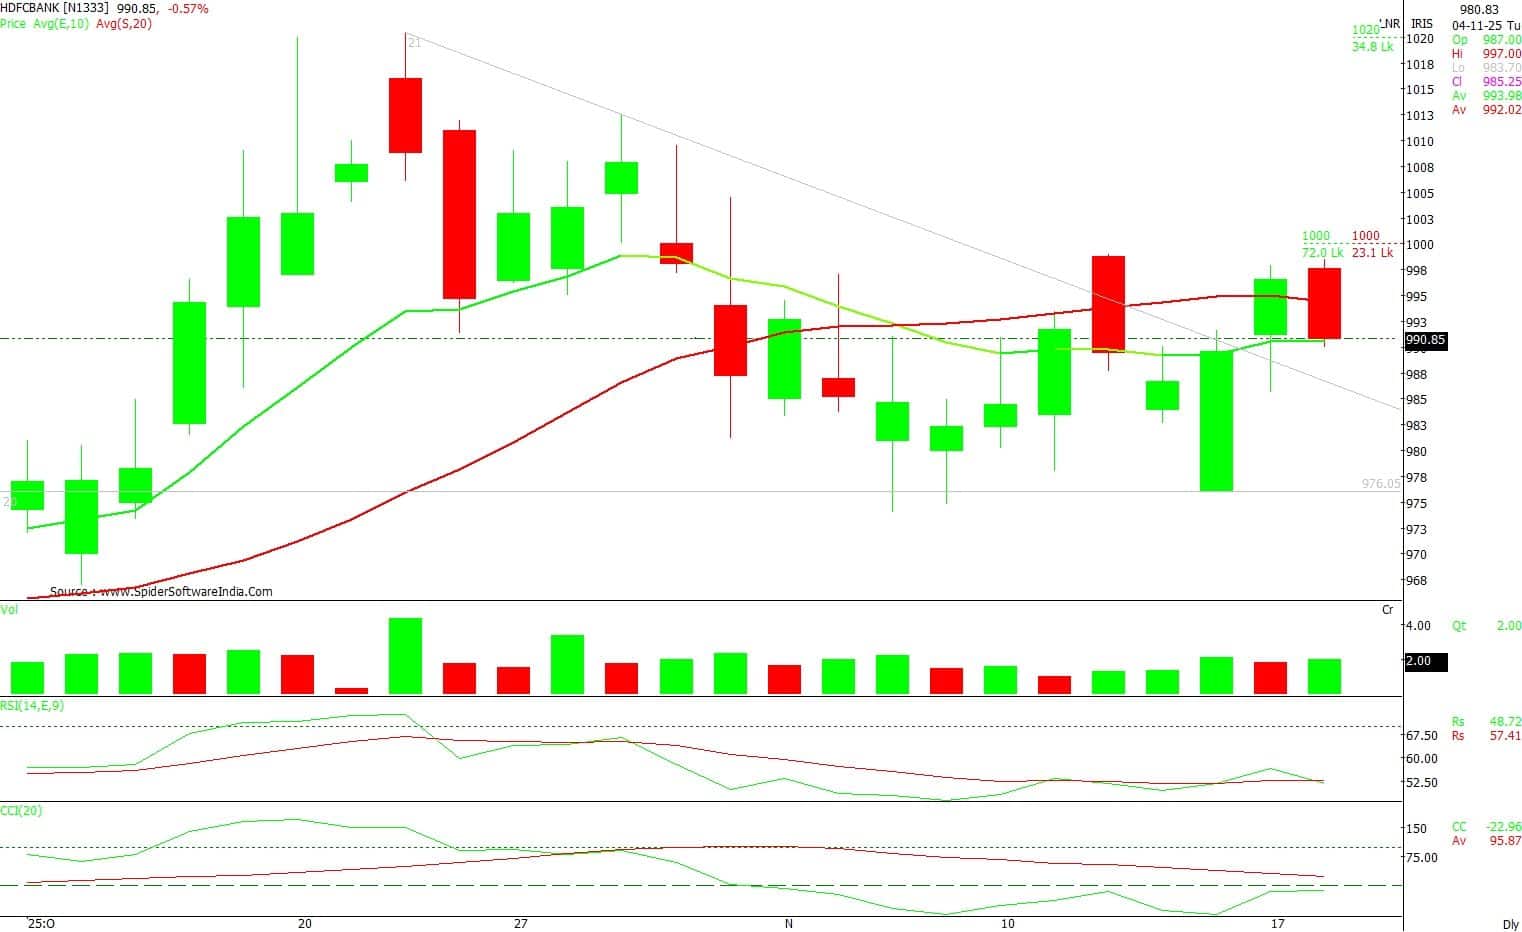
Post its short-term price correction, HDFC Bank is available near its multiple support zone. The incremental volume activity near the support zone indicates that the downside is restricted. Therefore, the stock is expected to rebound and witness bullish momentum from the current levels.
For positional traders, Rs 965 would be the decisive level. Trading above the same, the uptrend formation will continue till Rs 1,040. However, if it closes below Rs 965, traders may prefer to exit long trading positions.
Strategy: Buy
Target: Rs 1,040
Stop-Loss: Rs 965
Pidilite Industries | CMP: Rs 1,491
After its declining trend, Pidilite Industries reversed from its important support zone. The stock has formed a rounding bottom chart pattern on the daily scale, and it is in a steady up move. The technical indicator RSI is also indicating a further uptrend from current levels, which could boost the bullish momentum in the coming horizon.
As long as the stock is trading above Rs 1,465, the bullish texture is likely to continue. Above this, the stock could move up to Rs 1,550.
Strategy: Buy
Target: Rs 1,550
Stop-Loss: Rs 1,465
PVR Inox | CMP: Rs 1,113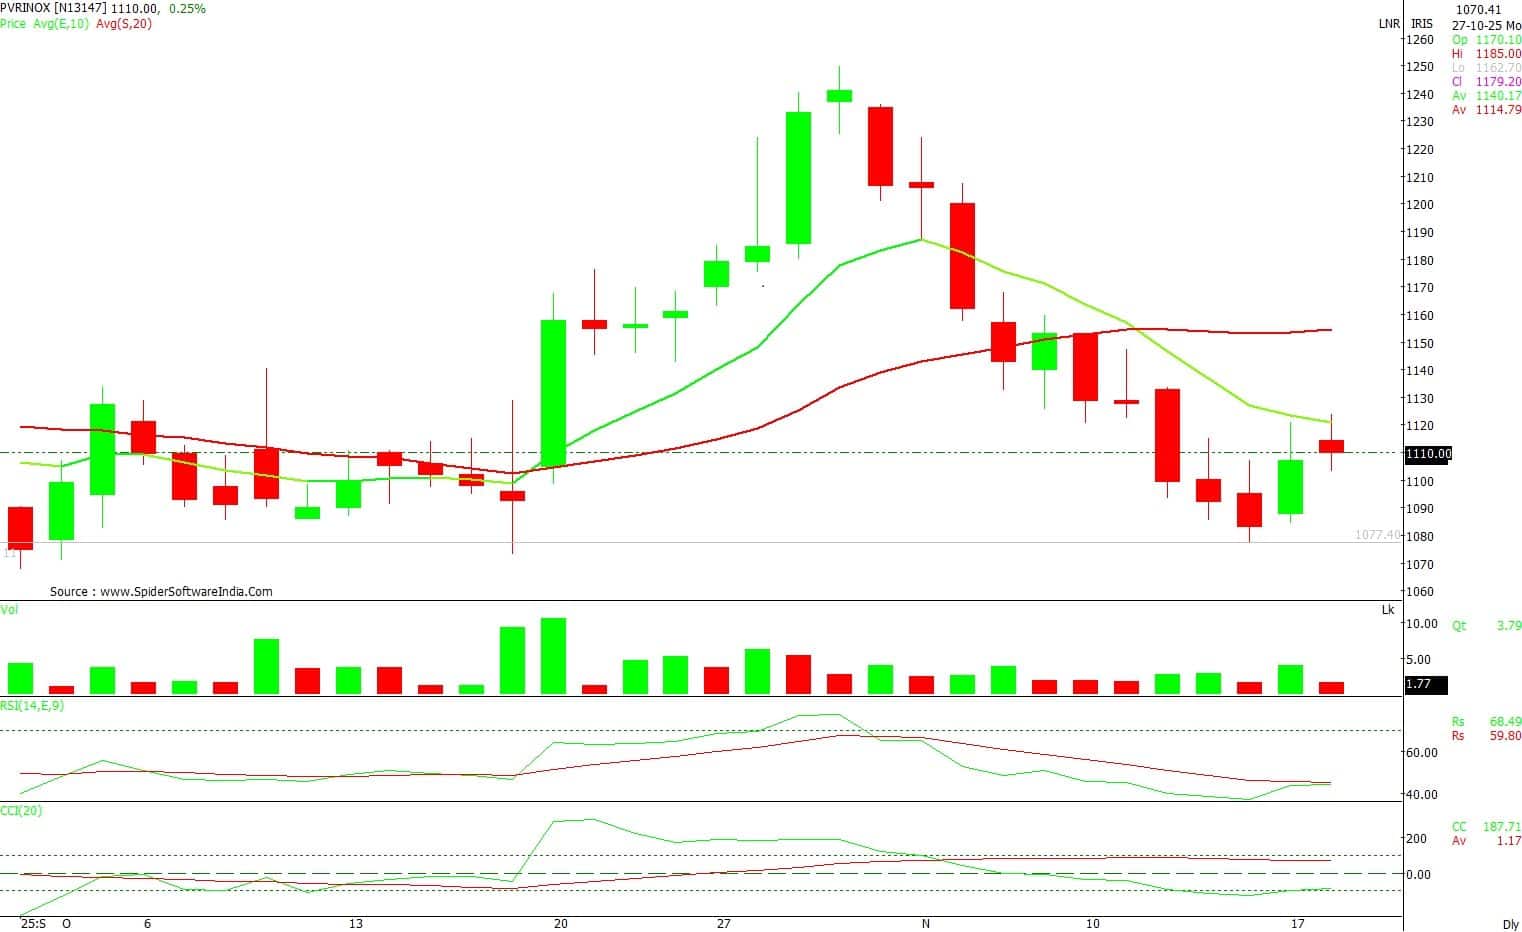
Post the decline from higher levels, PVR Inox has formed a double-bottom chart pattern. The bullish activity near the support zone indicates that the stock has limited downside, making it a good candidate with regard to the risk–reward scenario.
Therefore, the texture of the chart suggests a fresh upward rally. For the next few trading sessions, Rs 1,070 could be the trend-decider level for the bulls. If it sustains above the same, we can expect a further uptrend towards Rs 1,190.
Strategy: Buy
Target: Rs 1,190
Stop-Loss: Rs 1,070
Nandish Shah, Deputy Vice President at HDFC SecuritiesMahindra and Mahindra Financial Services | CMP: Rs 322.9
Mahindra Finance has broken out on the daily chart to close at a 52-week high with higher volumes. The stock price has been forming a bullish higher-top higher-bottom formation on the daily chart. Momentum indicators and oscillators are showing strength in the current uptrend of the stock.
Strategy: Buy
Target: Rs 335, Rs 342
Stop-Loss: Rs 311
Stylam Industries | CMP: Rs 2,024.5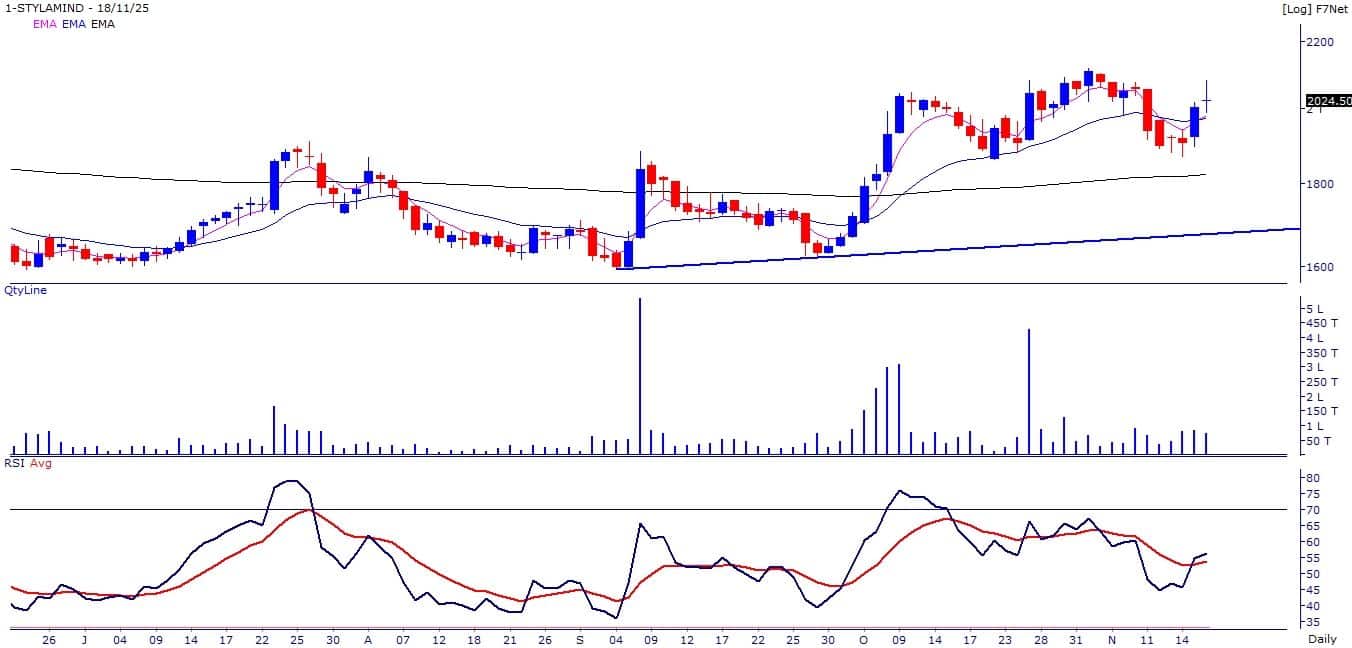
Accumulation is seen in Stylam Industries during the last few months, where up-day volumes are sharply higher than down-day volumes. The primary trend of the stock has turned positive as it is placed above its 200-day EMA. The stock price has broken out on the monthly chart, which was held for the previous ten months.
Strategy: Buy
Target: Rs 2,190, Rs 2,280
Stop-Loss: Rs 1,880
South Indian Bank | CMP: Rs 39.24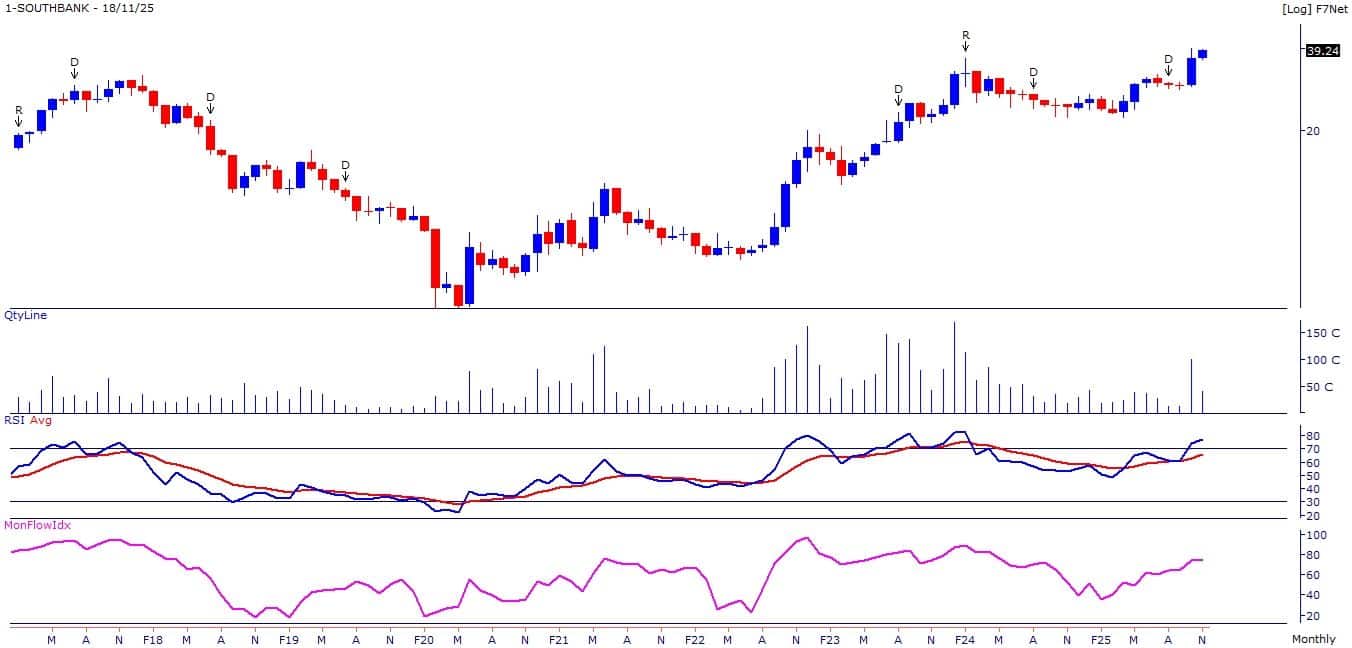
South Indian Bank has broken out on the weekly and monthly charts with higher volumes. The stock price has been forming a bullish higher-top higher-bottom formation on the weekly and monthly charts. Momentum indicators and oscillators are in rising mode and placed above 60 on the daily chart, indicating strength in the uptrend.
Strategy: Buy
Target: Rs 42.5, Rs 46
Stop-Loss: Rs 36
Ashish Kyal, CMT, Founder and CEO of Waves Strategy AdvisorsBSE | CMP: Rs 2,834.1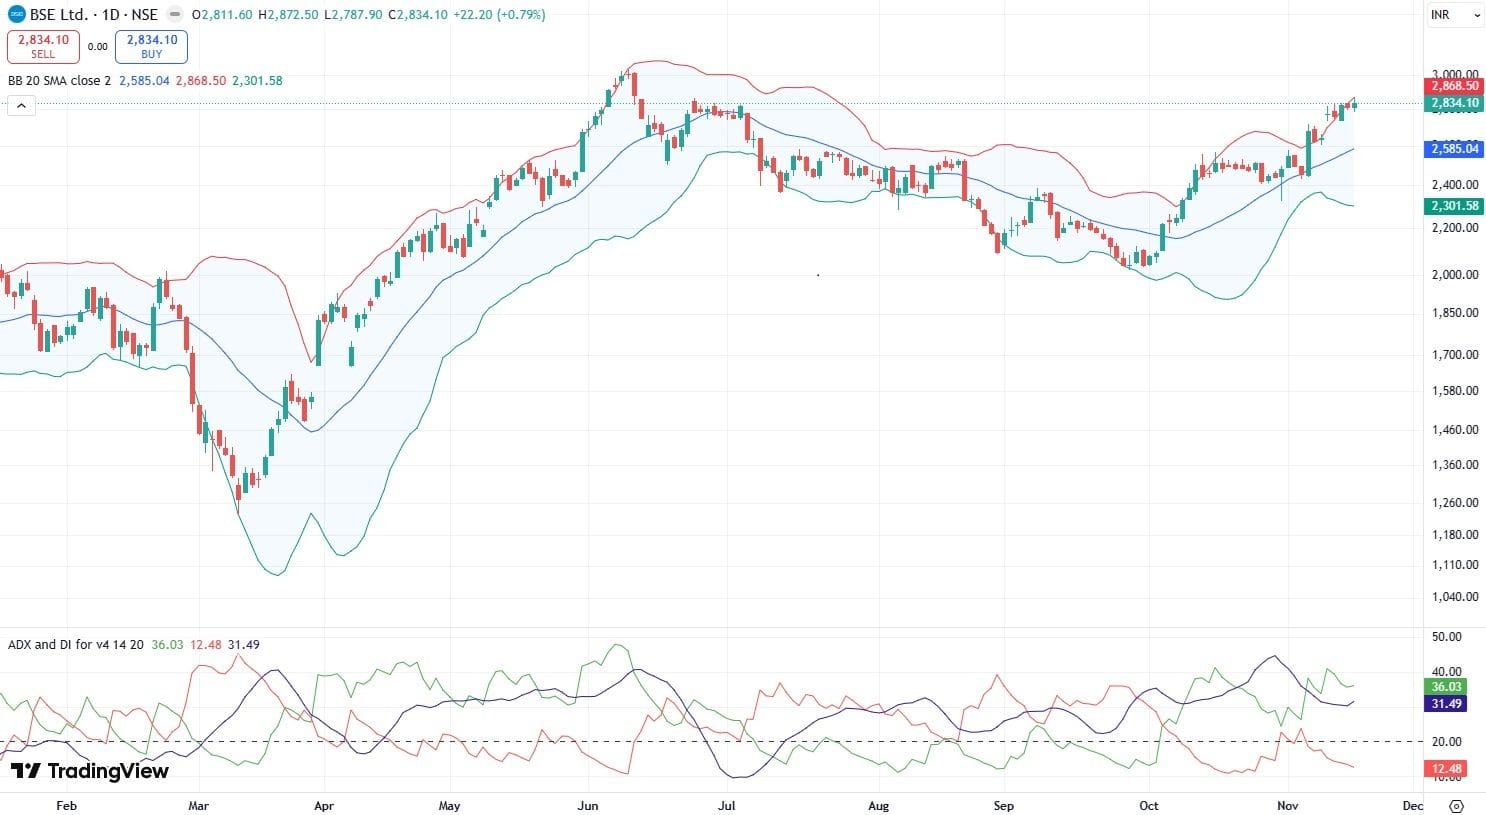
BSE continued to climb higher post strong quarterly numbers. On the daily chart, the stock has managed to protect its prior day’s low on a closing basis since November 7, which keeps the overall bias on the side of the bulls.
Moreover, ADX is trading at 31 levels, indicating positive momentum to continue in the stock. Also, prices continue to close near the upper Bollinger Bands and are currently trading near the important resistance of Rs 2,875. A decisive break above this can further extend the up move towards Rs 3,030, followed by fresh record highs. On the downside, Rs 2,760 is the nearest support.
Strategy: Buy
Target: Rs 3,030
Stop-Loss: Rs 2,760
Siemens | CMP: Rs 3,249.5
On the daily chart, Siemens has been moving in respect to its upward-sloping trendline since March 2025. Recently, prices found support on it and have gained more than 8 percent since, which highlights buying pressure from lower levels. Supertrend has also just turned green, which is a positive sign.
So, one can expect this move to continue until we see a close below the prior day’s low. Lastly, RSI is trading at a comfortable level of 63, which further provides space for prices to trend higher. For now, a break above Rs 3,280 can boost bullish momentum towards Rs 3,410 followed by Rs 3,500.
Strategy: Buy
Target: Rs 3,410, Rs 3,500
Stop-Loss: Rs 3,150
Housing & Urban Development Corporation | CMP: Rs 243.93
On the daily chart, HUDCO was moving in a larger triangle pattern since almost the start of April 2025. In the previous session, prices finally gave a breakout from the pattern and were up by 2 percent with a spike in volumes for the first time since October 1, indicating strong bullishness in the stock.
Along with this, MACD has just shown a bullish crossover above the zero line, which acts as a double confirmation for our stance. However, after the sharp rally of two consecutive days, buying on dips looks like a prudent strategy for better risk–reward with targets of Rs 255.
Strategy: Buy
Target: Rs 255
Stop-Loss: Rs 230
Disclaimer: The views and investment tips expressed by experts on Moneycontrol are their own and not those of the website or its management. Moneycontrol advises users to check with certified experts before taking any investment decisions.Discover the latest Business News, Sensex, and Nifty updates. Obtain Personal Finance insights, tax queries, and expert opinions on Moneycontrol or download the Moneycontrol App to stay updated!
Find the best of Al News in one place, specially curated for you every weekend.
Stay on top of the latest tech trends and biggest startup news.


