


The benchmark indices were caught in a bear trap with the Nifty 50 falling 1.5% on April 4 after retaliation by China, imposing a 34% tariff on US products. The market breadth was strongly in favour of declines, with about 2,159 shares seeing correction compared to 430 rising shares on the NSE. The market is expected to see more weakness in the upcoming sessions, given the dismal global cues. Below are some trading ideas for the near term:
Rajesh Bhosale, Technical Analyst at Angel One
Max Financial Services | CMP: Rs 1,165

Max Financial Services (MFSL) has registered a bullish breakout from multiple chart patterns. The stock has closed above its February swing high of Rs 1,160, confirming a rounding bottom breakout. Following a strong rally from the Rs 1,050 zone and a brief consolidation phase, we are now witnessing a Flag pattern breakout, indicating a strong trend resumption. Both breakouts are backed by healthy volumes and a favourable setup across key indicators. We expect this positive momentum to continue in the near term. Hence, we recommend buying MFSL around Rs 1,165 - Rs 1,155.
Strategy: Buy
Target: Rs 1,265
Stop-Loss: Rs 1,115
Tata Consumer Products | CMP: Rs 1,087.85

Tata Consumer delivered strong performance despite weakness in the broader market during the last week. The stock has closed above its February swing high of Rs 1,075, establishing a higher top–higher bottom structure, which indicates the continuation of a bullish price cycle. On both the daily and weekly charts, the stock has formed strong bullish candles and closed above all major moving averages, reinforcing the positive momentum. Hence, we recommend buying Tata Consumer Products around Rs 1,088 - Rs 1,080.
Strategy: Buy
Target: Rs 1,150
Stop-loss: Rs 1,048
Riyank Arora, Technical Analyst at Mehta Equities
CG Power and Industrial Solutions | CMP: Rs 575.2

CG Power has touched its trendline support mark of Rs 580 on its daily charts. With the RSI (14) around 37, the stock is showing slightly oversold conditions. An ADX (Average Directional Index) of approximately 21 indicates low momentum, and based on the technical setup, the risk-reward profile favors buyers with limited downside risk from current levels. Additionally, the stock touched its major support level of Rs 570 during Friday’s trading session. We recommend buying the stock.
Strategy: Buy
Target: Rs 625, Rs 650
Stop-Loss: Rs 555
MCX India | CMP: Rs 5,026.8

MCX India broke down below its immediate support mark of Rs 5,077 and closed below that level. With the RSI (14) around 44, the stock indicates neutral conditions. An ADX of around 18 suggests low momentum, and based on the technical setup, the risk-reward profile favors sellers at current levels. Furthermore, the stock broke below its 20-period simple moving average during Friday’s session, which is a negative sign. We recommend a sell on the stock.
Strategy: Sell
Target: Rs 4,600
Stop-Loss: Rs 5,200
Tata Chemicals | CMP: Rs 812.4

Tata Chemicals broke down below its immediate support levels of Rs 840 and Rs 825 on daily charts. With the RSI (14) around 39, the stock indicates neutral conditions. An ADX of approximately 21 signals low momentum, and based on the technical setup, the risk-reward profile favors sellers at current levels. Moreover, the stock broke and closed below its 20-period simple moving average during Friday’s session, which is a negative sign. We recommend a sell on the stock.
Strategy: Sell
Target: Rs 775, Rs 765
Stop-Loss: Rs 835
Anshul Jain, Head of Research at Lakshmishree Investments
UltraTech Cement | CMP: Rs 11,498.65

UltraTech Cement is showing a bullish setup on the daily chart, forming a 72-day-long double bottom pattern. The stock is currently hovering near a key pivot level of Rs 11,750. What makes this setup compelling is the strong accumulation seen at the base, with volume patterns indicating that weak hands have exited after a failed low. Stronger investors now appear to be in control. Technically, any dip toward the Rs 10,800–11,200 zone offers a solid pre-emptive buying opportunity for those eyeing a medium-term upside. The structure suggests strength, and momentum could follow soon.
Strategy: Buy
Target: Rs 12,490
Stop-Loss: Rs 10,700
HDFC Bank | CMP: Rs 1,817.3

HDFC Bank is showing strength on the daily chart, forming a 70-day-long Cup and Handle pattern—a bullish setup often seen before strong rallies. Despite a weak broader market, the stock broke out in the previous session at Rs 1,812, signaling renewed momentum. What adds weight to this move is the base-on-base structure. The current breakout is backed by two earlier bases, neither of which saw failed moves or sharp reversals. This triple base formation suggests strong institutional support. With a clean breakout in place, HDFC Bank could be setting up for sustained upside in the sessions ahead.
Strategy: Buy
Target: Rs 1,950
Stop-Loss: Rs 1,750
Axis Bank | CMP: Rs 1,091.3
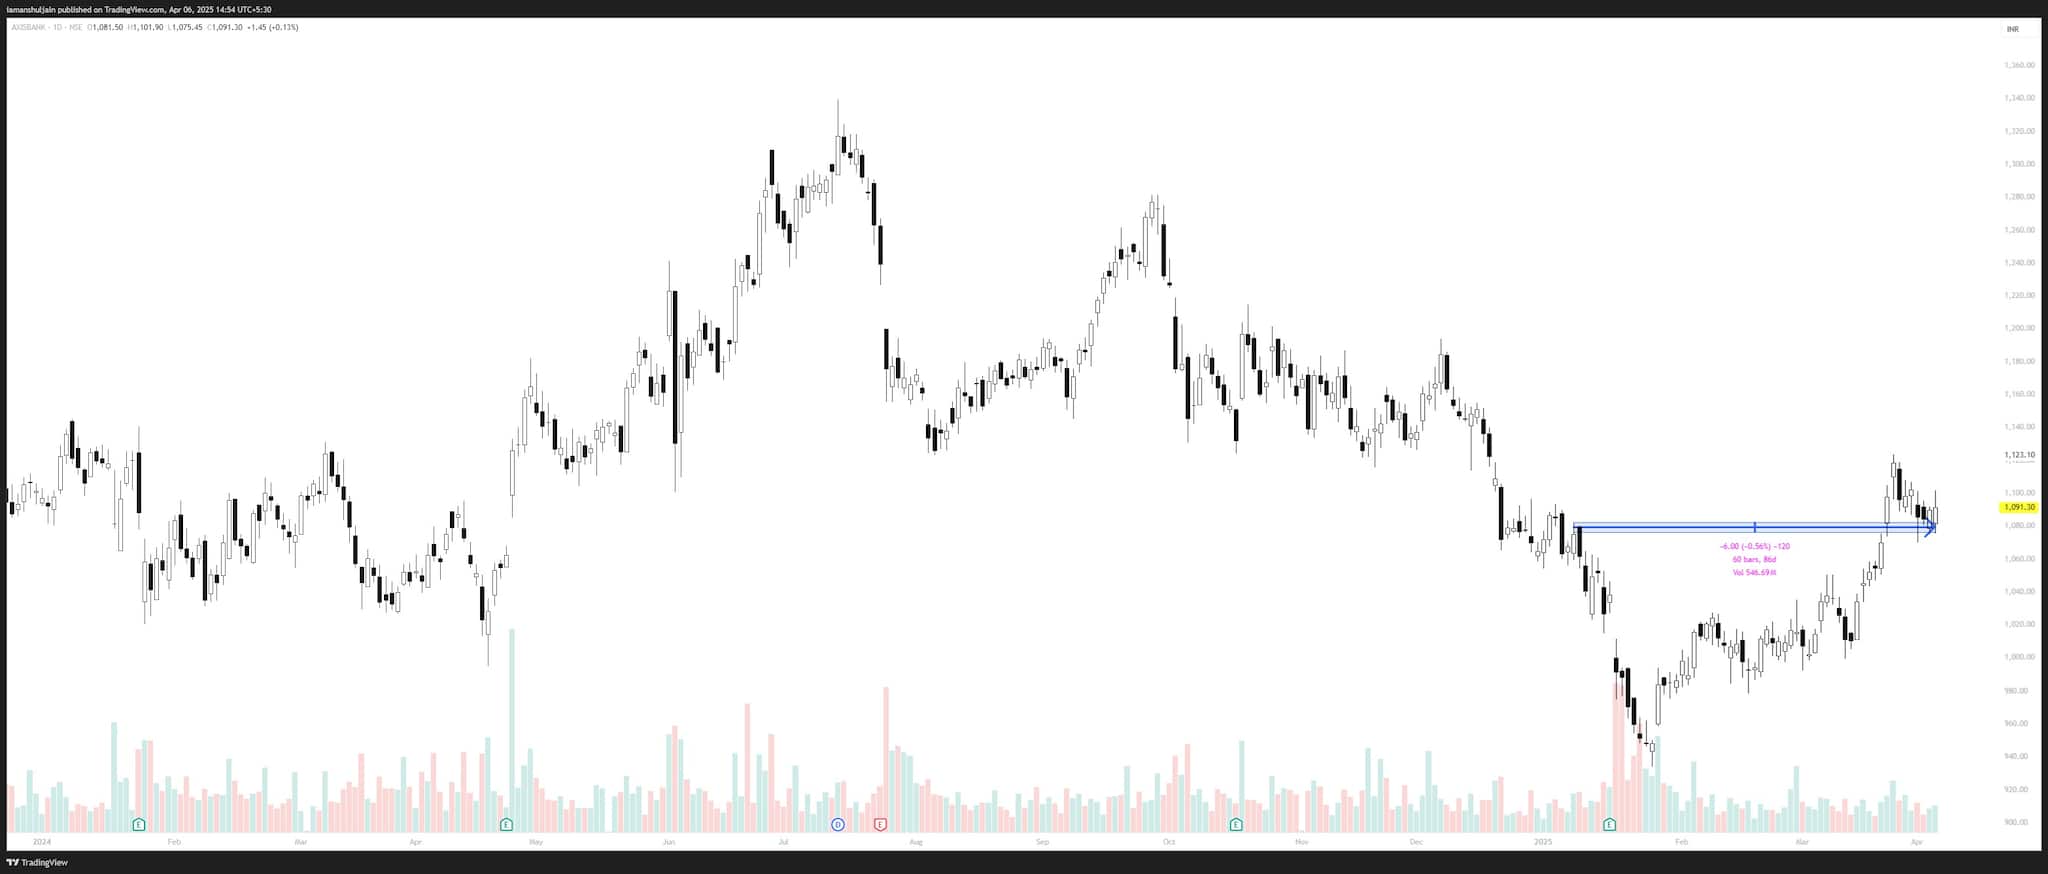
Axis Bank has broken out of a bullish rounding bottom pattern on the daily chart around the Rs 1,070 mark. After the breakout, the stock pulled back slightly, nearly retesting its base—an encouraging sign of strength and confirmation. The price action suggests that dips toward the Rs 1,070–1,060 zone offer a good risk-reward opportunity for traders. With momentum building and the structure intact, the stock is poised for an immediate upside target near Rs 1,192. As long as it holds above the support zone, Axis Bank remains a strong candidate for a buy-on-dips strategy.
Strategy: Buy
Target: Rs 1,192
Stop-Loss: Rs 1,020
Disclaimer: The views and investment tips expressed by experts on Moneycontrol are their own and not those of the website or its management. Moneycontrol advises users to check with certified experts before taking any investment decisions.Discover the latest Business News, Sensex, and Nifty updates. Obtain Personal Finance insights, tax queries, and expert opinions on Moneycontrol or download the Moneycontrol App to stay updated!
Find the best of Al News in one place, specially curated for you every weekend.
Stay on top of the latest tech trends and biggest startup news.


