


With the breaking of month-long consolidation range, bears have taken charge of Dalal Street ahead of the Union Budget. In fact, it was a disheartening start to the February series on January 27 and, as a result, the market shed more than 2 percent in the passing week.
The Nifty50 closed at more than four-month low of 17,604, breaking out of the strong support at 17,800 held for a month amid consolidation and posting the biggest weekly loss since the week ended December 23.
The next support lies at 50 WEMA (weekly exponential moving average) of 17,400 after breaking the short-term moving averages of 9, 20 and 21 weeks. Experts hope to see a lot of volatility given the Union Budget week, but if the Nifty manages to hold the 50 WEMA, then there are fair chances that the index can easily surpass the 17,800-18,200 zone in the coming days, followed by 18,500.
"From an optimist point of view, it’s good that the market is approaching this event (Budget 2023) on a lighter note and any favourable outcome would lift the markets higher. On the other hand, a slight disappointment would lead to further aberration in the market," Sameet Chavan, Chief Analyst-Technical and Derivatives at Angel One, said.
"Considering the ‘positive divergence’ in the ‘RSI-smoothened’ oscillator, we may expect some recovery from lower levels," he said.
He feels 17,700 – 17,800 are to be seen as strong hurdles. If the market has to regain strength as well as confidence, Nifty needs to surpass 18,000 on a closing basis.
The market expert advised traders to keep a note of all these scenarios and should ideally remain light ahead of the event.
Let's take a look at the top 10 trading ideas by experts for the next three-four weeks. Returns are based on the January 27 closing prices:
Expert: Shrikant Chouhan, Head of Equity Research (Retail) at Kotak Securities
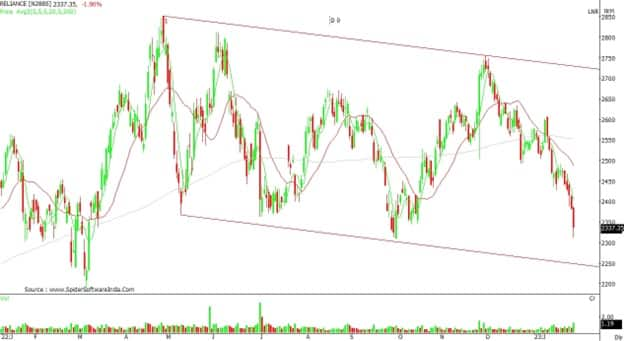
Reliance Industries: Buy | LTP: Rs 2,337 | Stop-Loss: Rs 2,150 | Target: Rs 2,700 | Return: 15 percent
For the past 8 months, the stock has been in a wide trading range of Rs 2,200 and Rs 2,700. Whenever the market falls to extreme levels, Reliance falls on the lower boundary of the bearish parallel. On the other hand, Reliance was at Rs 2,700 whenever the market touched 18,500 level.
After a period of 4 months, the stock has again fallen to the level of Rs 2,300. Based on the logic of the bullish parallel channel, contra traders should be buyers at current levels and more on the downside around Rs 2,250. However, it requires a final stop-loss at Rs 2,150. On the upside, Rs 2,440, Rs 2,550 and Rs 2,700 would be major barriers.
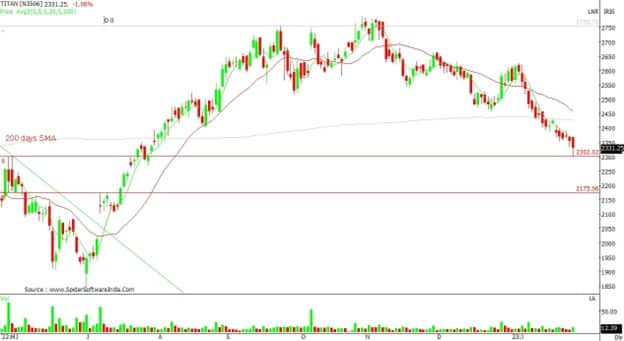
Titan Company: Buy | LTP: Rs 2,331 | Stop-Loss: Rs 2,150 | Target: Rs 2,600 | Return: 11 percent
From the lows of July 2022, the stock displayed a spectacular rally. It was at Rs 1,800 level and moved to Rs 2,790 in a period of 4 months, which is significant.
In the last 3 months, the stock is displaying a corrective move and has hit the support of 50 percent retracement ratio of the entire rally of Rs 1,000 points.
The positional/Contra traders should be buyers at current levels and more on dips at Rs 2,230. Place a stop-loss at Rs 2,150, which is slightly below the retracement level of 61.80 percent. Hurdles would be Rs 2,500 and Rs 2,600.
HDFC Bank: Buy | LTP: Rs 1,616 | Stop-Loss: Rs 1,500 | Target: Rs 1,750 | Return: 8 percent
The stock remained well above Rs 1,600-1,550 levels in last 3 months. In fact, whenever the stock dropped to Rs 1,600 or Rs 1,550 levels, it was quickly bought up.
In the last three days, Bank Nifty and bank stocks declined vertically, however, HDFC Bank remained the least loser.
Technically, we should be positional buyers between Rs 1,600 and Rs 1,550. Keep stop-loss at Rs 1,500. On the upside, the stock may decline towards Rs 1,680 or Rs 1,750 levels.

Expert: Ruchit Jain, Lead Research at 5paisa.com
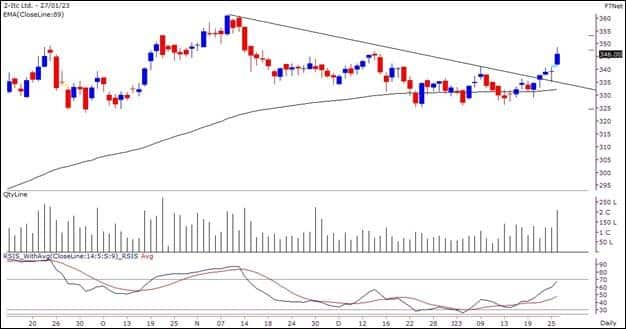
ITC: Buy | LTP: Rs 346 | Stop-Loss: Rs 334 | Target: Rs 367 | Return: 6 percent
The stock has recently seen a corrective phase where prices have corrected from the high of Rs 361 to Rs 325. The stock has now given a breakout from a falling trendline resistance and has seen a gradual increase in volumes along with the price upmove.
The prices have also managed to show relative strength in the volatile markets during last week. The RSI (relative strength index) oscillator is hinting at a positive momentum and hence, we expect an upmove in the stock in the short term.
Hence, short term traders can look for buying opportunities in the range of Rs 346-342. The possible near term targets for the stock are expected around Rs 358 and Rs 367. The stop-loss for long positions should be placed below Rs 334.
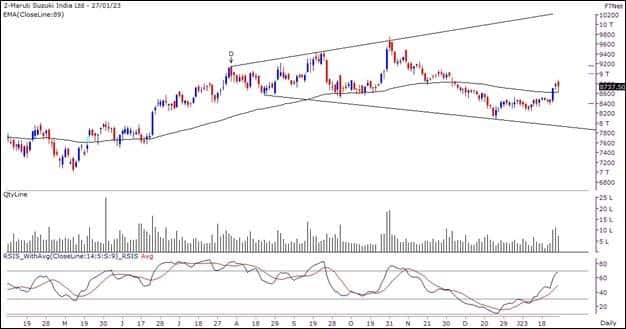
Maruti Suzuki: Buy | LTP: Rs 8,737 | Stop-Loss: Rs 8,420 | Target: Rs 8,970 | Return: 3 percent
Post a corrective phase, the auto stocks have seen a positive momentum during last week and within this sector, Maruti has witnessed a pullback move along with rise in volumes. After the recent price-wise correction, the stock witnessed some consolidation and price volumes action indicates that the stock would resume its higher degree uptrend.
The RSI oscillator is in buy mode on the daily chart and is turning positive on the weekly charts as well.
Hence, traders can look to buy the stock on dips in the range of Rs 8,620-8,600 for potential targets around Rs 8,820 and Rs 8,970. The stop-loss for long positions should be placed below Rs 8,420.
Expert: Vidnyan Sawant, AVP - Technical Research at GEPL Capital
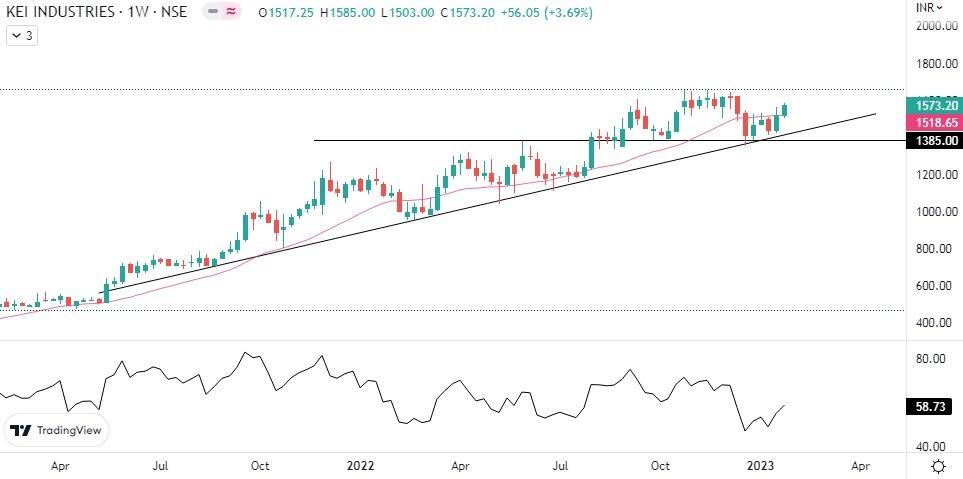
KEI Industries: Buy | LTP: Rs 1,573 | Stop-Loss: Rs 1,465 | Target: Rs 1,780 | Return: 13 percent
The KEI has recently shown a bounce to the upside while taking support from the Bullish trend line which the prices have respected since May 2021.
Around the level of Rs 1,385 the stock has witnessed change in its polarity by the prices which points towards the rising bullish sentiment behind the intact trend.
The stock's price has surpassed the 20-week EMA which acted as a variable support for the prices.
While the momentum indicator RSI on the Daily timeframe has shown a Range shift which reflects the rising momentum for the prices.
We expect the prices to move higher till the level of Rs 1,780 where the stop-loss must be of Rs 1,465 strictly on the closing basis.
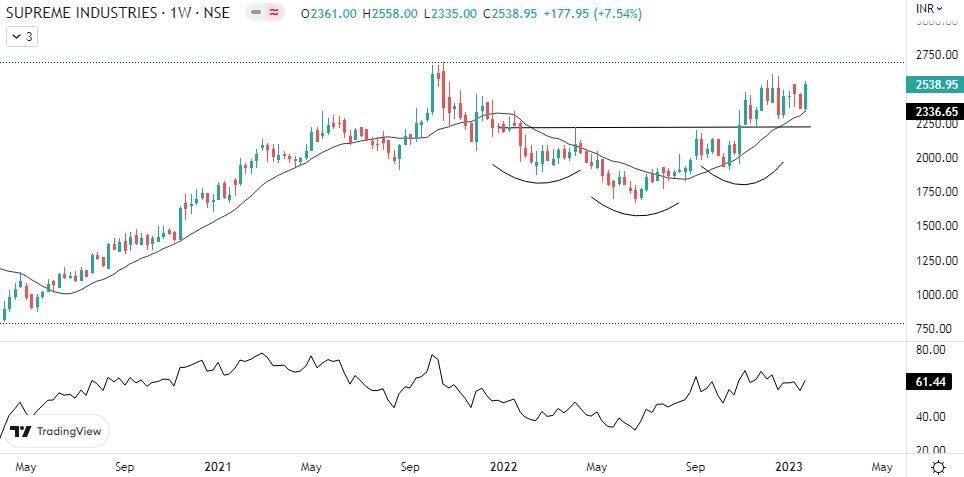
Supreme Industries: Buy | LTP: Rs 2,539 | Stop-Loss: Rs 2,330 | Target: Rs 2,900 | Return: 14 percent
Supreme, is currently Trading near record Highs which tells that the stock already is in strong momentum.
The stock in the first week of November 2022 gave a breakout from the Inverse Head and Shoulder pattern which indicated beginning of the trend to the upside.
The bounce to the upside in the latest week is preceded by the prices taking support from the 16-week EMA, which acted as a strong variable support to the prices.
The RSI on the Daily timeframe has given a breakout, which reflect strong bullish momentum.
We expect the prices to move higher till the level of Rs 2,900 where the stop-loss must be of Rs 2,330 strictly on the closing basis.
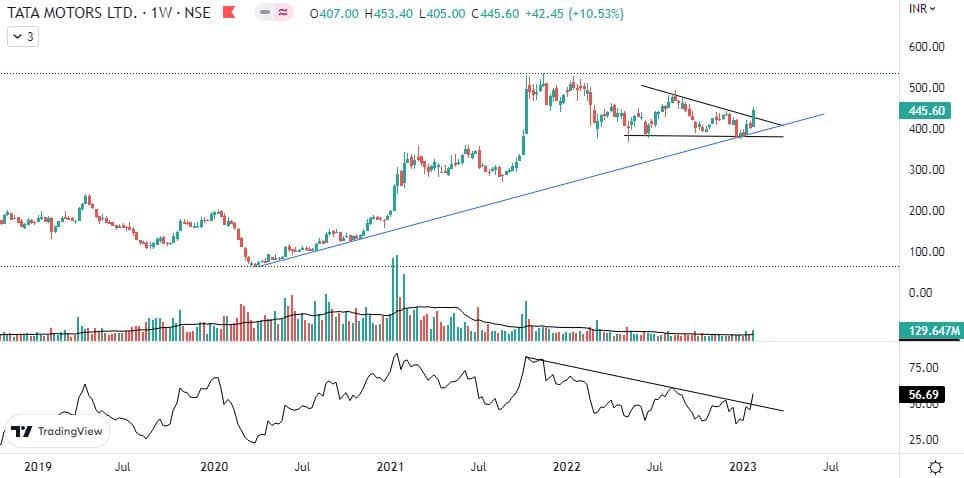
Tata Motors: Buy | LTP: Rs 445.60 | Stop-Loss: Rs 390 | Target: Rs 560 | Return: 26 percent
The correction in the Tata Motors post January 2022 took in a disciplined way as the stock did not get into lower low, lower high formation.
The stock in the latest week gave a breakout from the Descending Triangle pattern which points towards the beginning of the trend to the upside.
The breakout is confirmed as it was accompanied by higher volumes and a gap.
The momentum indicator RSI has shown a bullish breakout which reflects the strong momentum in the prices.
We expect the prices to move higher till the level of Rs 560 where the stop-loss must be Rs 390 on the closing basis.
Expert: Jigar S Patel, Senior Manager - Equity Research at Anand Rathi
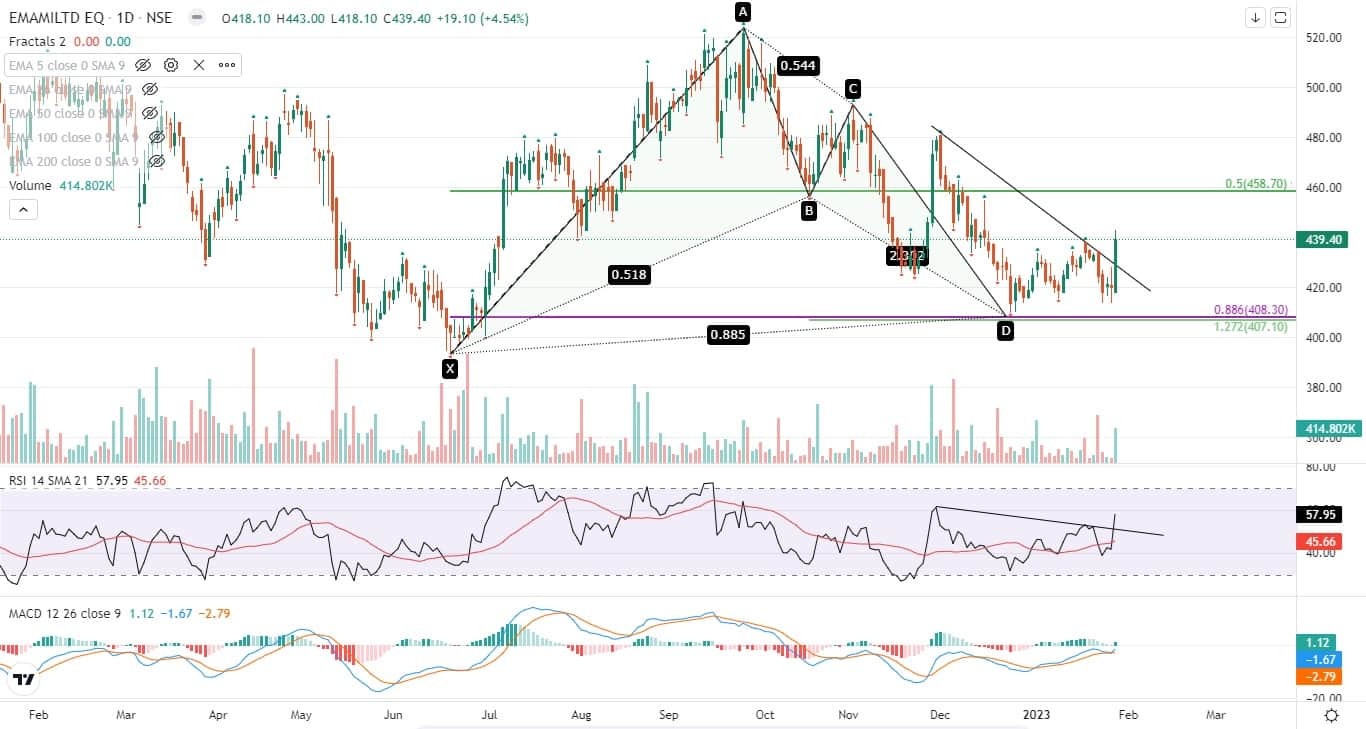
Emami: Buy | LTP: Rs 439 | Stop-Loss: Rs 409 | Target: Rs 480 | Return: 9 percent
In spite of the fact that the said counter has witnessed massive beating after making the high of Rs 524 on September 26, 2022 which resulted in a 22 percent cut in stock price. Since last month the said counter looks like it has stabilized around Rs 410-415 zone.
Following are some important points that are making Emami as a buy candidate:
Bullish Bat was seen on a daily scale with a potential reversal zone of Rs 415-425. Furthermore, bullish divergence was seen on the daily scale of RSI (relative strength index) and MACD (moving average convergence divergence). In addition to bullish divergence, trendline violation was seen on RSI. (refer to the chart).
Selling volume has dried up from the recent fall from Rs 480 to 410 thus indicating a possible turnaround. In the previous trading session, the counter witnessed decent buying of 4.5 percent supported by good volume at lower levels.
Looks like the price structure has changed since Emami has vouched for by breaking its previous swing high of Rs 438 and successfully closing near Rs 440 mark.
One can buy in the range of Rs 436-442 in a small tranche and another around Rs 420-425 (if tested again). Target is expected at Rs 480 with a stop-loss of Rs 409 on a daily closing basis.
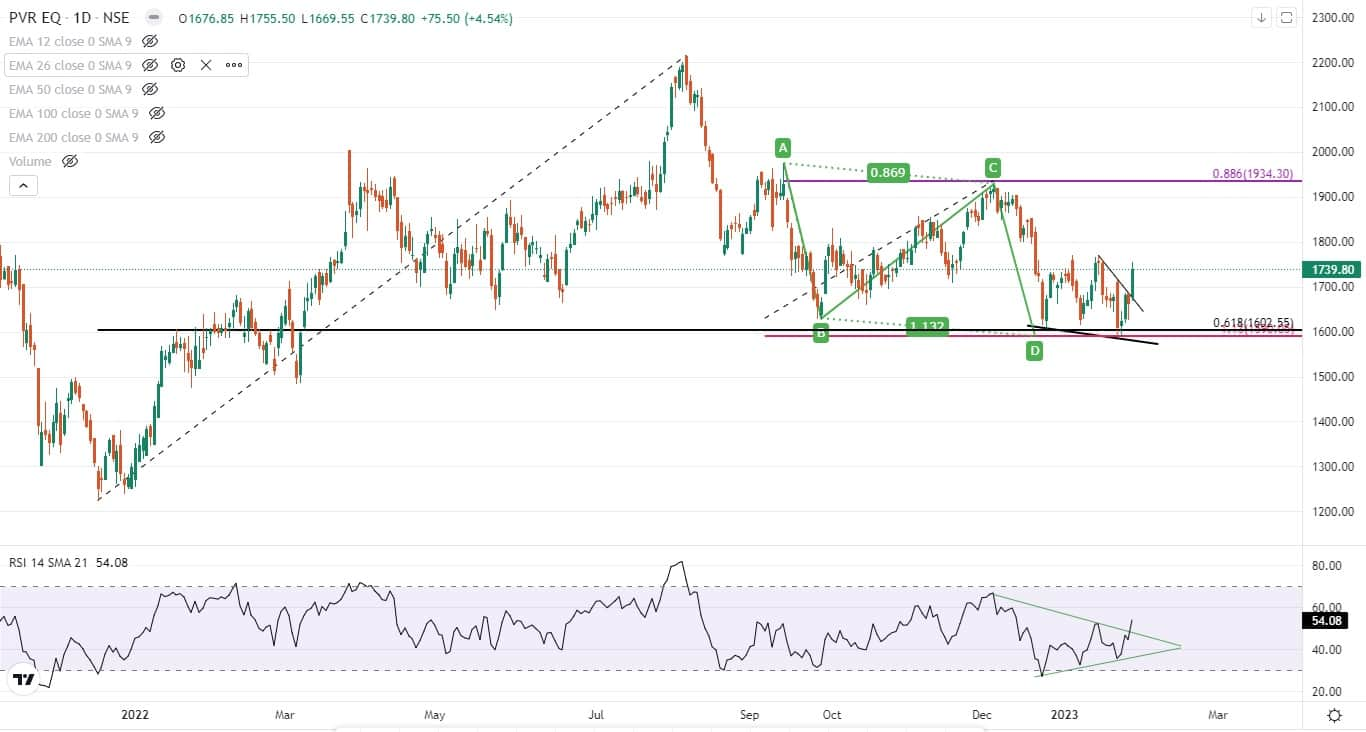
PVR: Buy | LTP: Rs 1,740 | Stop-Loss: Rs 1,649 | Target: Rs 1,825 | Return: 5 percent
At the current juncture, PVR is trying to stabilize near the 0.618 retracements of its previous rally which was started from December 2021 till August 2022.
Following are some important pointers that are making PVR a buy candidate:
Bullish AB=CD was seen on a daily scale with a potential reversal zone of Rs 1,620-1,650. Furthermore, bullish divergence was seen on the daily scale of RSI and MACD histogram. In addition to bullish divergence, trendline violation is seen on RSI. (refer to the chart).
Also, Triple bottom formation was seen on 0.618 retracement which makes PVR more lucrative at current levels.
Looks like the price structure has changed since PVR has vouched for by breaking its previous resistance of Rs 1,700 and successfully closing near Rs 1,740 mark.
One can buy in the range of Rs 1,725-1,740 in a small tranche and another around Rs 1,680-1,700 (if tested again). Target is expected at Rs 1,825 with a stop-loss of Rs 1,649 on a daily closing basis.
Disclaimer: The views and investment tips expressed by investment experts on Moneycontrol.com are their own and not those of the website or its management. Moneycontrol.com advises users to check with certified experts before taking any investment decisions.
Disclaimer: MoneyControl is a part of the Network18 group. Network18 is controlled by Independent Media Trust, of which Reliance Industries is the sole beneficiary.
Discover the latest Business News, Sensex, and Nifty updates. Obtain Personal Finance insights, tax queries, and expert opinions on Moneycontrol or download the Moneycontrol App to stay updated!
Find the best of Al News in one place, specially curated for you every weekend.
Stay on top of the latest tech trends and biggest startup news.


