


The market showed a strong intraday recovery, and the rally in the second half helped the benchmark indices close 1 percent higher on December 5. However, the breadth was not very strong, with 1,285 shares advancing compared to 1,185 shares declining on the NSE. The market is expected to maintain an upward bias amid likely consolidation, with a focus on the outcome of the RBI monetary policy meeting. Below are some trading ideas for the near term:
Mandar Bhojane, Equity Research Analyst at Choice BrokingBLS International Services | CMP: Rs 420.35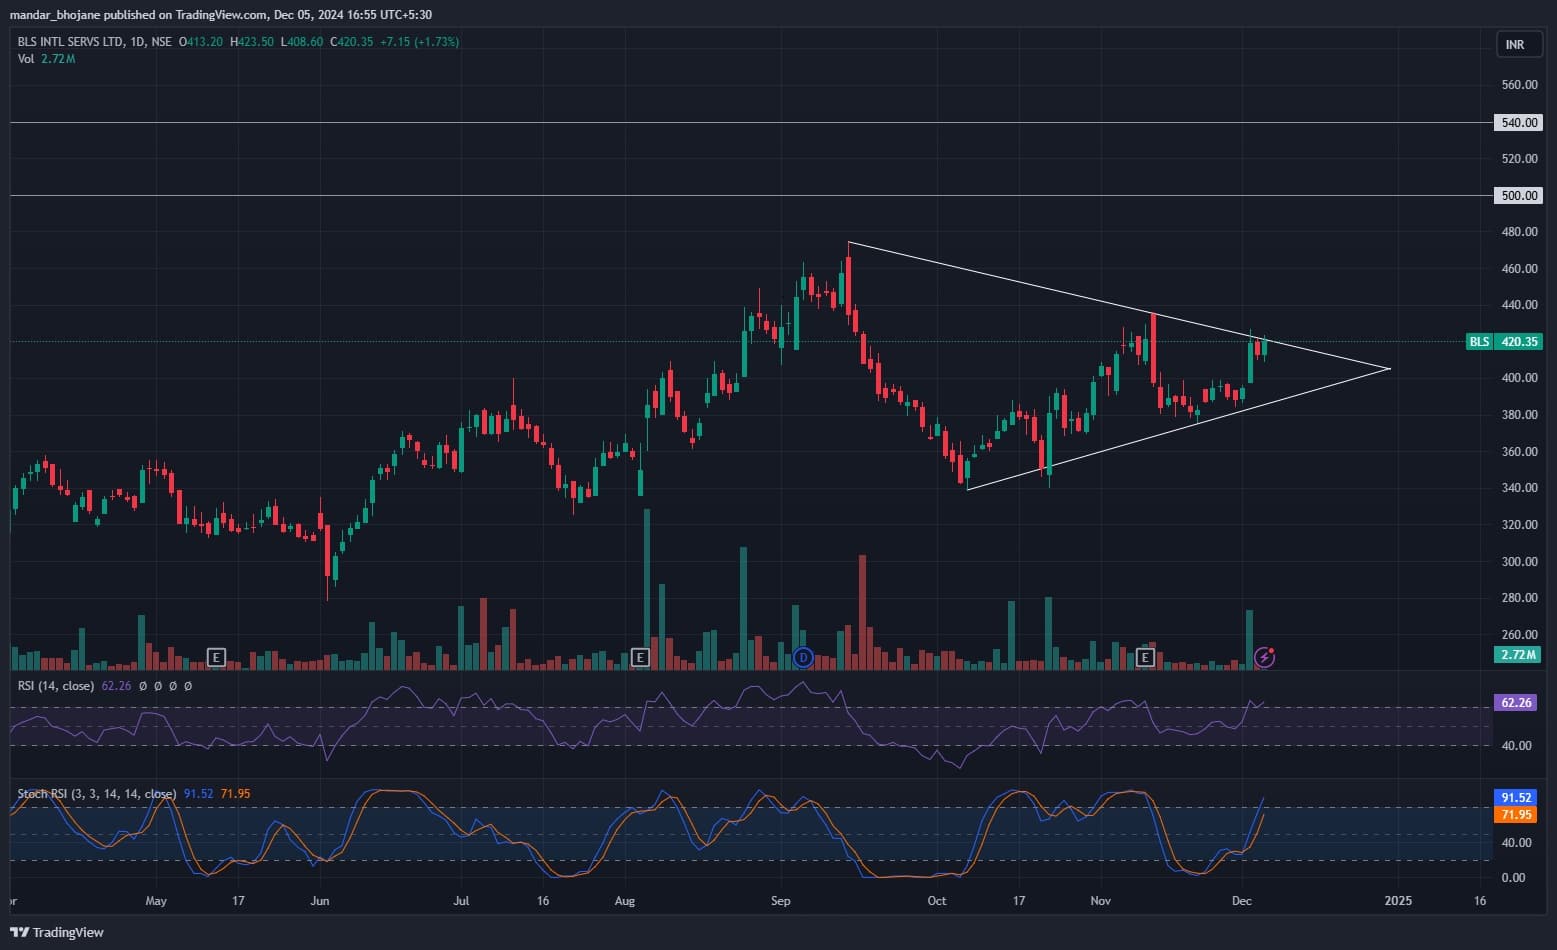
BLS is on the verge of a breakout from a symmetrical triangle pattern. The price has been consolidating just below the breakout level on the daily chart, signaling strong bullish potential. This anticipated breakout, accompanied by a notable increase in trading volume, further reinforces the likelihood of upward momentum. Additionally, the RSI (Relative Strength Index) is trending upward at 62.26, and the Stochastic RSI shows a positive crossover, both indicating strengthening bullish signals. A decisive close above Rs 425 could open the door for short-term targets of Rs 500 and Rs 540. On the downside, immediate support is seen at Rs 405, providing a strategic entry point for buying on dips.
Strategy: Buy
Target: Rs 500, Rs 540
Stop-Loss: Rs 386
Sundaram Clayton | CMP: Rs 2,561.55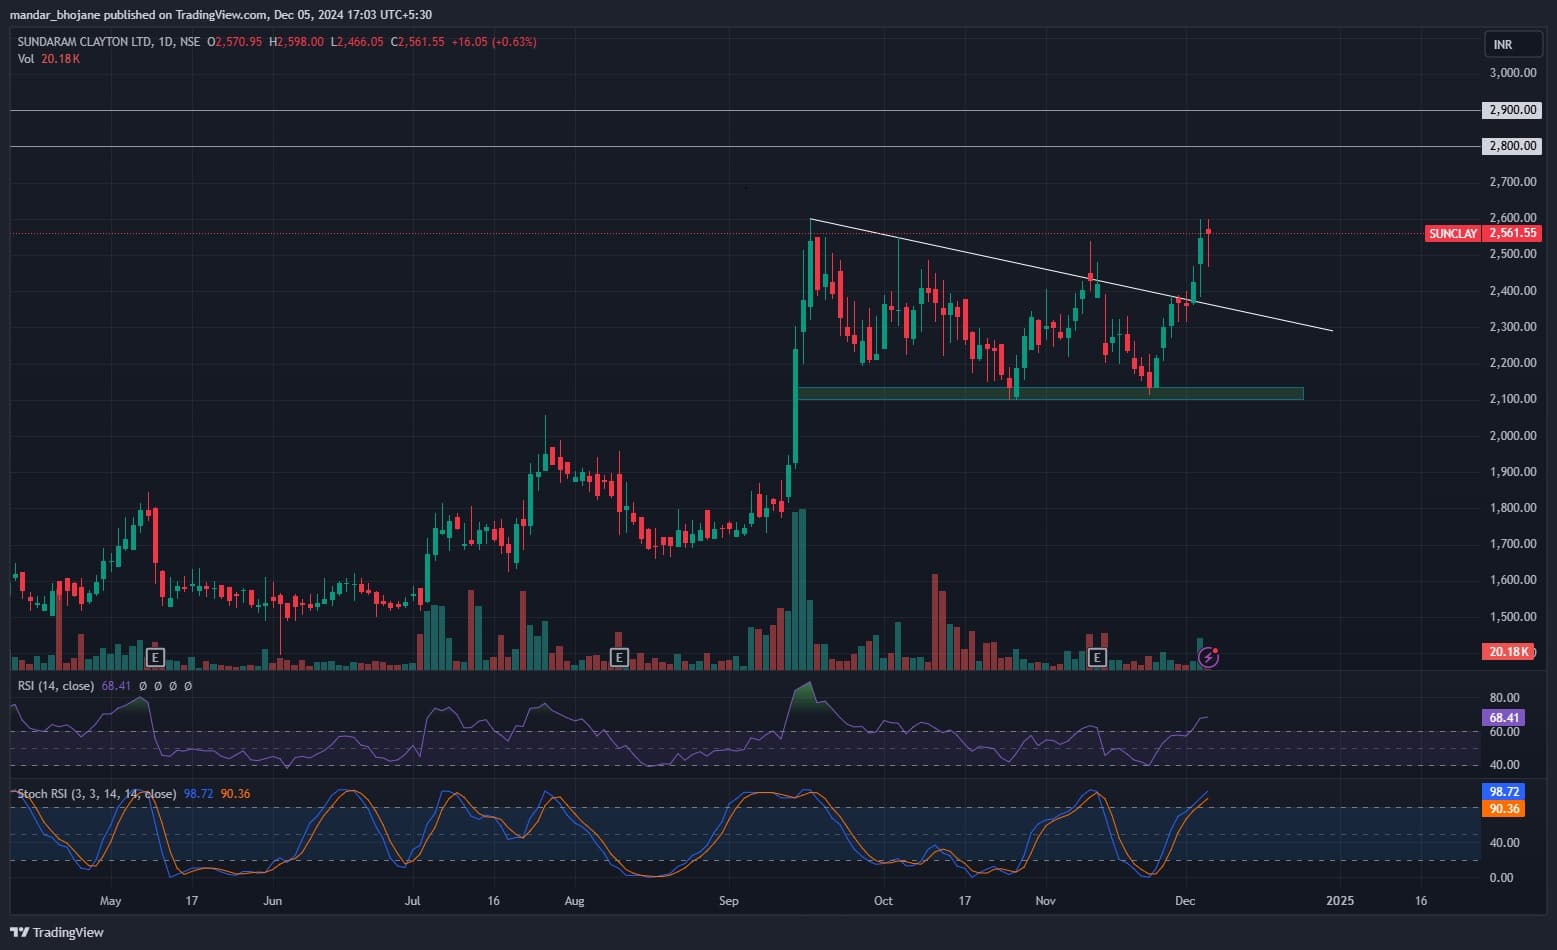
Sundaram Clayton has recently broken out of a descending triangle pattern on the daily chart. This breakout is supported by a significant increase in trading volume, indicating robust buying interest and the potential for sustained upward momentum. Technical indicators further align with the bullish outlook, with the RSI trending upward at 68.4 and the Stochastic RSI confirming a positive crossover. If the price sustains above Rs 2,600, it could set the stage for short-term targets of Rs 2,800 and Rs 2,900. On the downside, immediate support at Rs 2,460 offers a strategic opportunity for buying on dips.
Strategy: Buy
Target: Rs 2,800, Rs 2,900
Stop-Loss: Rs 2,400
EMS | CMP: Rs 833.85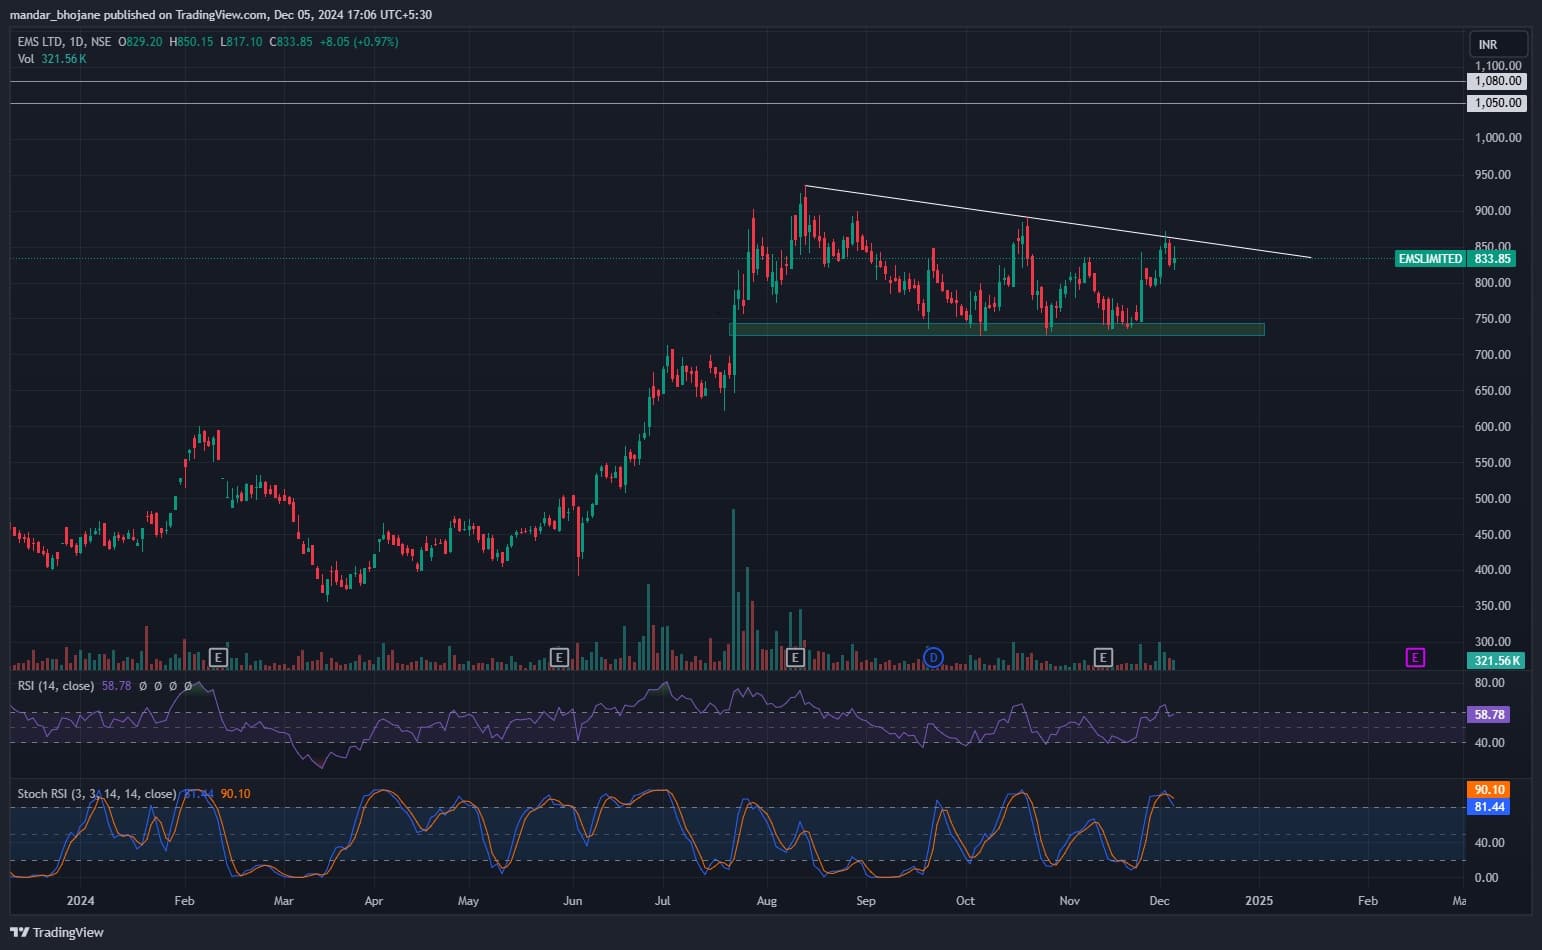
EMS is nearing a breakout from a descending triangle pattern on the daily chart. The stock has been consolidating near its resistance level, signaling possible accumulation by buyers. Increased trading volumes point to heightened buying interest, suggesting a potential continuation of bullish momentum. Supporting this outlook, the RSI is trending upward at 58.78, the Stochastic RSI has exhibited a positive crossover, and the price is trading above all major EMAs.
A decisive close above Rs 840 could act as a catalyst for further upward movement, targeting Rs 960 and Rs 1,000 in the short term. On the flip side, strong support at Rs 800 provides a favourable entry point for investors looking to buy on dips. To minimize risk, it is prudent to set a stop-loss at Rs 780 to guard against unexpected market retracements.
Strategy: Buy
Target: Rs 960, Rs 1,000
Stop-Loss: Rs 780
Ameya Ranadive, CMT, Senior Technical Analyst at StoxboxBSE | CMP: Rs 5,194.9
BSE has shown a strong breakout from an ascending triangle pattern on the daily chart, supported by impressive volume. The breakout indicates a bullish continuation, highlighting investor interest and the potential for further upside momentum. The stock surged 13.62 percent on Thursday, accompanied by a sharp increase in volumes, which validates the reliability of this technical breakout.
Key technical indicators support the positive outlook. The Average Directional Index (ADX) is strong, signaling a robust trend in progress. The RSI is at 68, suggesting momentum is favouring the bulls, though not yet overbought. Given this setup, the stock looks poised to achieve its immediate targets in the range of Rs 5,450–Rs 5,600. However, risk management is crucial, and the bullish view would be negated if the stock falls below Rs 4,900, which serves as a critical support level.
Strategy: Buy
Target: Rs 5,450, Rs 5,600
Stop-Loss: Rs 4,900
Welspun Specialty Solutions | CMP: Rs 45.95
Welspun Specialty Solutions is exhibiting a bullish setup. The price has decisively broken above key moving averages (20 EMA: Rs 43.57, 50 EMA: Rs 45.38, and 100 EMA: Rs 45.71), indicating a potential trend reversal. The robust volume spike further validates the breakout, suggesting strong buying interest.
The RSI stands at 57.17, highlighting improving momentum. Additionally, a positive RSI divergence observed earlier signals a potential upward move. With this favourable technical setup, the stock appears poised to achieve targets in the range of Rs 50–Rs 53. Sustained momentum above the 100 EMA (Exponential Moving Average) would further strengthen the bullish view. However, a fall below Rs 41.50 would negate the bullish outlook, as this level serves as crucial support.
Strategy: Buy
Target: Rs 50, Rs 53
Stop-Loss: Rs 41.50
PCBL | CMP: Rs 468.4
PCBL is displaying strong bullish momentum on the daily chart. A breakout from the downward-sloping channel is evident, supported by increased volume, suggesting growing buying interest. The price is currently trading above critical moving averages (50-day, 100-day, and 200-day), with the 50-day moving average at Rs 429.85 providing immediate support.
Indicators like the RSI are strengthening, with the RSI at 64.20, indicating positive momentum while not yet overbought. The ADX confirms an improving trend strength, with the +DI (Directional Indicator) line significantly outpacing the -DI line. The immediate resistance lies at Rs 515.85, and the price target for this breakout is in the range of Rs 516–535. If the momentum sustains, this target is achievable in the near term. However, a breakdown below Rs 430 will invalidate the bullish view. In summary, the stock remains bullish above Rs 430, with potential to rally towards Rs 535, supported by strong volume and technical confirmation of trend reversal.
Strategy: Buy
Target: Rs 516, Rs 535
Stop-Loss: Rs 430
Chandan Taparia, Head of Derivatives & Technicals, Wealth Management at Motilal Oswal Financial ServicesTech Mahindra | CMP: Rs 1,786.95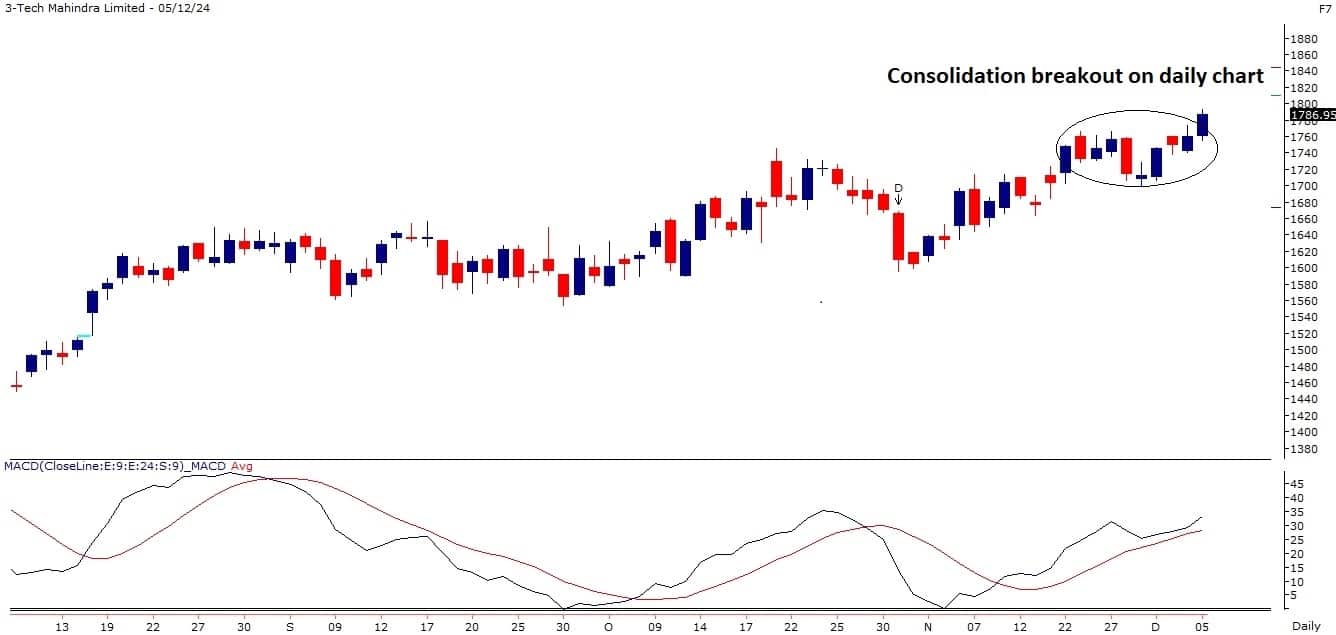
Tech Mahindra has given a consolidation breakout on the daily chart and achieved its highest daily close ever. Buying is visible across IT stocks, which may support the ongoing upmove. The strength indicator ADX is headed upward, which confirms the uptrend.
Strategy: Buy
Target: Rs 1,935
Stop-Loss: Rs 1,705
Zomato | CMP: Rs 299.35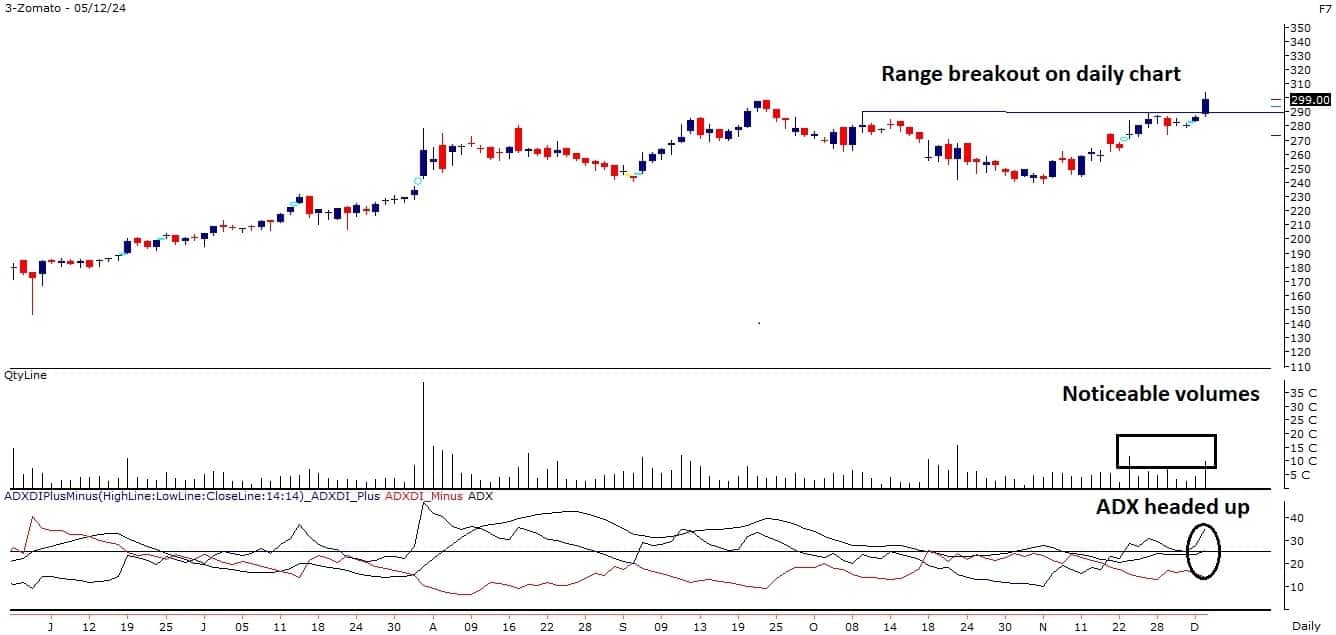
Zomato has given a range breakout on the daily chart and managed to close above the same. It has formed a strong bullish candle on the daily scale, and the base is shifting higher. The momentum indicator RSI is positively placed.
Strategy: Buy
Target: Rs 320
Stop-Loss: Rs 290
ICICI Bank | CMP: Rs 1,336.5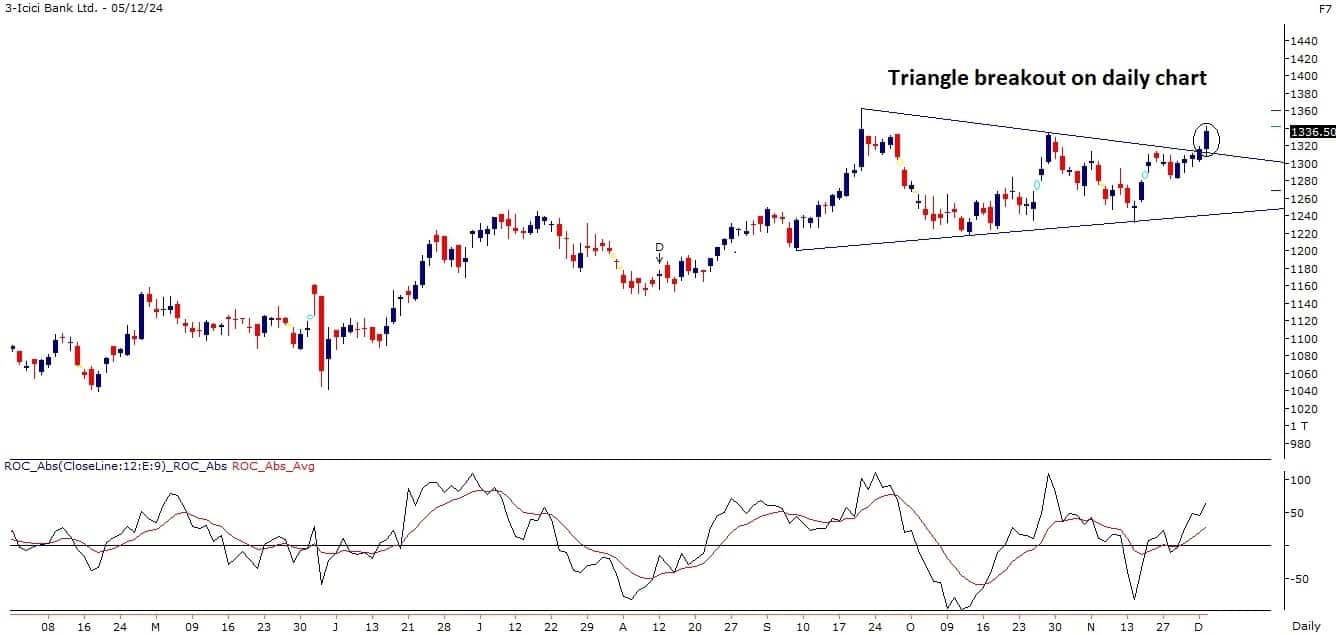
ICICI Bank has given a narrow range breakout on the monthly chart and a triangle breakout on the daily scale. It is continuously forming higher highs and higher lows over the past four trading sessions. The Rate of Change indicator has turned up, which may support the upmove.
Strategy: Buy
Target: Rs 1,400
Stop-Loss: Rs 1,300
Drumil Vithlani, Technical Research Analyst at BonanzaAnand Rathi Wealth | CMP: Rs 4,383.15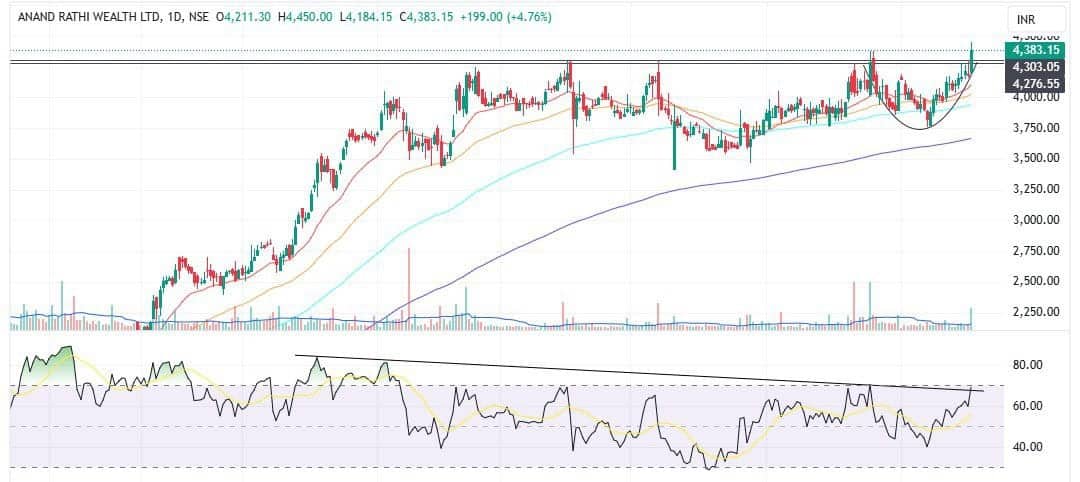
Anand Rathi Wealth has recently experienced a breakout from a rounding pattern on the daily chart, indicating a potential uptrend. This pattern is widely recognized as a bullish signal, suggesting a likely increase in the stock's price. The surge in volume during the last trading session reflects heightened buying interest, which reinforces the stock's positive outlook. Additionally, the momentum indicator RSI is positioned above the key moving average (14-period SMA), supporting the price action.
Strategy: Buy
Target: Rs 4,650
Stop-Loss: Rs 4,273
Skipper | CMP: Rs 614.85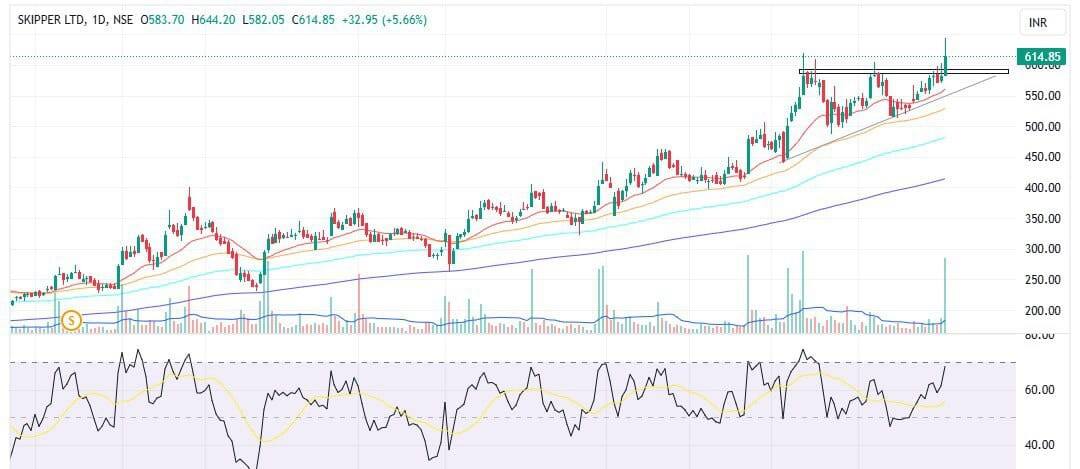
On the daily timeframe, Skipper has experienced a pattern called an ascending triangle, signaling a potential continuation of the uptrend. The breakout is confirmed above Rs 588-590 levels, and in the last two trading sessions, above-average volume indicates rising investor interest and confidence in the stock. Additionally, the closing above all major EMAs is a classic bullish signal that suggests strengthening upward momentum. The momentum indicator RSI is placed above 60, reflecting strong buying interest, which could drive the stock’s price higher in the near term.
Strategy: Buy
Target: Rs 650
Stop-Loss: Rs 599
Greaves Cotton | CMP: Rs 198.59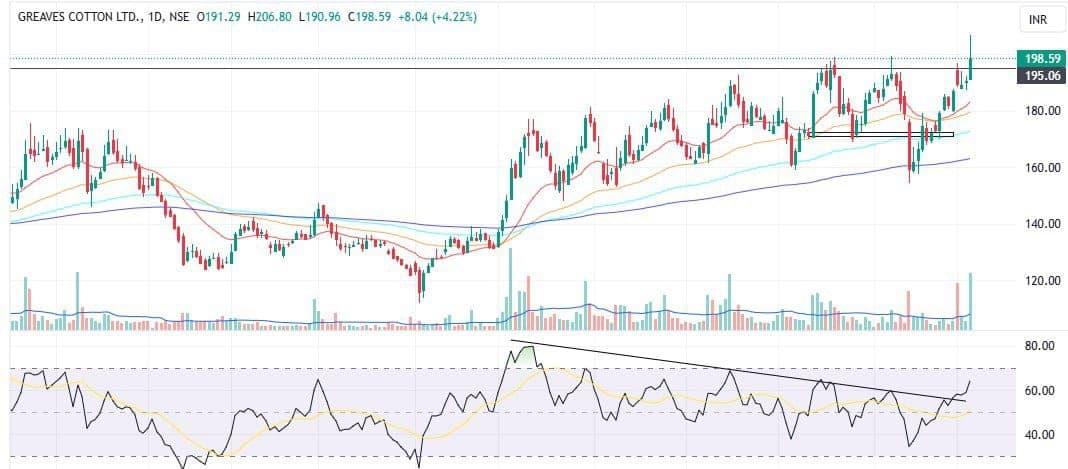
On the daily chart, Greaves Cotton has demonstrated a breakout above a key resistance level accompanied by a noticeable increase in volume, signaling strong buyer dominance. The stock's robust closing near its intraday high underscores the prevailing positive sentiment and bullish price action. Additionally, the recent failure of a double-top pattern indicates a bear trap, further validating the stock's resumption of its upward trajectory. The price is comfortably trading above key EMAs, reflecting a sustained positive trend, while the upward slope of the slow EMA supports this bullish momentum.
Strategy: Buy
Target: Rs 215
Stop-Loss: Rs 190
Disclaimer: The views and investment tips expressed by investment experts on Moneycontrol.com are their own and not those of the website or its management. Moneycontrol.com advises users to check with certified experts before taking any investment decisions.Discover the latest Business News, Sensex, and Nifty updates. Obtain Personal Finance insights, tax queries, and expert opinions on Moneycontrol or download the Moneycontrol App to stay updated!
Find the best of Al News in one place, specially curated for you every weekend.
Stay on top of the latest tech trends and biggest startup news.


