


Equity benchmark indices had a strong rally, though there was some profit booking at higher levels, with the Nifty 50 climbing 1 percent on August 18, supported by strong market breadth. About 1,826 shares advanced, compared to 929 declining shares on the NSE. The positive trend is expected to continue, as technical and momentum indicators signaled a bullish bias. Below are some short-term trading ideas to consider:
Mehul Kothari, Senior Technical Analyst at Anand Rathi
United Spirits | CMP: Rs 1,307.5

United Spirits has undergone a sharp 21% correction from its recent peak and is currently trading just above the Rs 1,300 mark. Despite sustained selling pressure since early July 2025, the decline was not accompanied by significant volumes — a notable technical observation. The most striking anomaly occurred on July 25, when a large bearish candle formed on very low volumes, hinting at a potential exhaustion of selling momentum.
Since then, the stock has consistently held the Rs 1,280–1,300 support zone, which coincides with a key historical demand area. Furthermore, the daily RSI has exhibited bullish divergence, indicating the possibility of an impending reversal. Traders may consider entering long positions in the Rs 1,310–1,300 zone.
Strategy: Buy
Target: Rs 1,450
Stop-Loss: Rs 1,230
Hindustan Aeronautics | CMP: Rs 4,514.3

Hindustan Aeronautics (HAL) is showing promising technical signals, with a bullish divergence forming on the daily RSI near the 38.2% Fibonacci retracement level. This critical zone also aligns with the S3 Camarilla monthly pivot and the 200-day exponential moving average (DEMA), enhancing its significance as a strong support area. The confluence of these technical factors indicates potential for an upward reversal. Traders may consider entering long positions in the Rs 4,525–4,500 zone.
Strategy: Buy
Target: Rs 5,000
Stop-Loss: Rs 4,300
Container Corporation of India | CMP: Rs 537.8

Container Corporation of India has found support at a confluence of crucial technical levels, improving the chances of a near-term recovery. A Bullish Bat harmonic pattern has emerged, which is a strong reversal signal when it aligns with key supports. Adding conviction, the stock formed a hammer candle on August 7 with heavy volumes, indicating strong buying interest at lower levels.
The RSI has also shaped a sharp V-shaped reversal from the oversold zone, highlighting renewed bullish momentum. These signals together suggest the stock is primed for a rebound in the short term, provided it holds above support levels. Traders may consider entering long positions in the Rs 540–535 zone.
Strategy: Buy
Target: Rs 595
Stop-Loss: Rs 510
Vidnyan S Sawant, Head of Research at GEPL Capital
Blue Star Company | CMP: Rs 1,915.7

Blue Star Company is exhibiting a strong constructive structure, maintaining a series of higher highs and higher lows on the higher time frame, highlighting sustained buying interest and positive sentiment. On the weekly chart, the stock has broken out of a descending trendline with a gap-up move, reinforcing bullish conviction. Moreover, it continues to trade comfortably above the 13- and 26-week EMAs, a setup that typically indicates robust medium-term momentum.
Strategy: Buy
Target: Rs 2,265
Stop-Loss: Rs 1,850
Mahindra and Mahindra | CMP: Rs 3,383.1

Mahindra and Mahindra (M&M) has registered a breakout from an Inverted Head & Shoulder pattern, confirming a strong bullish reversal. The stock has also scaled a fresh lifetime high, underscoring its relative strength and clear outperformance against the broader market. On the momentum front, the RSI continues to trend upward across all time frames, firmly sustaining above the 60 mark, which validates the presence of strong bullish momentum. Additionally, the stock is trading well above its key moving averages, reflecting sustained buying interest and further strengthening the bullish outlook.
Strategy: Buy
Target: Rs 3,725
Stop-Loss: Rs 3,260
Avenue Supermarts | CMP: Rs 4,558
Avenue Supermarts (DMart) has registered a consolidation breakout in the latest week, a pattern that had been developing since April 2025, reflecting a strengthening positive undertone. On the daily chart, the stock continues to uphold its higher high–higher low formation while sustaining above the 12-day EMA. This move is further reinforced by a noticeable surge in volumes above the 20-day average, highlighting strong participation behind the breakout. Additionally, the MACD remains in buy mode, confirming sustained bullish momentum and signaling potential for further upside.
Strategy: Buy
Target: Rs 5,100
Stop-Loss: Rs 4,400
TVS Motor Company | CMP: Rs 3,219.7

TVS Motor Company is demonstrating a bullish polarity shift, with the previous resistance zone of September 2024 now acting as a strong support base. On the weekly chart, the stock has confirmed a rounding bottom breakout at record highs, signaling a firmly established uptrend supported by consistent institutional participation.
It remains well-positioned above the 5-, 12-, 25-, and 50-week EMAs, emphasizing the strength of the prevailing trend and minimizing downside risk. Furthermore, the MACD’s sustained presence in positive territory reinforces the bullish outlook, indicating that any corrective moves are likely to attract renewed buying interest.
Strategy: Buy
Target: Rs 3,565
Stop-Loss: Rs 3,050
Riyank Arora, Technical Analyst at Mehta Equities
National Securities Depository | CMP: Rs 1,207.8
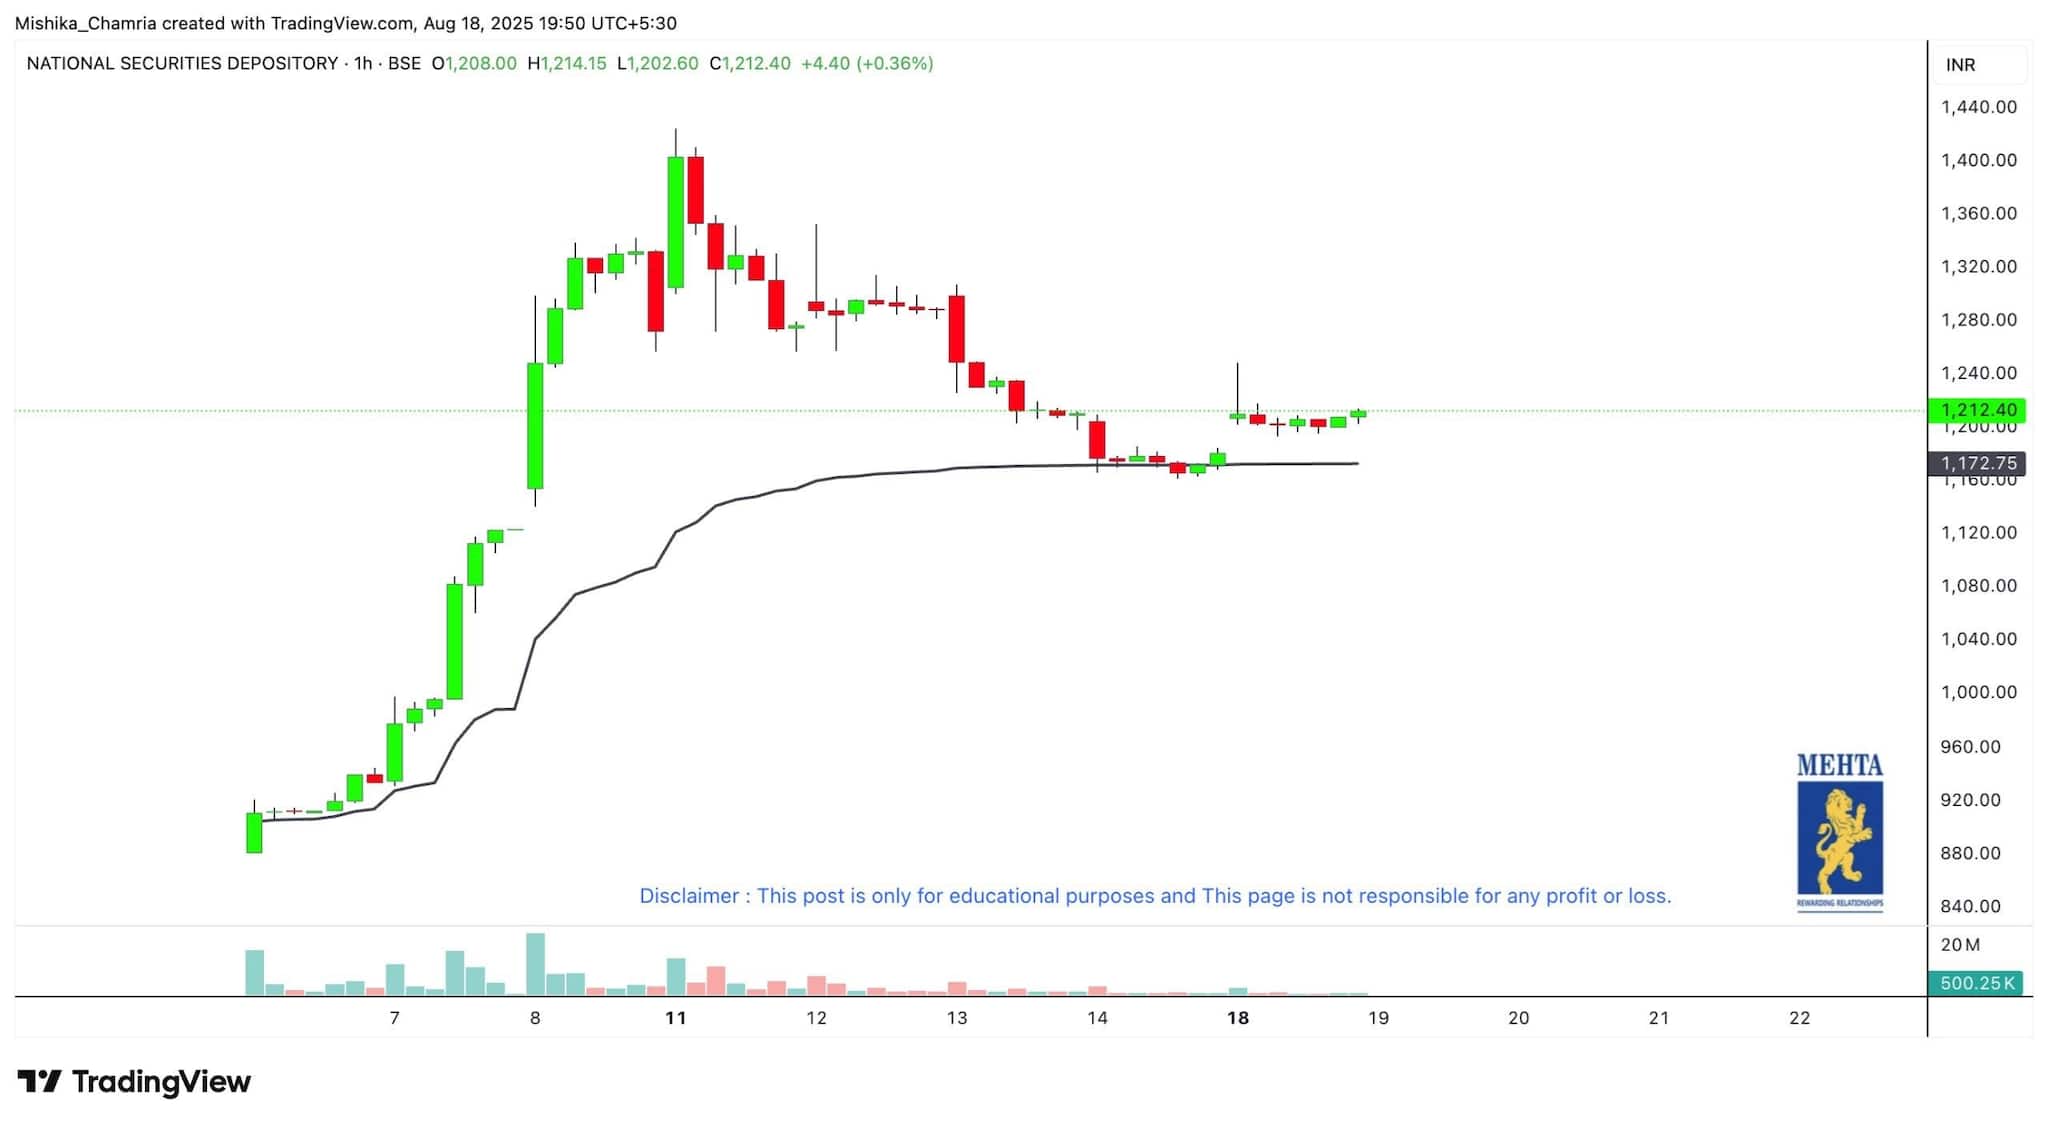
NSDL took support near its anchor VWAP (volume-weighted average price) mark of Rs 1,175 and is now showing signs of reversal from lower levels. The stock has been consolidating well around this key support zone, and rising volumes suggest strength is returning. This setup indicates the stock could resume its uptrend with potential upside towards Rs 1,300 and Rs 1,400. To manage risk, traders should keep a strict stop-loss near Rs 1,150, as a move below this could weaken the trend.
Strategy: Buy
Target: Rs 1,300, Rs 1,400
Stop-Loss: Rs 1,150
Maruti Suzuki India | CMP: Rs 14,068

Maruti broke out above its all-time high resistance with a strong gap-up on the weekly charts. This breakout signals strength, supported by rising volumes and a positive trend. RSI (14) is at 81, reflecting strong momentum, which can help push the stock towards Rs 15,000 and above in the short term. Traders should remain cautious and keep a strict stop-loss at Rs 13,500 to protect capital, as any reversal below this level could lead to further downside pressure.
Strategy: Buy
Target: Rs 15,000
Stop-Loss: Rs 13,500
Multi Commodity Exchange of India | CMP: Rs 8,309

MCX gave a breakout above the anchor VWAP resistance of Rs 8,250, showing strong momentum and renewed buying interest. The stock now looks set for an upward move with a potential target near Rs 9,000. On the daily timeframe, RSI (14) is around 56, suggesting healthy momentum and room for further upside. A strong support lies at Rs 8,100, which should be kept as a strict stop-loss to manage risk effectively. Overall, the trend remains positive with scope for higher levels.
Strategy: Buy
Target: Rs 9,000
Stop-Loss: Rs 8,100
Disclaimer: The views and investment tips expressed by investment experts on Moneycontrol.com are their own and not those of the website or its management. Moneycontrol.com advises users to check with certified experts before taking any investment decisions.
Discover the latest Business News, Sensex, and Nifty updates. Obtain Personal Finance insights, tax queries, and expert opinions on Moneycontrol or download the Moneycontrol App to stay updated!

Find the best of Al News in one place, specially curated for you every weekend.
Stay on top of the latest tech trends and biggest startup news.


