


The market stayed in the red for the fifth straight week ended August 25, as bears continued to rule Dalal Street, but took support at 19,200-19,250, which coincides with the 10-week EMA (exponential moving average). Also, there was a formation of small-bodied bearish candlestick pattern with a long upper shadow, which resembles an inverted hammer kind of pattern on the weekly charts, which is a bullish reversal pattern formed at the downtrend.
Experts foresee a rebound with resistance at 19,300-19,400 levels, followed by 19,500 levels in the coming session. In case the index breaks 19,200, then the correction can be seen up to the 19,000 mark.
The Nifty50 fell 44 points for the week to close at Rs 19,266, with above average volumes.
"The bears continued their dominance as the mid-week rally was decisively sold into, dragging the index towards the critical support zone. However, the positive development that could be seen from a technical point of view is the formation of an ‘inverted hammer’ on the weekly chart," Osho Krishan, Senior Analyst in Technical and Derivative Research at Angel One, said.
He feels if there are no global aberrations, then the market might see a rebound. On the levels front, he said a plunge below the bullish gap of 19,230-19,200 could disrupt the near-term view and the Nifty50 may re-test the 19,000 mark on the downside in the upcoming week.
On the higher end, 19,350-19,400 is expected to be an immediate hurdle, followed by major resistance at 19,500 in the comparable period, he feels.
Hence, he advised, short-term traders to stay abreast with global developments along with the mentioned technical levels for the current trading week.
For the positional traders, Amol Athawale, Vice-President of Technical Research at Kotak Securities, also said that 19,350 could be the trend decider level, above which the market could rebound till 19,450 and 19,575. On the other hand, selling pressure is likely to accelerate if the index trades below 19,230 and below that, the market could slip till 19,150-19,100, he feels.
Let's take a look at the top 10 trading ideas by experts for the next three-four weeks. Returns are based on the August 25 closing prices:
Expert: Jigar S Patel, senior manager - equity research at Anand Rathi
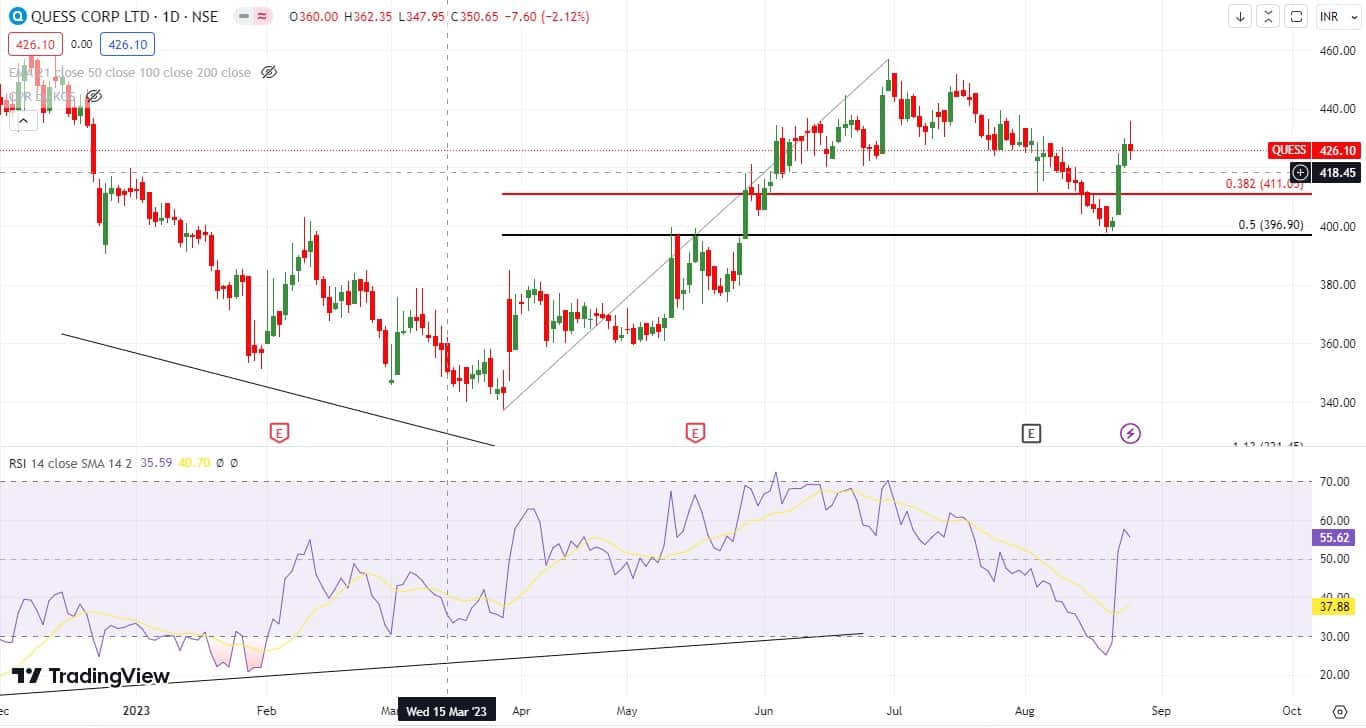
Quess Corp: Buy | LTP: Rs 426 | Stop-Loss: Rs 393 | Target: Rs 485 | Return: 14 percent
On August 22, the said counter made a Bullish Harami pattern exactly near 50 retracement of its previous up-move. Having said that during this pattern formation, the daily RSI (relative strength index) has formed a hidden bullish divergence (price retracing till 50 percent but RSI daily got oversold) which hints towards further bullish bias in the counter.
One can buy in the range of Rs 420-430 with an upside target of Rs 485 and a stop-loss of Rs 393 on a daily closing basis.
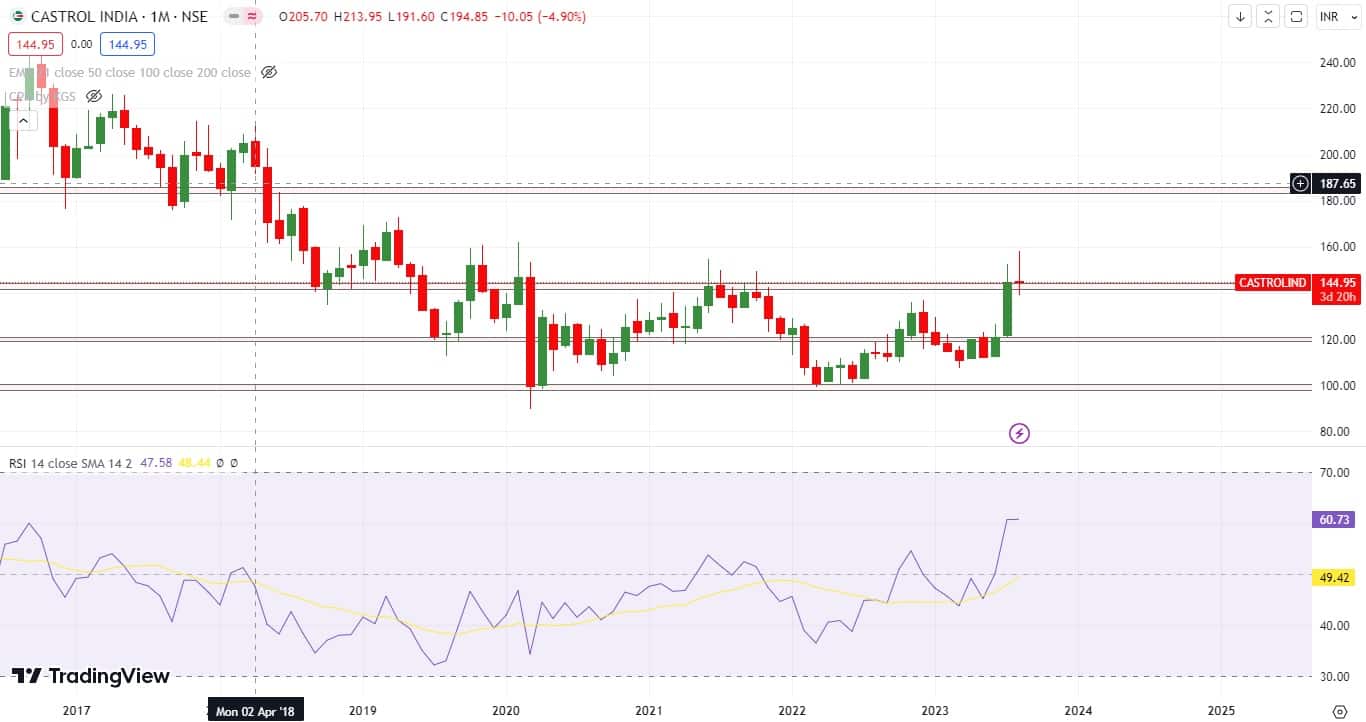
Castrol India: Buy | LTP: Rs 145 | Stop-Loss: Rs 135 | Target: Rs 170 | Return: 17 percent
Castrol India has been consolidating in the range of Rs 100- 150 for the last 3 years approximately. Recently it broke the range and sustained above Rs 150 levels. On the indicator front, the monthly MACD (moving average convergence divergence) has given a bullish cross near the zero line so the bias would be bullish.
One can buy Castrol in the range of Rs 144-148 for an upside target of Rs 170 and the stop-loss would be Rs 135 on a daily close basis.
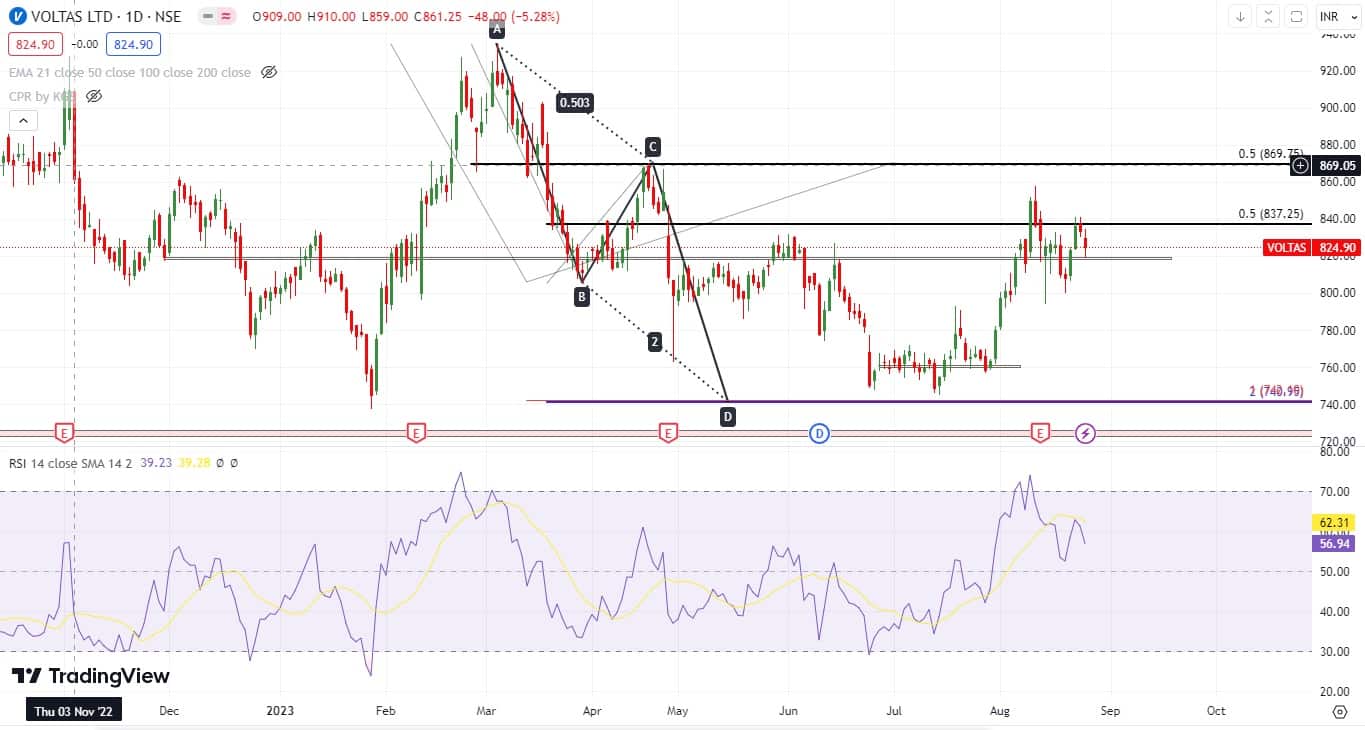
Voltas: Buy | LTP: Rs 825 | Stop-Loss: Rs 785 | Target: Rs 900 | Return: 9 percent
On a weekly scale, Voltas has formed a bullish AB=CD pattern near Rs 775-800 levels. After reversing from the said range, it has taken out its previous weekly swing high of Rs 830 levels.
Having said that, the weekly MACD has given a bullish cross near the zero line so the bias would be bullish. One can buy in the range of Rs 820-830 with an upside target of Rs 900 and the stop-loss would be Rs 785 on a daily closing basis.
Expert: Shrikant Chouhan, Head of Equity Research (Retail) at Kotak Securities
Narayana Hrudayalaya: Buy | LTP: Rs 1,037.7 | Stop-Loss: Rs 970 | Target: Rs 1,170-1,230 | Return: 18.5 percent
From June 2023 onwards, the stock has been experiencing a period of consolidation, fluctuating between Rs 1,070 and Rs 970. This consolidation has followed a rally from Rs 750 to Rs 1,070, which did not see a correction.
We believe that this time-based correction could potentially result in the stock rising to Rs 1,170 or even Rs 1,230 in the near future. As such, we suggest purchasing at current levels while maintaining a stop-loss at Rs 970, based on short-term averages.

RBL Bank: Buy | LTP: Rs 230 | Stop-Loss: Rs 210 | Target: Rs 275-320 | Return: 20 percent
Following its rise to Rs 220, the stock has continued to climb to Rs 250, and has been bolstered by solid base-building formations for a consecutive 5 weeks.
Its weekly close above Rs 220 suggests potential for hitting the Rs 275 and Rs 320 marks in the medium term. Given short term averages, purchasing is recommended, with a suggested stop-loss set at Rs 210.

Navin Flourine International: Buy | LTP: Rs 4,507 | Stop-Loss: Rs 4,200 | Target: Rs 4,900-5,200 | Return: 15 percent
From May 2023, the stock remained in a downtrend. The stock was at Rs 4900 in the month of May and touched a low of Rs 4,200 at the end of the month of July. However, a volume-based reversal formation helped the stock to withstand the selling pressure towards Rs 4,400-4,500 levels.
Technically, we believe the stock is ready to witness an upward move towards Rs 4,900 to Rs 5,200 levels in the medium term. It is a buy at current levels and at Rs 4,350. However, for this, we need to place stop-loss at Rs 4,200 levels.

Expert: Viraj Vyas, CMT, technical & derivatives analyst - institutional equity at Ashika Stock Broking
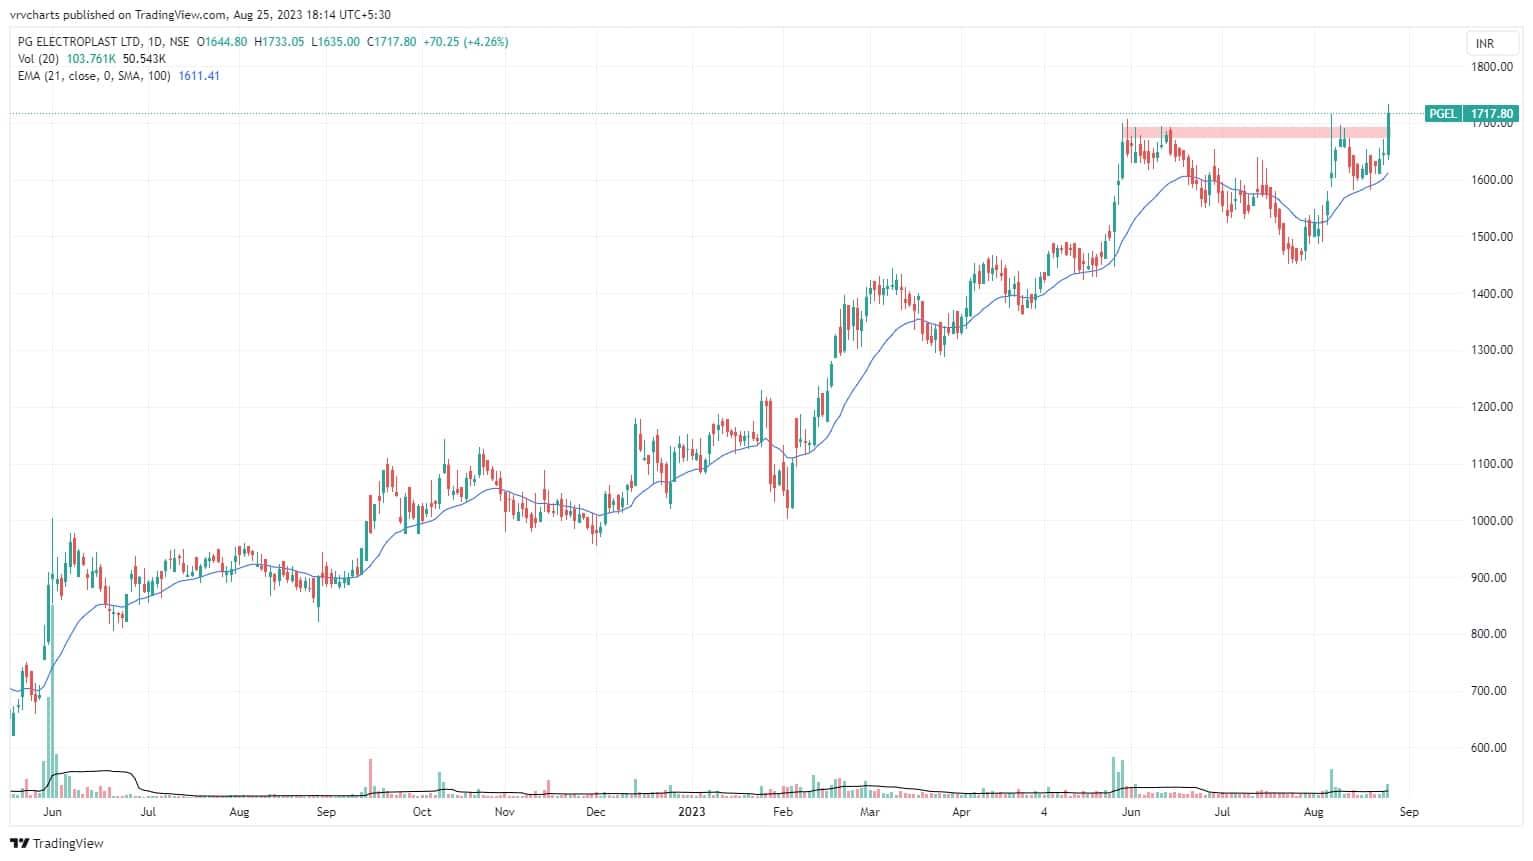
PG Electroplast: Buy | LTP: Rs 1,717.8 | Stop-Loss: Rs 1,615 | Target: Rs 1,940 | Return: 13 percent
Since June 2022, the stock has been experiencing a robust uptrend, marked by consistent higher highs and higher lows. Notably, the stock's ascent from Rs 700 to Rs 1,700 levels has been well-supported by the 21-day EMA.
Although the stock briefly entered a minor consolidation phase recently, it managed to break out from this phase with compelling price action and above-average trading volumes.
It's worth noting that continuation breakouts like the one witnessed often lead to substantial rallies, as the primary trend regains momentum. This trend resurgence is expected to drive the stock further in the upward direction.
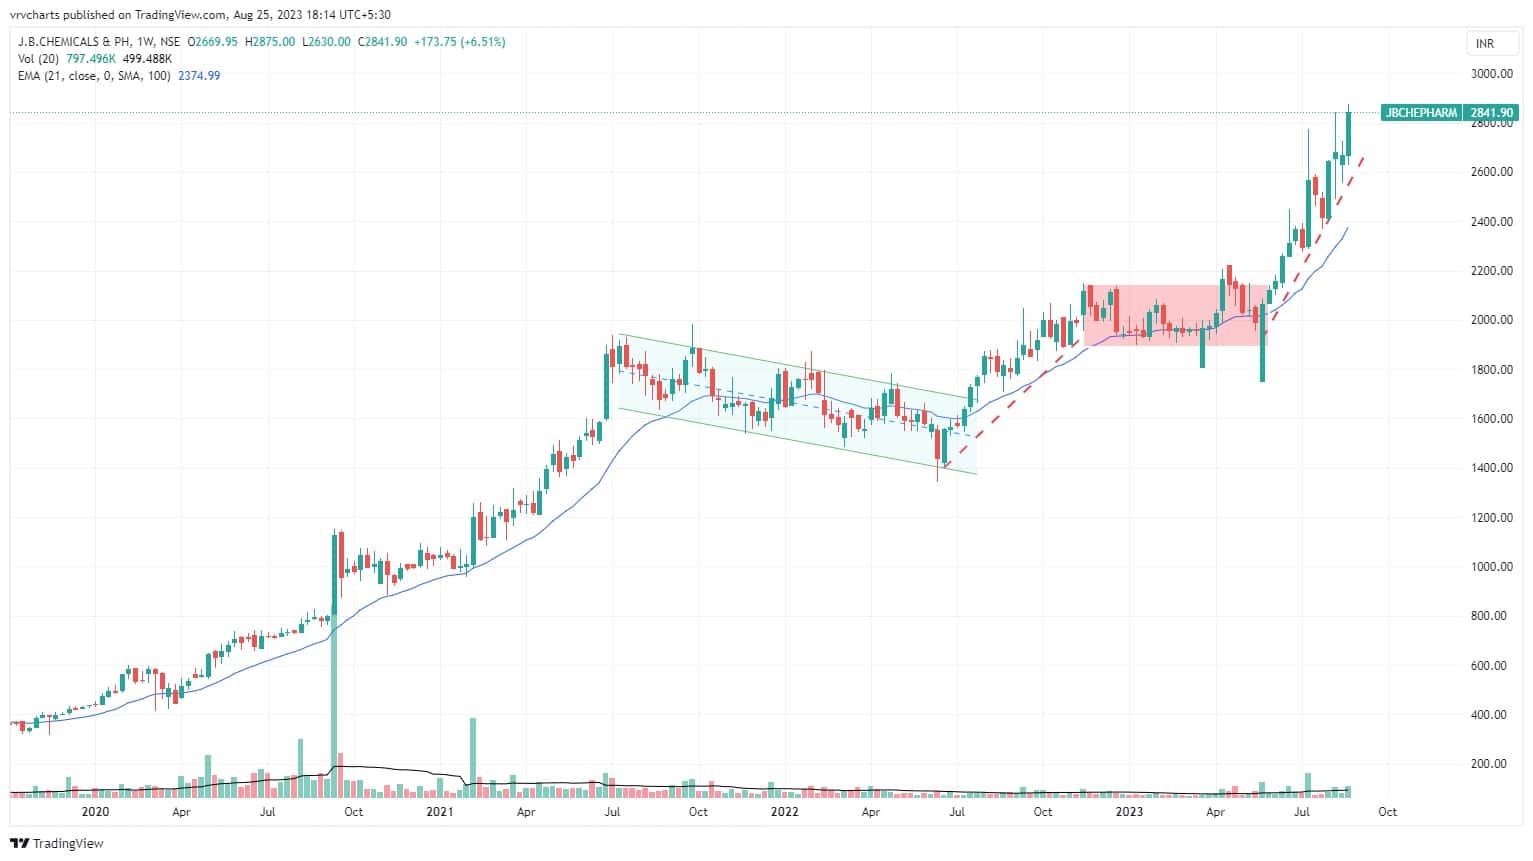
JB Chemicals and Pharmaceuticals: Buy | LTP: Rs 2,842 | Stop-Loss: Rs 2,670 | Target: Rs 3,211 | Return: 13 percent
Since 2020, the stock has maintained a robust uptrend, consistently establishing higher highs and higher lows. Although a brief consolidation occurred between November 2022 and May 2023, the stock subsequently resumed its impulsive movement in line with the primary trend.
Notably, the stock's ability to achieve new highs stands out, particularly in a period when Nifty and other major indices are displaying signs of weakness. This dual dynamic illustrates both the stock's inherent strength and its relative outperformance compared to the benchmark.
A fresh all-time high accompanied by a new weekly high further underscores the stock's resilience and suggests that its strength is poised to persist in the upcoming weeks.
Expert: Mitesh Karwa, research analyst at Bonanza Portfolio
Century Plyboards: Buy | LTP: Rs 663.3 | Stop-Loss: Rs 622 | Target: Rs 740 | Return: 12 percent
The stock has seen breaking out of a downward sloping parallel channel pattern on the weekly timeframe with a bullish candlestick and is also trading above all its important EMAs (exponential moving average) which indicates bullish strength.
On the indicator front, the supertrend indicator is indicating a bullish continuation trend; the Ichimoku Cloud is also suggesting a bullish move as the price is trading above the conversion line, base line and cloud.
Momentum oscillator RSI (relative strength index 14) is at around 63 on the daily time frame indicating strength by sustaining above 50.
Observation of the above factors indicates that a bullish move in the stock is possible for target upto Rs 740. One can initiate a buy trade in between the range of Rs 660-666, with a stop-loss of Rs 622 on daily closing basis.
Fortis Healthcare: Buy | LTP: Rs 333.5 | Stop-Loss: Rs 310 | Target: Rs 375 | Return: 12 percent
Fortis has seen breaking out of an upwards sloping parallel channel pattern on the monthly timeframe and on the weekly timeframe. The stock has seen breaking out of a resistance zone which indicates bullish strength.
On the indicator front the momentum oscillator RSI (14) is at around 57 showing strength by sustaining above 50. The supertrend indicator is also indicating a bullish continuation which supports the bullish view. The Ichimoku Cloud is also suggesting a bullish move as the price is trading above the conversion line, base line and cloud.
Observation of the above factors indicates that a bullish move in Fortis is possible for target upto Rs 375. One can initiate a buy trade in between the range of Rs 330-333, with a stop-loss of Rs 310 on daily closing basis.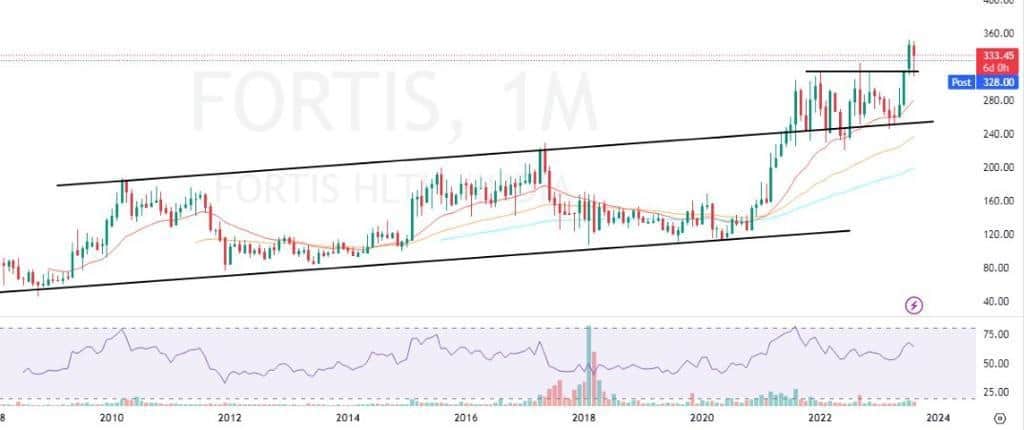
Disclaimer: The views and investment tips expressed by investment experts on Moneycontrol.com are their own and not those of the website or its management. Moneycontrol.com advises users to check with certified experts before taking any investment decisions.
Discover the latest Business News, Sensex, and Nifty updates. Obtain Personal Finance insights, tax queries, and expert opinions on Moneycontrol or download the Moneycontrol App to stay updated!
Find the best of Al News in one place, specially curated for you every weekend.
Stay on top of the latest tech trends and biggest startup news.


