


The Monetary Policy Committee of the Reserve Bank of India on February 8 raised the repo rate by 25 bps to 6.5 percent with a 4:2 majority.
India's headline inflation, excluding vegetables, has been rising well above the upper tolerance band and may remain elevated, especially with high core inflation pressures, though the consumer price inflation eased for the third straight month in December.
The rate hike decision was as per the most of expectations by market participants. The January CPI inflation is scheduled to be announced on February 14.
According to the MPC, inflation remains a major risk to the outlook. Hence, the rate-setting panel is of the view that further calibrated monetary policy action is warranted to keep inflation expectations anchored, break core inflation persistence and thereby strengthen medium-term growth prospects.
And, it decided to remain focused on withdrawal of accommodation to ensure that inflation remains within the target going forward, while supporting growth.
"Resilient high-frequency indicators and continued rate hikes by global central banks could have spurred the MPC action even as headline inflation has shown some signs of moderation. Rate hike of 25bps seems justified on the back of high persistent sticky core inflation - above 6 percent - to keep the inflation expectations anchored," Dhiraj Relli, MD and CEO at HDFC Securities, said.
The monetary policy acts with lags, it may take three-four quarters for the policy rate to be transmitted to the real economy, and the peak effect may take as long as five-six quarters, Relli feels.
After frontloaded rate hikes since May 2022, he said there could be a strong case now to put a brake on monetary tightening. Further rate hikes beyond 6.5 percent could pose an unwarranted risk to economic growth unless inflationary pressures re-emerge, he feels.
The market has reacted positively to the policy statement, with the BSE Sensex rising 376 points to 60,662, and the Nifty50 jumping 133 points to 17,854, at 1:02pm.
The Reserve Bank of India lowered its CPI inflation forecast for FY23 to 6.5 percent from 6.7 percent and sees 5.3 percent for FY24.
On the growth front, real GDP growth is estimated by the RBI at 6.4 percent for FY24 and the same has been raised to 7 percent for FY23 from 6.8 percent earlier, making India one of fastest growing economies.
"The risk of over-tightening always exists, however, we believe growth over inflation will take the centre stage for the RBI as the world passes through a sluggish growth phase, while the US and Europe continue with measured quantitative tightening," of Kunal Valia, Chief Investment Officer - Listed Investments at Waterfield Advisors, said.
The rate hike is going to add to the cost of capital and loans are going to become dearer, he feels.
Follow LIVE updates of the RBI MPC monetary policy announcement here
We have collated a list of rate-sensitive stocks that experts say can give healthy return over the next three-six months. Returns are calculated based on the closing price of February 7.
Expert: Viraj Vyas, Technical & Derivatives Analyst - Institutional Equity at Ashika Stock Broking
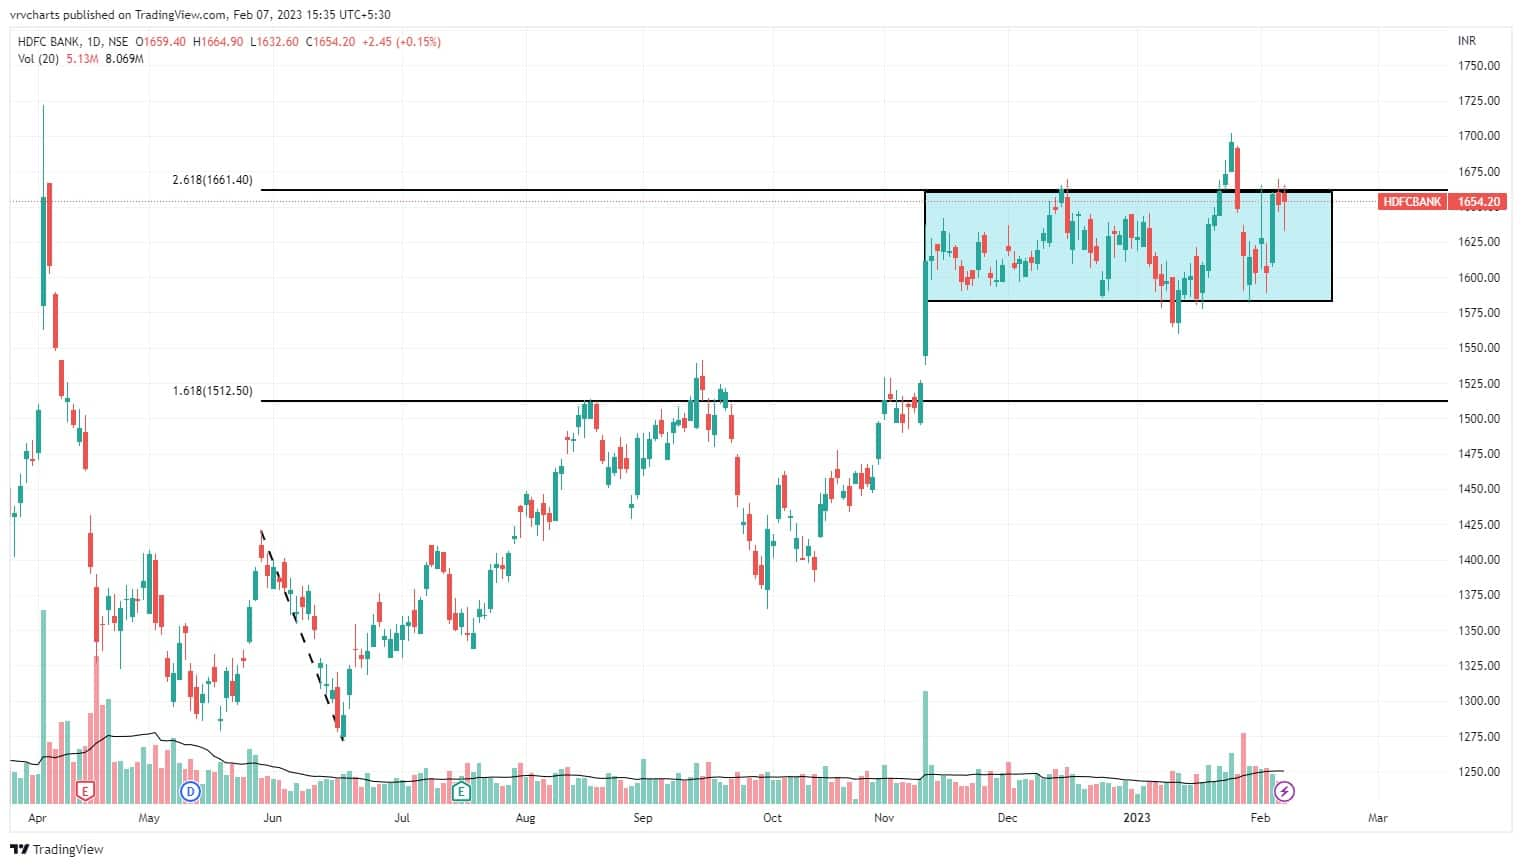
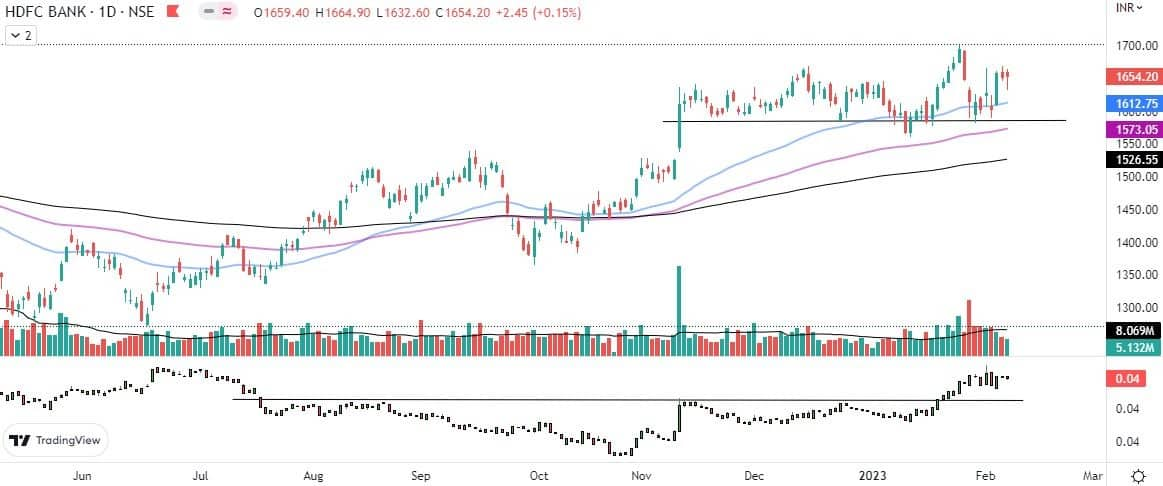
HDFC Bank: Buy | LTP: Rs 1,654 | Stop-Loss: Rs 1,565 | Target: Rs 1,800 | Return: 9 percent
After the strong spike in price seen in the second week of November 2022, the stock has since consolidated and is showing signs of accumulation.
A move beyond Rs 1,670-1,680 is likely to spark further bullish momentum towards life highs. On the weekly chart, the stock appears to have formed a high and tight flag which is bullish continuation pattern.
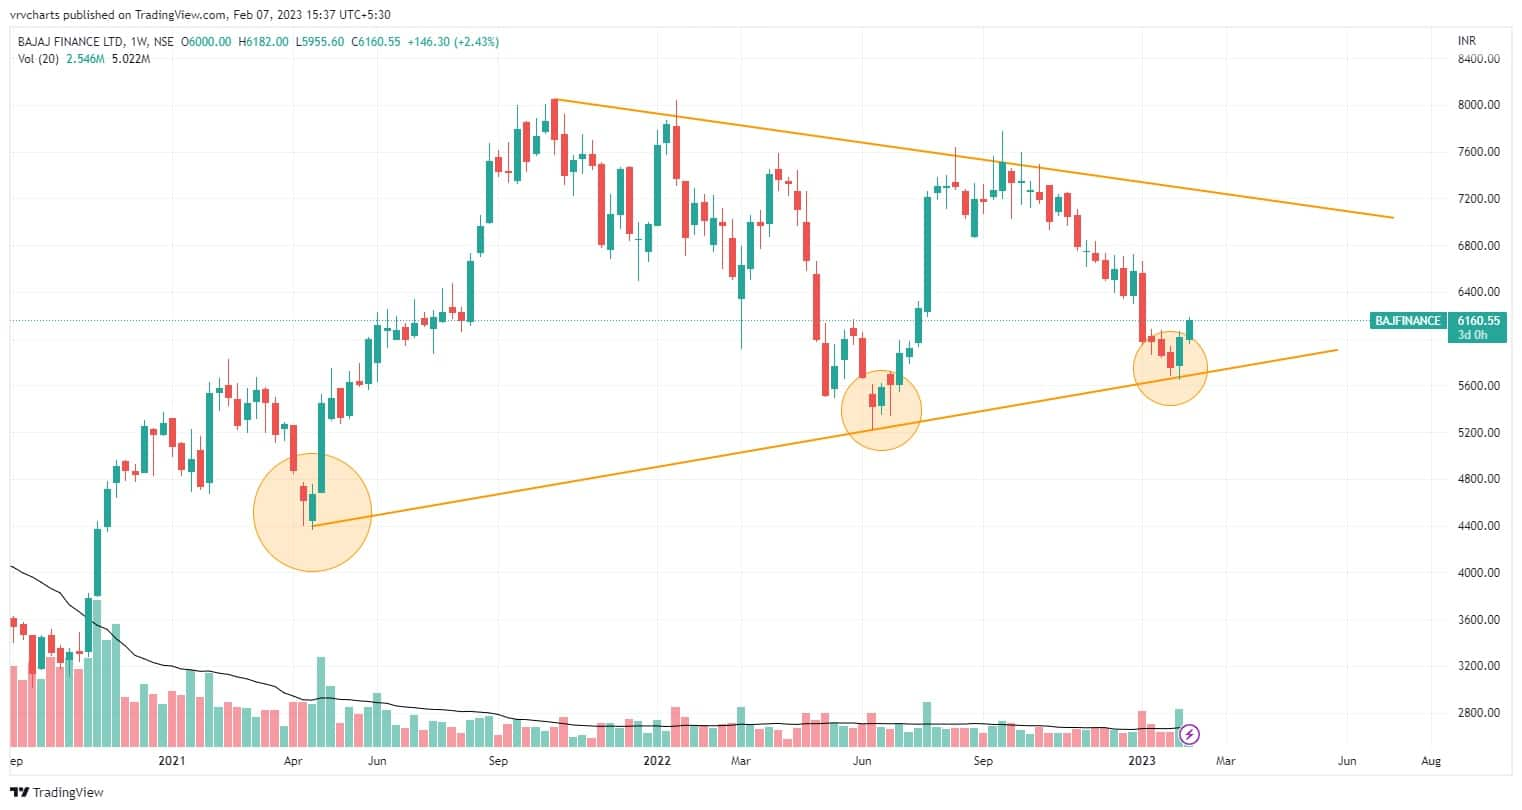
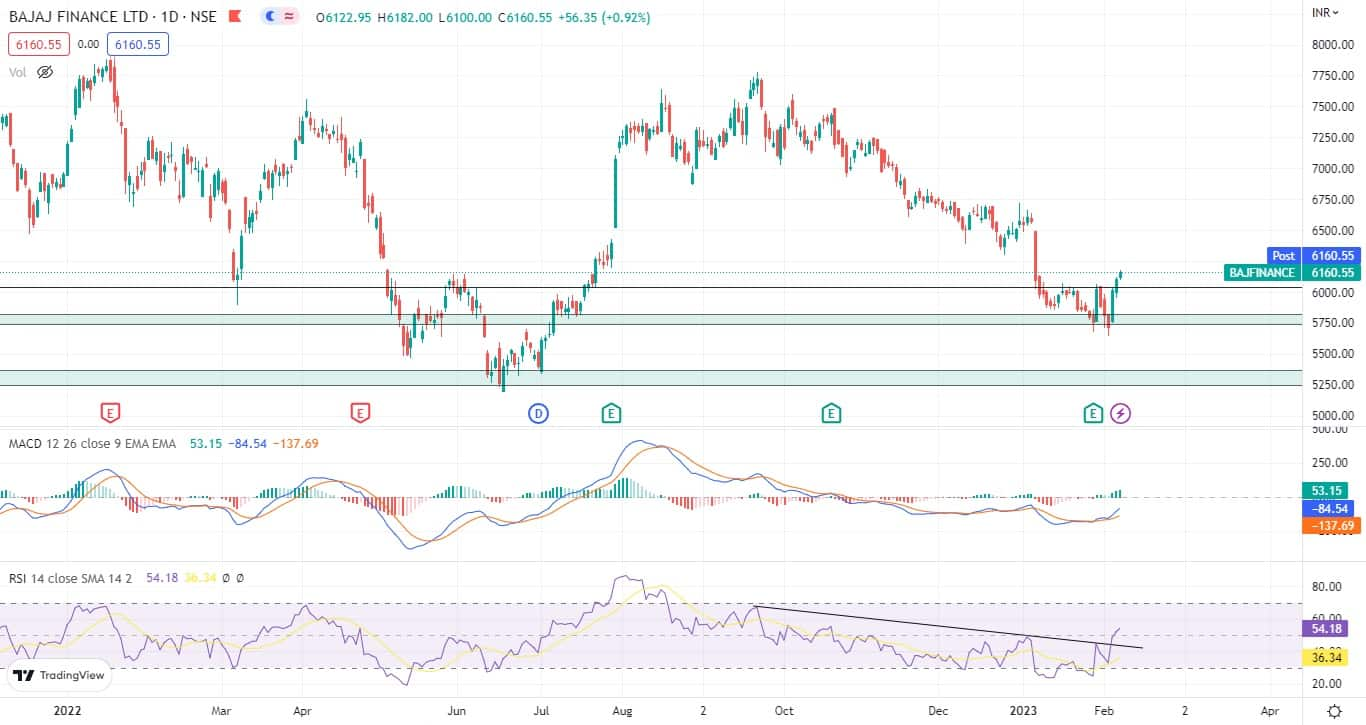
Bajaj Finance: Buy | LTP: Rs 6,160 | Stop-Loss: Rs 5,830 | Target: Rs 6,750 | Return: 10 percent
On the daily timeframe, the stock is trading above its 21-day EMA (exponential moving average). On the weekly chart, stock is consolidating in a triangle pattern since April 2021.
The stock has rebounded fairly well after touching the upward sloping trendline. We expect the stock to behave in a similar manner and move towards a fresh supply zone.
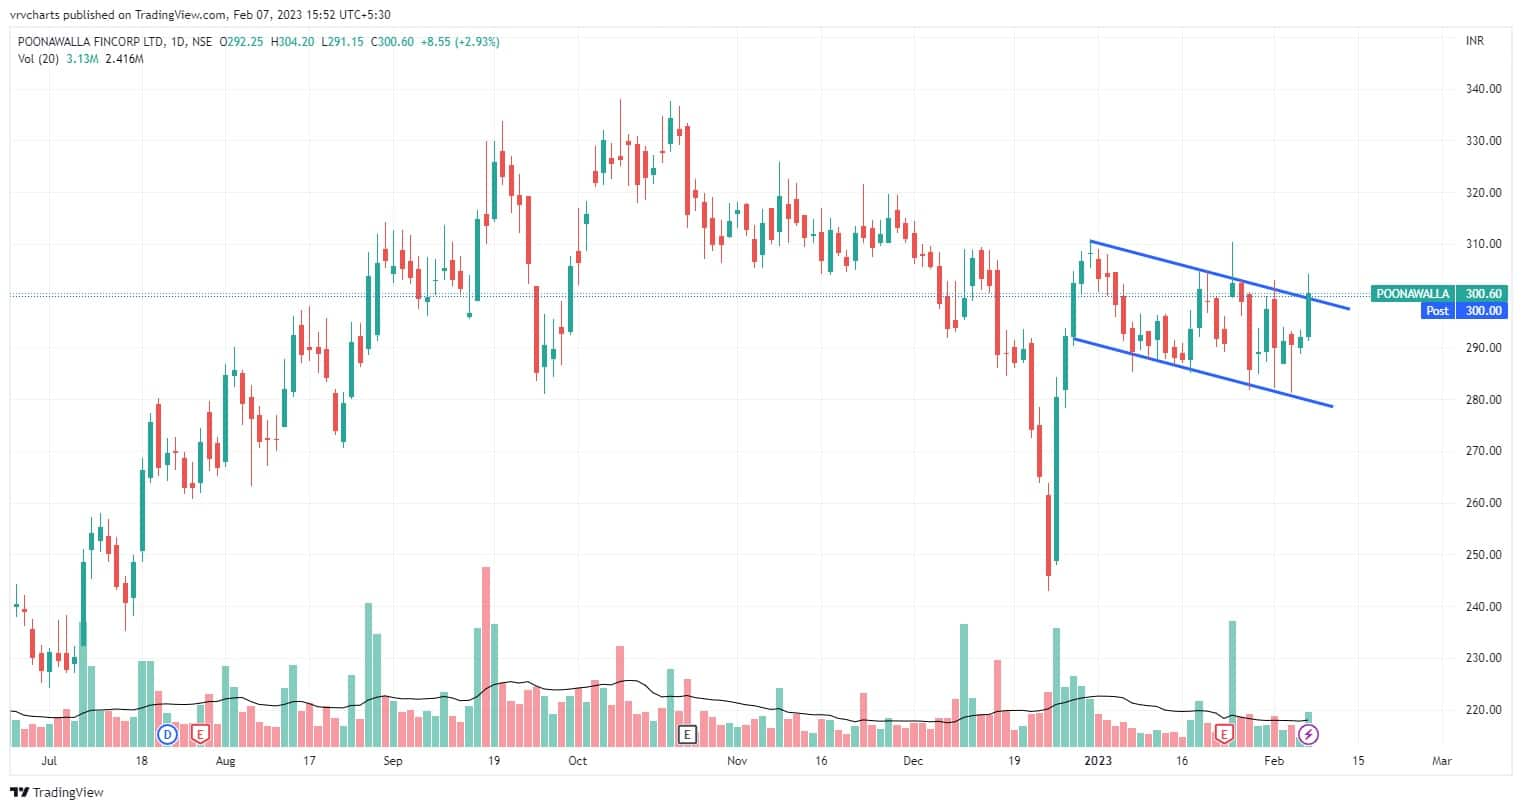
Poonawalla Fincorp: Buy | LTP: Rs 300 | Stop-Loss: Rs 285 | Target: Rs 340 | Return: 13 percent
After the V-shaped recovery seen during December 2022, the stock has broadly consolidated in a channel. Volume spikes were up on days when the stock was positive and strong volume participation was seen in the last session too.
The current pattern is similar to a 'Flag and Pole' which is a bullish continuation pattern.
Expert: Jigar S Patel, Senior Manager - Equity Research at Anand Rathi
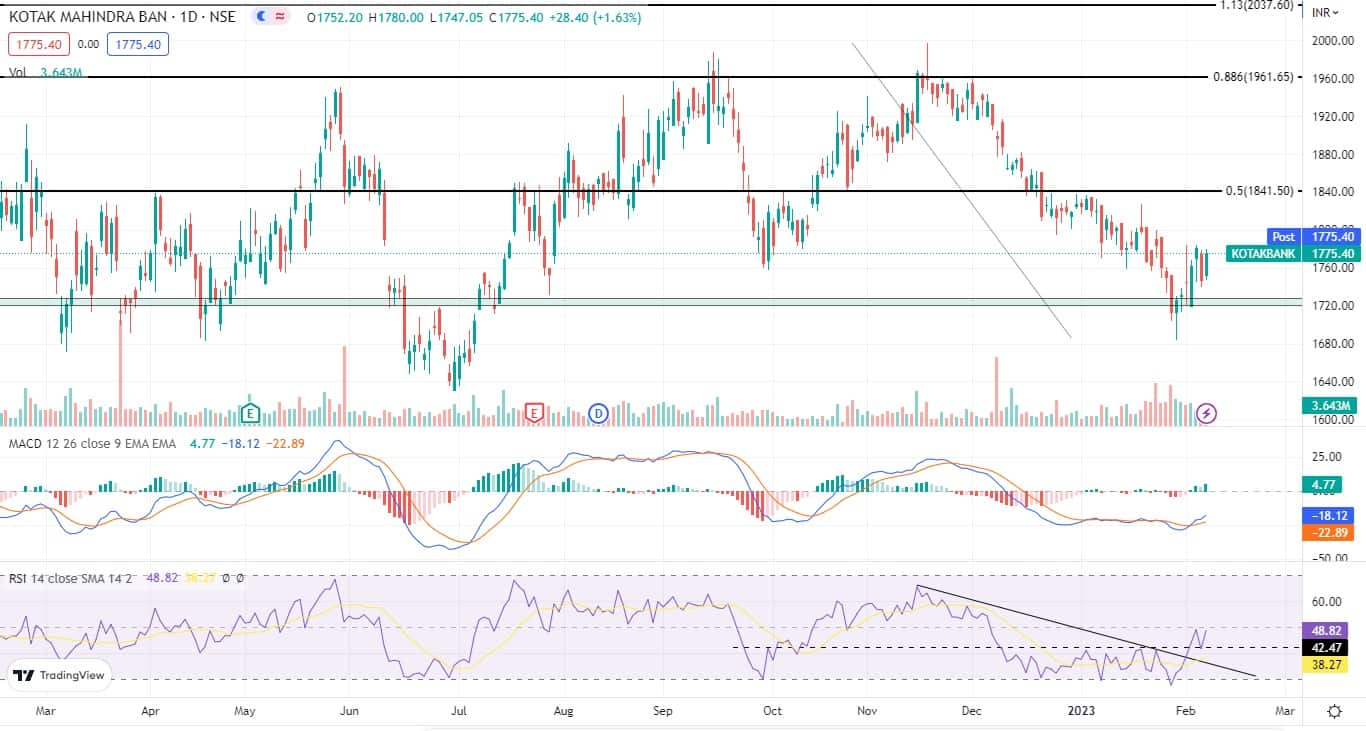
Kotak Mahindra Bank: Buy | LTP: Rs 1,775 | Stop-Loss: Rs 1,719 | Target: Rs 1,850 | Return: 4 percent
After making the top of Rs 1,997.55, the said counter has been continuously falling, resulting in a 16 percent correction. Currently, it has taken support in the zone of Rs 1,700-1,725 (which is also its historical support).
During the last few trading sessions, Kotak Bank has displayed multiple bullish candlesticks patterns (a couple of Doji's followed by a massive Bullish Engulfing structure) hinting at a possible bullish reversal.
From the indicator point of view, daily MACD (moving average convergence divergence) has made a bullish cross along with daily RSI (relative strength index) has violated its 3-month-old trendline thus confirming our bullish stance in Kotak Bank.
One can buy in the range of Rs 1,760-1,780 in small tranches and another around Rs 1,740-1,750 (if again tested), with upside target at around Rs 1,850 and with a stop-loss of Rs 1,719.
Bajaj Finance: Buy | LTP: Rs 6,160 | Stop-Loss: Rs 5,975 | Target: Rs 6,500 | Return: 5.5 percent
After making the top of Rs 7,778, the said counter has been relentlessly falling which resulted in a 27 percent cut in price. Looks like it has stabilized near Rs 5,800, which is a crucial support for coming to a few sessions.
During the last few trading sessions, the said counter has witnessed nice buying interest along with volume coming in. Also double bottom is formed around Rs 5,900 level accompanied by a bullish divergence on daily RSI which are hinting at a possible bullish reversal.
One can buy in the range of Rs 6,130-6,165. The upside target is expected around Rs 6,500, with a stop-loss of Rs 5,975/
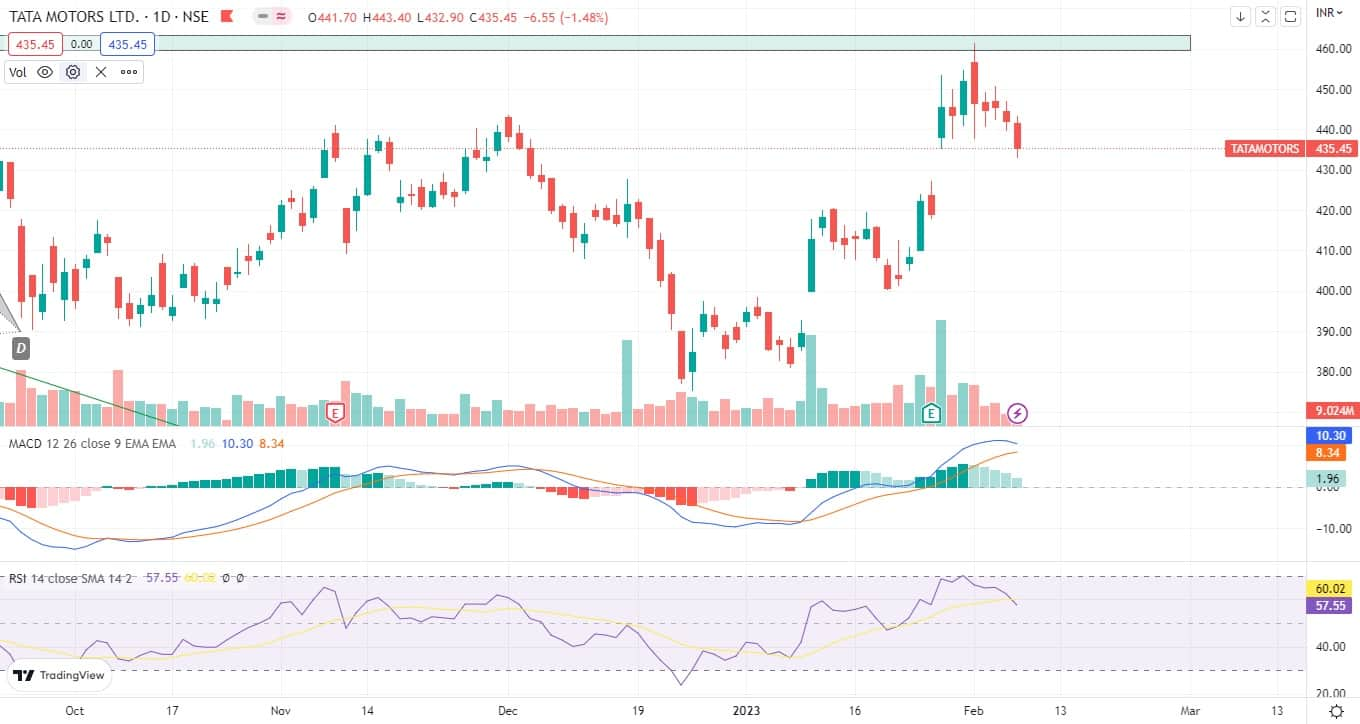
Tata Motors: Sell | LTP: Rs 435.45 | Stop-Loss: 455 | Target: Rs 415 | Return: 5 percent
Since last month, the said counter has been making a higher top and higher bottom which resulted in a whopping 22 percent return. One needs to be alert as of now because it has made a Dark Cloud Cover pattern followed by a trio of doji-like (refer to the chart) structures exactly at its historical resistance zone of Rs 455-460 which hints towards some profit in the coming few sessions.
On indicator front, daily MACD is overstretched along with daily RSI and has made an impulsive structure near 70 level which is a matter of concern and could be an early sign of bearishness in Tata Motors.
One should book profit in the range of Rs 435-440. Fresh buy is not advised as of now.
Expert: Vidnyan Sawant, AVP - Technical Research at GEPL Capital
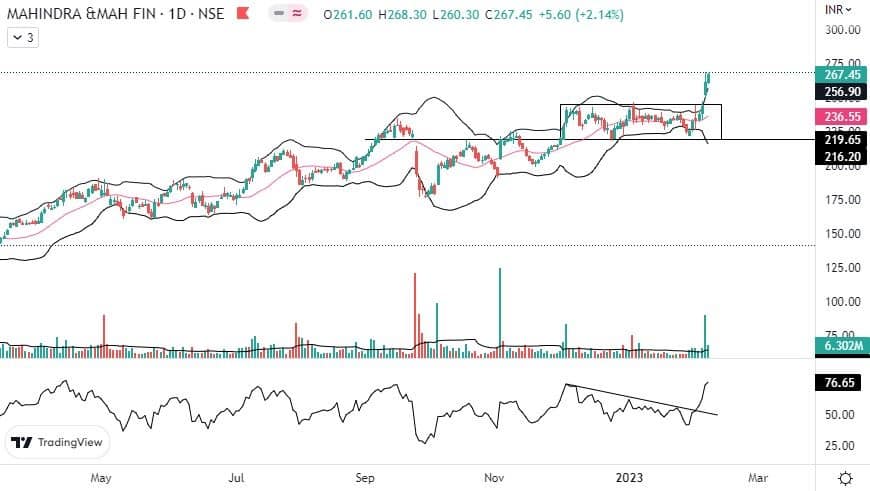
Mahindra & Mahindra Financial Services: Buy | LTP: Rs 267.45 | Stop-Loss: Rs 249 | Target: Rs 320 | Return: 20 percent
The stock is trading at a 52-week high, which tells that the stock already is in strong momentum.
A recent breakout from a rectangle pattern, along with a gap and increased trading volume, confirms the trend's continuation to the upside.
The opening of Bollinger bands on the daily timeframe suggests rising volatility in support of an upward move.
The RSI on the daily timeframe has also demonstrated a breakout, reflecting sustained momentum in the stock's prices.
Going ahead we expect the prices to move higher till the level of Rs 320, where the stop-loss must be Rs 249 on the closing basis.
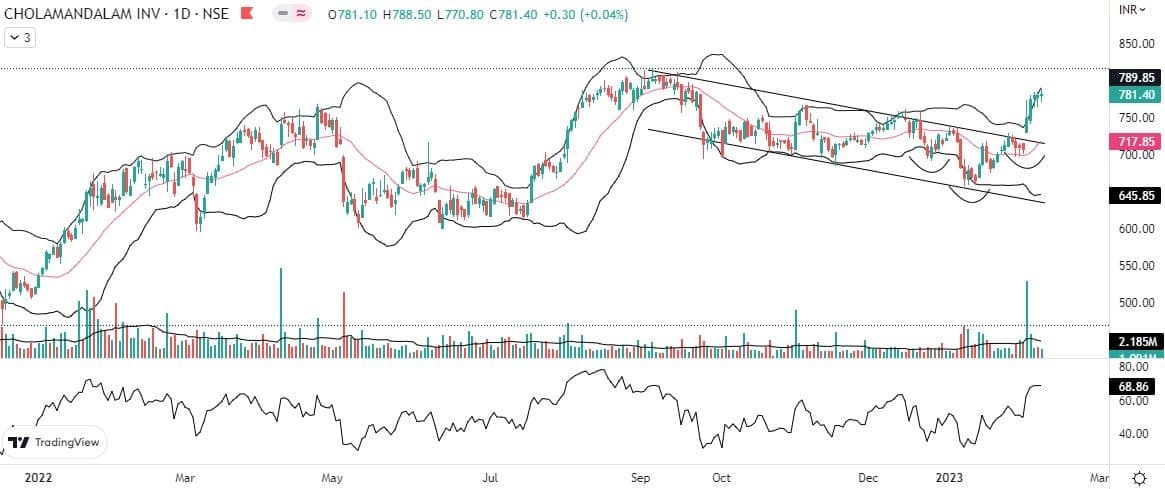
Cholamandalam Investment and Finance Company: Buy | LTP: Rs 781.40 | Stop-Loss: Rs 730 | Target: Rs 865 | Return: 11 percent
After September 2022, Cholamandalam Investment now has got into the formation of Higher Highs, Higher Lows. This shows the positive undertone of the prices.
On the daily time frame, the stock has given a bearish channel pattern breakout, which confirms the reversal.
The stock has given a breakout of the Inverse Head and Shoulder pattern on February 1, 2023 which points towards the beginning of the trend to the upside.
The breakout is confirmed as it is accompanied by huge volumes and a Gap.
The stock is hovering near Upper Bollinger band which illustrate the rising volatility of the prices.
RSI on the weekly timeframe as well as on the daily timeframe is sustaining above 50 levels which shows that the prices have strong momentum in it.
We recommend traders and investors to buy this stock for the target of Rs 865 where the stop-loss must be Rs 730 on the closing basis.
HDFC Bank: Buy | LTP: Rs 1,654.20 | Stop-Loss: Rs 1,550 | Target: Rs 1,780 | Return: 8 percent
The multi-month breakout in the ratio charts of HDFC Bank against its benchmark index Bank Nifty on January 18, 2023 illustrates the outperformance.
Furthermore, the presence of higher volumes during upward price movements and lower volumes during downward price movements suggests that the demand for the stock is stronger than the supply. This can be seen as a positive signal as it may indicate that the stock has strong buying interest and that price increases are likely to be sustained.
The stock is demonstrating favourable technical signals, as multiple key moving averages, including the 50, 100, and 200-day are below prices which confirms the up move.
RSI on the weekly timeframe is sustaining above 60 mark reflecting presence of momentum for potential up move.
We recommend traders and investors to buy this stock for the target of Rs 1,780 where the stop-loss must be Rs 1,550 the closing basis.
Expert: Jatin Gohil, Technical and Derivative Research Analyst at Reliance Securities
Power Finance Corporation: Sell | LTP: Rs 143 | Stop-Loss: Rs 168 | Target: Rs 105 | Return: 27 percent
The stock respected its prior highs (Rs 139 and Rs 154) connecting rising trendline, as it reversed after testing that line (Rs 162) and moved towards its 20-week EMA (Rs 133) quite rapidly. Later, the stock witnessed a pullback after testing its 20-week EMA.
Bearish divergence on its weekly RSI and negative cross-over on MACD signals that the stock may resume its down move, wherein a stable move below its 20-week EMA (Rs 134) will accelerate the negative momentum. This could drag the stock towards Rs 110-105 zone in the medium-term.
In case of any rebound, its prior high connecting rising trendline (Rs 168) will cap the up-move. Fresh short position can be initiated at current juncture and on rise for a desired action.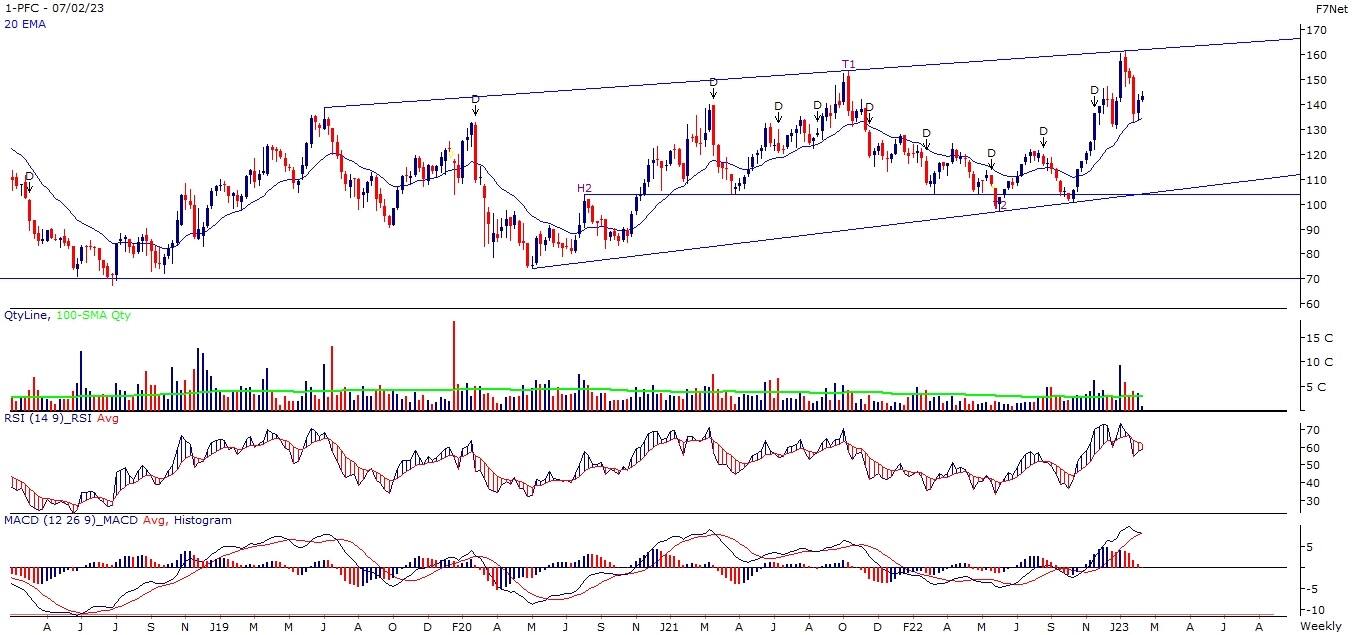
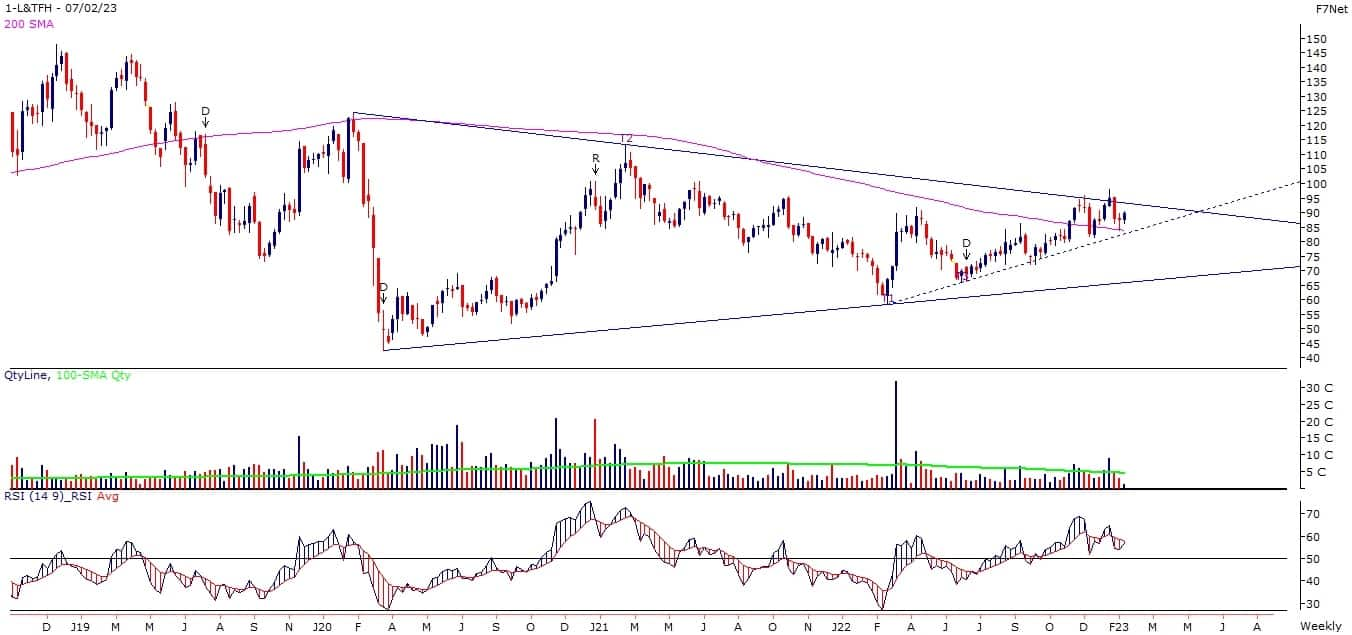
L&T Finance Holdings: Buy | LTP: Rs 90 | Stop-Loss: Rs 65 | Target: Rs 155 | Return: 73 percent
Since late-November 2022, the stock majorly ended last week above its long-term moving average (200-week SMA). We believe the stock is poised for a symmetrical triangle breakout, which could take it towards the breakout point of Rs 155 in the medium-term.
So far, the stock moved upwards taking support of its intermediate rising trendline. Its weekly RSI is positively poised above 50-mark since later-October 2022.
In case of major decline, the stock may find support around its lower band of symmetrical triangle pattern, which is currently placed at around Rs 65. Fresh long position can be initiated at current juncture and further after a breakout for an expected line of movement.
Disclaimer: The views and investment tips expressed by investment experts on Moneycontrol.com are their own and not those of the website or its management. Moneycontrol.com advises users to check with certified experts before taking any investment decisions.
Discover the latest Business News, Sensex, and Nifty updates. Obtain Personal Finance insights, tax queries, and expert opinions on Moneycontrol or download the Moneycontrol App to stay updated!
Find the best of Al News in one place, specially curated for you every weekend.
Stay on top of the latest tech trends and biggest startup news.


