
The benchmark indices rebounded after a day of profit booking, rising more than half a percent on September 3. Bulls continued to support the market breadth for the third straight day, with about 1,884 shares advancing compared to 894 declining shares on the NSE. The uptrend is expected to strengthen if the frontline indices decisively surpass short- and medium-term moving averages. Below are some short-term trading ideas to consider:
Nilesh Jain, Head- Equity Technical & Derivative Research at Centrum Broking
ITC Hotels | CMP: Rs 250.65
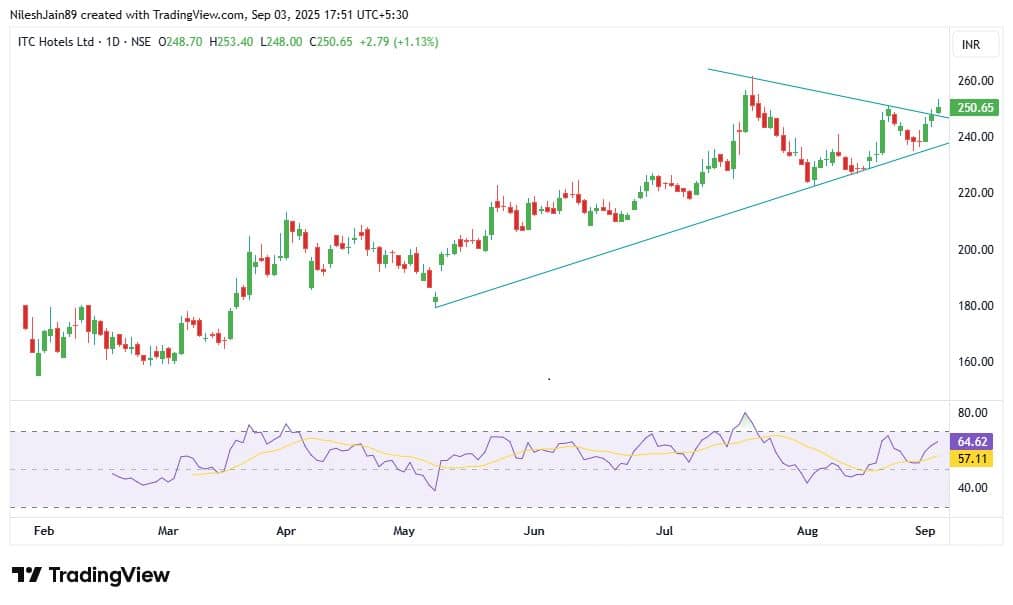
ITC Hotels has broken out of a symmetrical triangle pattern on the daily chart, indicating a potential trend continuation. A decisive break above Rs 255 could trigger a fresh rally towards new all-time highs. In the short term, we expect the stock to surpass resistance and move towards the Rs 270 level, supported by strong momentum post-breakout.
Strategy: Buy
Target: Rs 270
Stop-Loss: Rs 241
Coal India | CMP: Rs 389.8
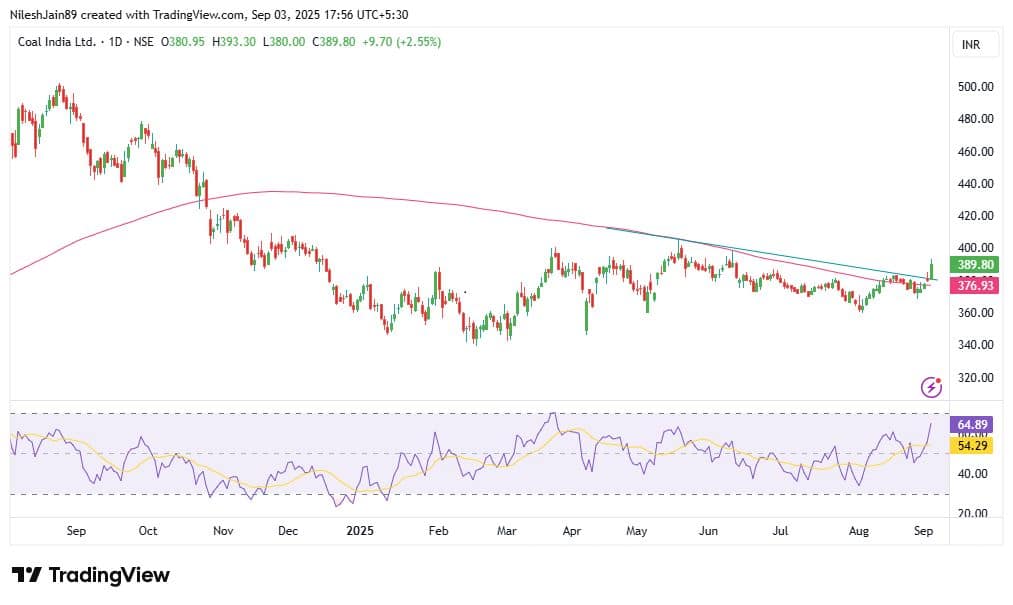
Coal India has formed a strong base and recently broke out from a falling trendline, supported by higher-than-average volumes, indicating strong buying interest. It is now trading comfortably above all key short-term and long-term moving averages, reflecting underlying strength in the trend. Furthermore, momentum indicators and oscillators on the daily chart have confirmed a bullish crossover, adding conviction to the bullish setup. Based on this technical structure, we anticipate the stock to move towards Rs 410 in the near term.
Strategy: Buy
Target: Rs 410
Stop-Loss: Rs 378
GMDC | CMP: 459.7
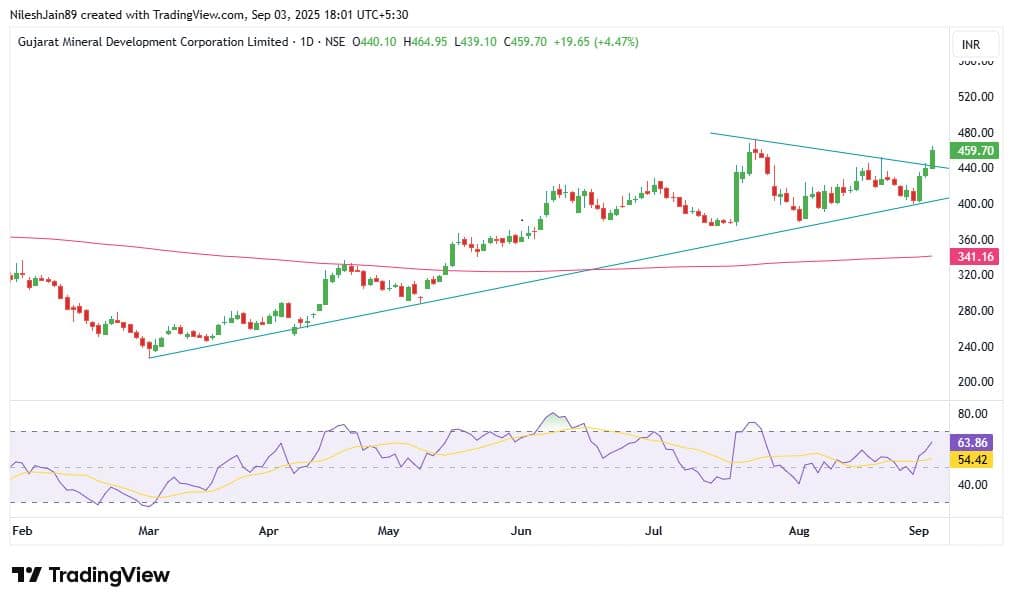
Gujarat Mineral Development Corporation has broken out of a symmetrical triangle pattern on the daily chart, suggesting a continuation of the uptrend. The breakout was supported by strong volume participation, indicating solid underlying strength in the stock. The pattern-based target is projected around Rs 501, with immediate support at Rs 440. Given these technical factors, the stock is likely to maintain its positive momentum in the short term, and a buy-on-dips approach is recommended.
Strategy: Buy
Target: Rs 501
Stop-Loss: Rs 440
Sudeep Shah, Head - Technical Research and Derivatives at SBI Securities
Jindal Steel and Power | CMP: Rs 1,028.35
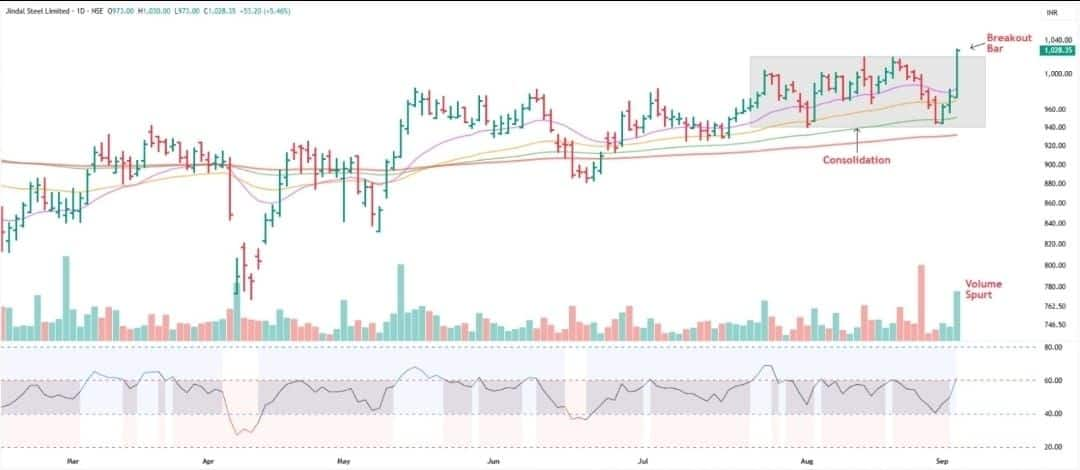
Jindal Steel has been moving in a Rs 1,022–942 range since the start of August. The stock broke out of the range and gave a horizontal trendline breakout on Wednesday. The breakout was also supported by robust volumes.
On September 1, the stock formed a piercing line candlestick pattern around its 100-day EMA and rose sharply since then. Momentum indicators are also supporting the bullish narrative.
The daily RSI crossed the 60 mark, and its upward trajectory reflects improving strength in price action. On the other hand, ADX—a key trend strength indicator—shows DI+ crossing above DI-, reinforcing the bullish outlook.
This confluence of price breakout, volume confirmation, and supportive trend and momentum indicators suggests that Jindal Steel is poised for further upside in the near term. Hence, we recommend accumulating the stock in the zone of Rs 1,025–1,035 levels.
Strategy: Buy
Target: Rs 1,100
Stop-Loss: Rs 999
Pondy Oxides & Chemicals | CMP: Rs 1,165.5
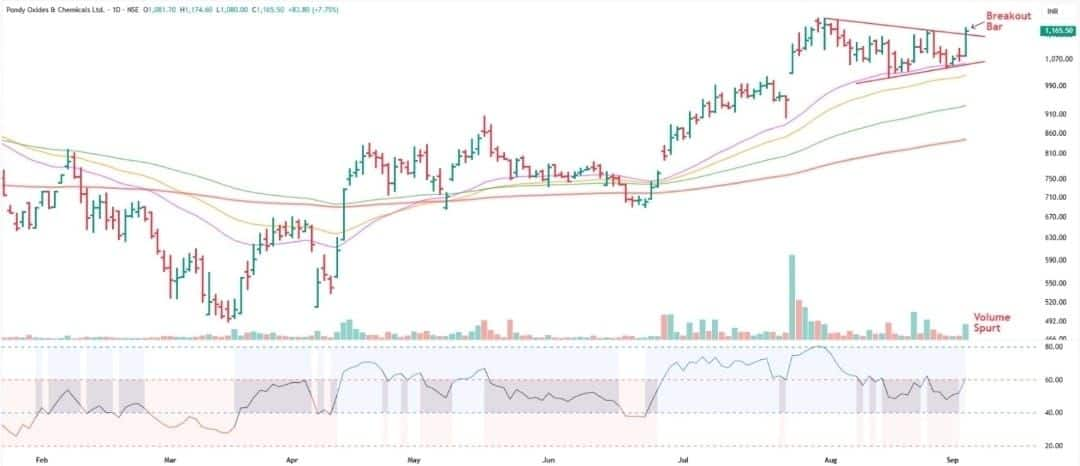
Pondy Oxides marked a high of Rs 1,209 on July 31 and thereafter witnessed a throwback. During this period, volume activity was mostly below average. The stock tested its 34-day EMA multiple times, found support, and formed a strong base, suggesting accumulation at lower levels.
On Wednesday, the stock gave a symmetrical triangle pattern breakout along with robust volume. It is now trading above its key moving averages, which reinforces the bullish undertone.
The RSI is firmly positioned in the bullish zone, inching towards the 60 mark, reflecting improving price strength. Hence, we recommend accumulating the stock in the zone of Rs 1,160–1,170 levels.
Strategy: Buy
Target: Rs 1,250
Stop-Loss: Rs 1,130
One 97 Communications | CMP: Rs 1,288.3
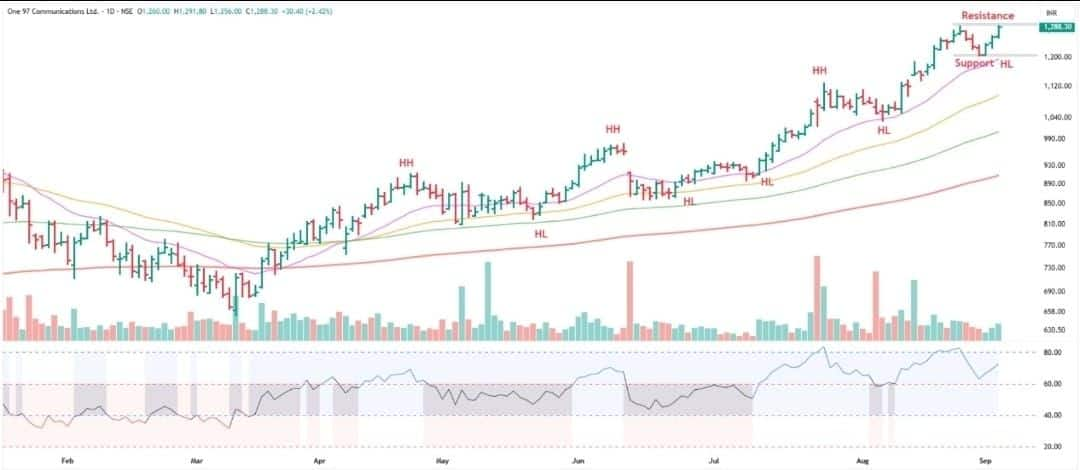
Paytm has been moving in a higher high, higher low formation on the daily chart, indicating that the stock is in a strong uptrend. It managed to hold on to its short-term key moving average—the 20-day EMA—during the recent consolidation phase and moved up steadily, reflecting strong bullish sentiment.
The Paytm/Nifty ratio chart has given a major horizontal trendline breakout and is at a fresh high, indicating likely outperformance in the short term.
Adding to the positive setup, the daily RSI is in bullish territory and continues to rise, reflecting strong bullish momentum. On the derivative front, all the strikes from Rs 1,200 to Rs 1,260 saw Call writers exiting (bears exiting) and strong Put writing (bulls entry), supporting the bullish outlook.
Hence, we recommend accumulating the stock in the zone of Rs 1,285–1,295 levels.
Strategy: Buy
Target: Rs 1,390
Stop-Loss: Rs 1,255
Rupak De, Senior Technical Analyst at LKP Securities
Glenmark Pharma | CMP: Rs 2,004.4
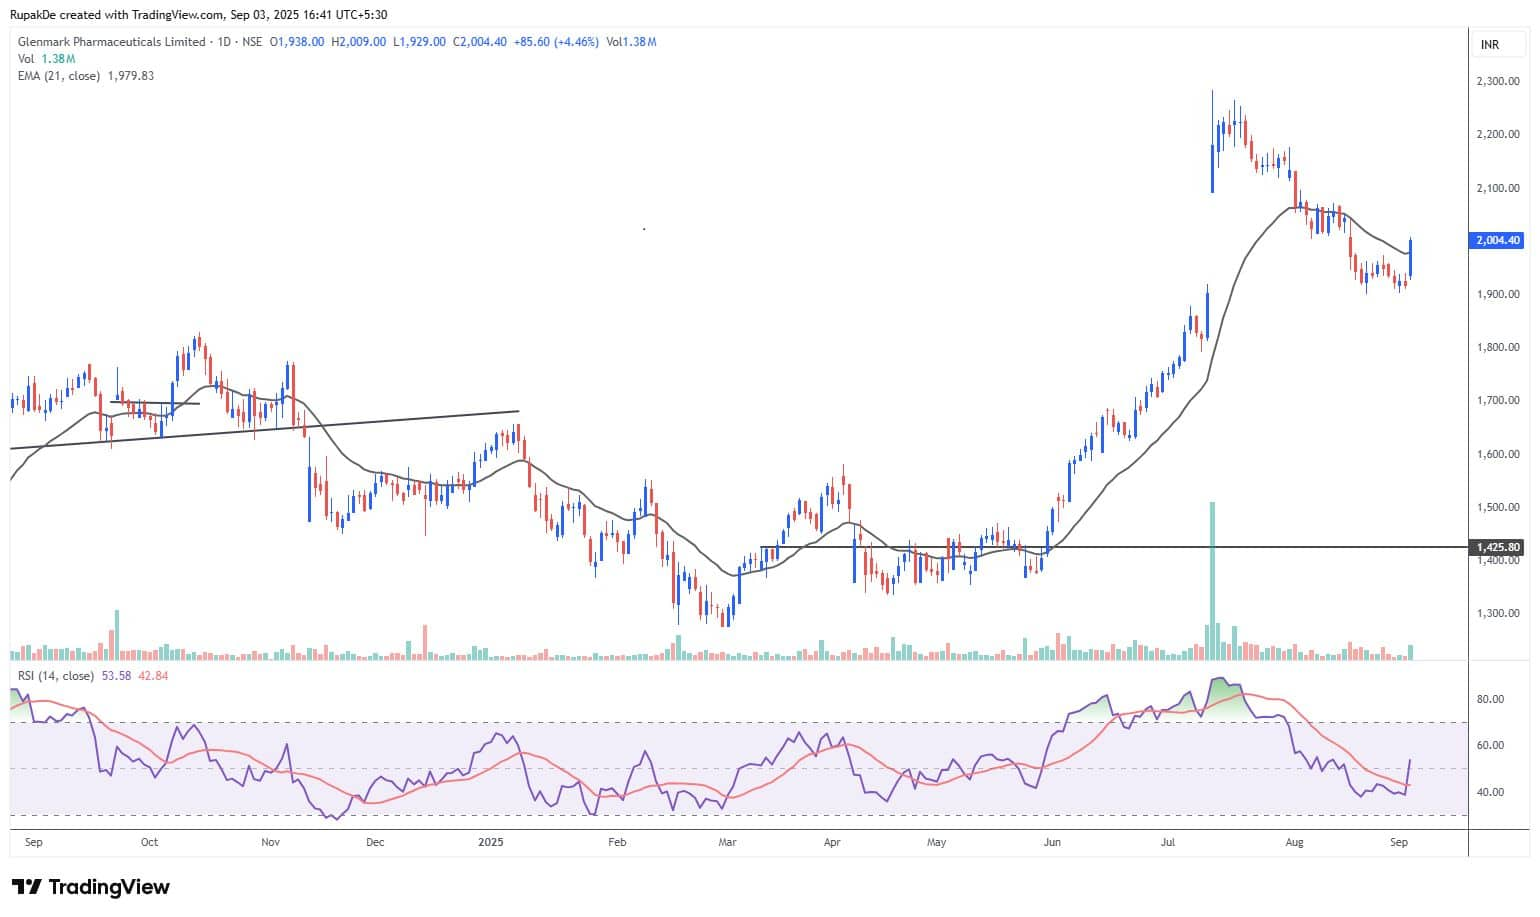
Glenmark Pharmaceuticals has witnessed a smart recovery following a base formation on the daily timeframe, pointing towards a significant improvement in interest around the stock. Lately, the stock has reclaimed the 21 EMA on the daily timeframe, confirming a bullish trend. The RSI is seen to be reversing near the oversold zone.
Strategy: Buy
Target: Rs 2,240
Stop-Loss: Rs 1,900
EIH | CMP: Rs 412.5
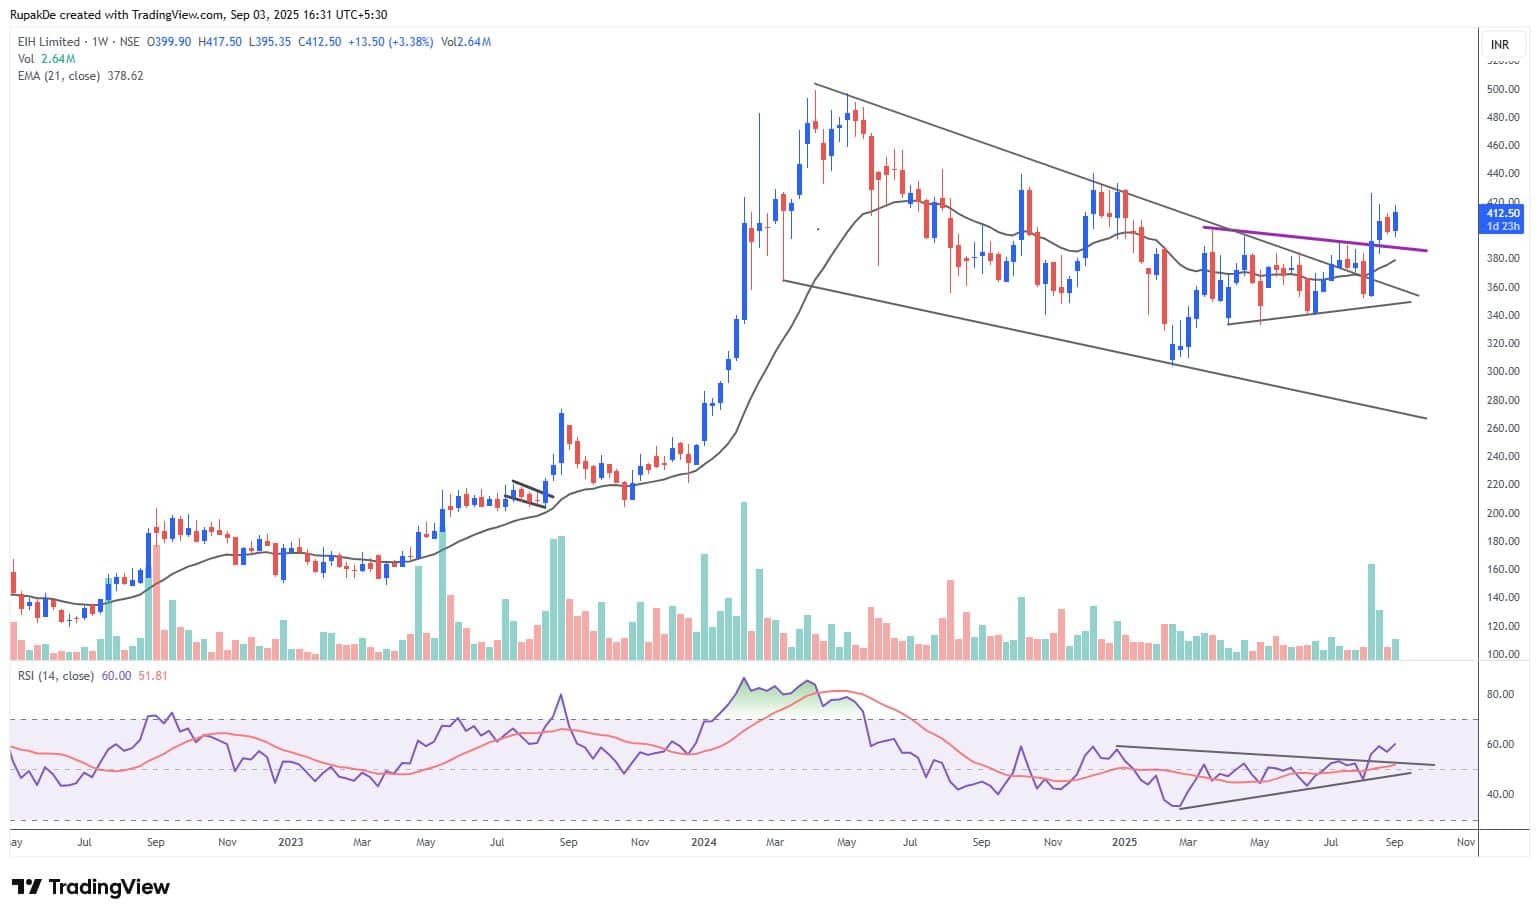
EIH has ended its downward trend, confirmed by a wedge pattern breakout on the weekly chart. Moreover, it has been sustaining above its recent consolidation range. The RSI has also broken out of a symmetrical triangle, indicating improving sentiment.
Strategy: Buy
Target: Rs 450
Stop-Loss: Rs 394
HDFC Bank | CMP: Rs 954.5
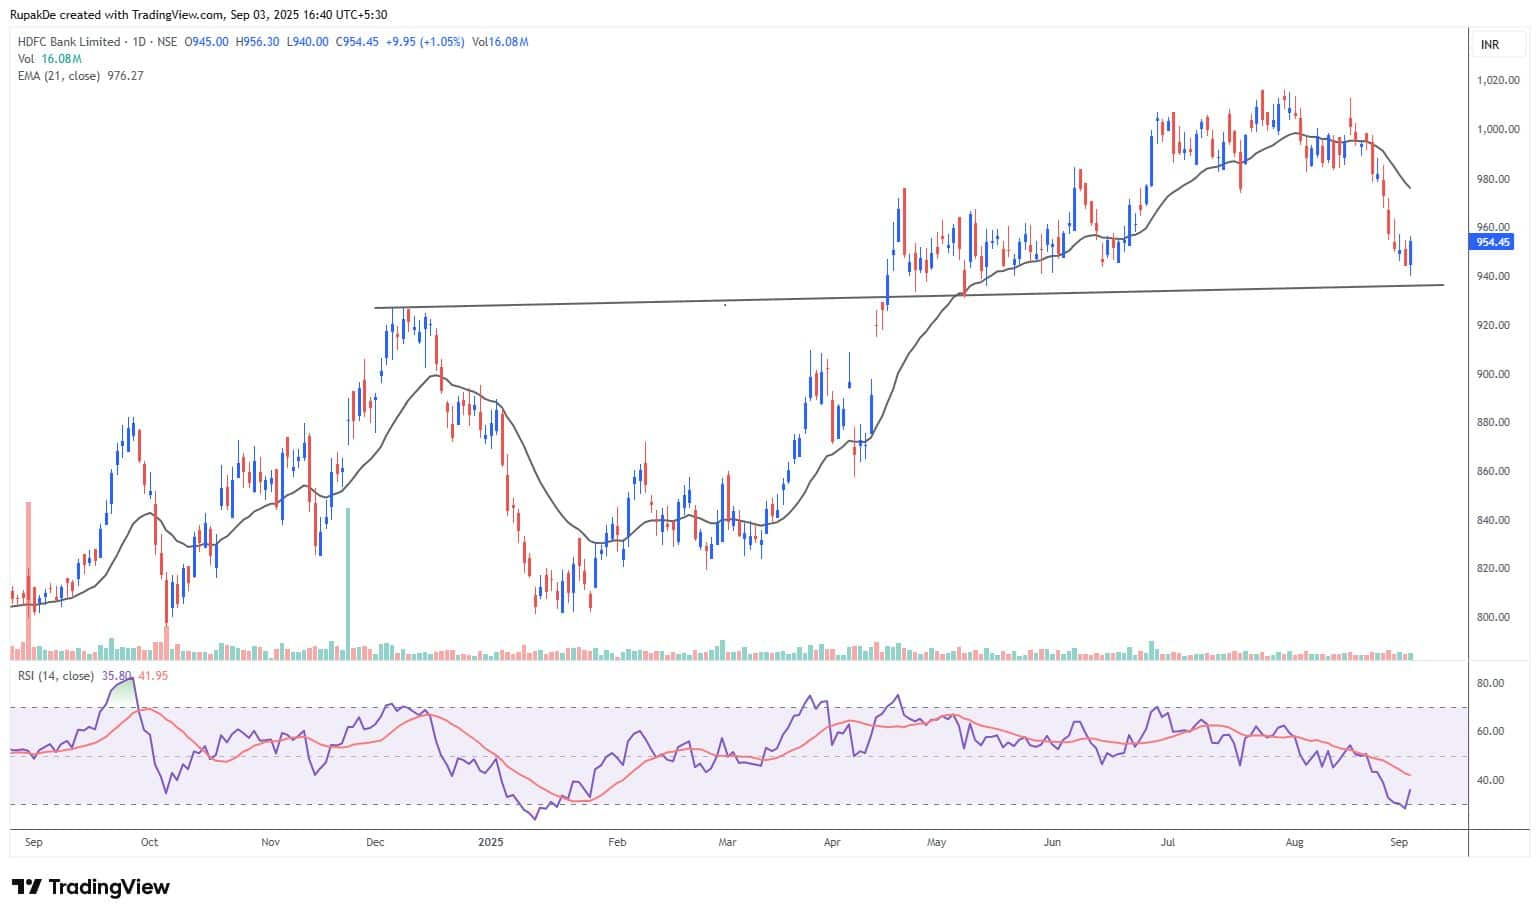
HDFC Bank has shown initial signs of recovery by forming an outside day bar on the daily timeframe. On the hourly chart, it has reclaimed the 21 EMA, accompanied by rising volumes. Additionally, the RSI has formed a positive divergence on the hourly timeframe, supporting a potential upside move.
Strategy: Buy
Target: Rs 1,015
Stop-Loss: Rs 924
Disclaimer: The views and investment tips expressed by investment experts on Moneycontrol.com are their own and not those of the website or its management. Moneycontrol.com advises users to check with certified experts before taking any investment decisions.
Discover the latest Business News, Sensex, and Nifty updates. Obtain Personal Finance insights, tax queries, and expert opinions on Moneycontrol or download the Moneycontrol App to stay updated!