


Equity benchmark indices bounced back with nearly one percent gains on August 11, but the market breadth was not very strong. About 1,479 shares advanced compared to 1,255 declining shares on the NSE. The market may remain consolidative and rangebound until it gives a strong close above all key moving averages. Below are some short-term trading ideas to consider:
Mehul Kothari, Senior Technical Analyst at Anand Rathi
HCL Technologies | CMP: Rs 1,488

HCL Technologies has witnessed a sharp correction of around 17 percent from its recent peak near Rs 1,752. Over the past 7–8 sessions, the stock has consistently held near the 0.618 retracement level, which also coincides with the gap formed on April 22–23, 2025. Notably, prices are trading well below the 100- and 200-day exponential moving averages, indicating the potential for a mean reversion.
On the daily charts, the RSI is forming a complex “W” pattern below the oversold threshold of 30, while bullish divergence is visible on the hourly chart. These technical cues suggest a possible rebound. Traders may consider entering long positions in the Rs 1,490–1,450 zone.
Strategy: Buy
Target: Rs 1,600
Stop-Loss: Rs 1,400
Bharat Petroleum Corporation | CMP: Rs 321
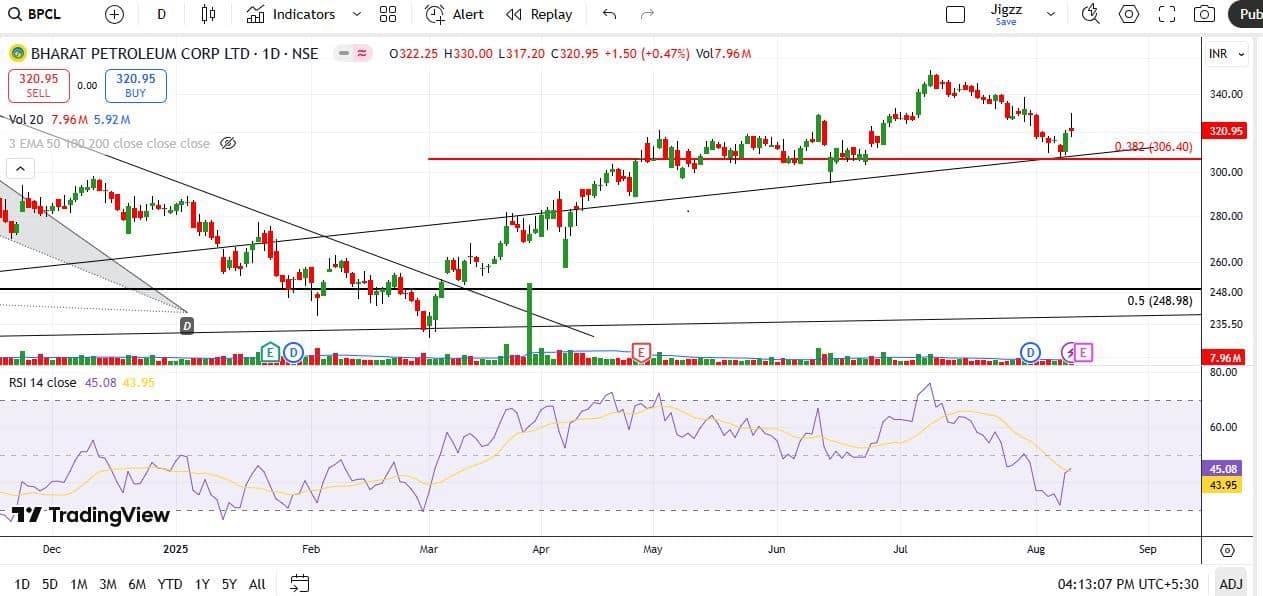
BPCL has recently found strong support, aligning with multiple technical indicators. The price has rebounded from a key trendline, the 0.382 Fibonacci retracement level, and the 100-day exponential moving average (DEMA), all converging to reinforce this support zone. Additionally, the Relative Strength Index (RSI) has formed a hidden bullish divergence, indicating that underlying momentum is improving despite recent price weakness. This setup suggests a favourable risk-reward scenario for short-term traders. Traders may consider entering long positions in the Rs 322–318 zone.
Strategy: Buy
Target: Rs 350
Stop-Loss: Rs 300
Titan Company | CMP: Rs 3,467.9

Titan has found support at a confluence of crucial technical levels, raising the likelihood of a short-term recovery. The stock has rebounded from a falling trendline, the 0.50 Fibonacci retracement, and the combined backing of the 100-day and 200-day exponential moving averages (DEMA). This convergence of supports reflects strong buying interest in the current range. Additionally, the Relative Strength Index (RSI) has displayed a hidden bullish divergence, signalling underlying strength despite recent price weakness. Traders may consider entering long positions in the Rs 3,475–3,425 zone.
Strategy: Buy
Target: Rs 3,750
Stop-Loss: Rs 3,300
Jay Thakkar, Vice President & Head of Derivatives and Quant Research at ICICI Securities
Indian Bank | CMP: Rs 674
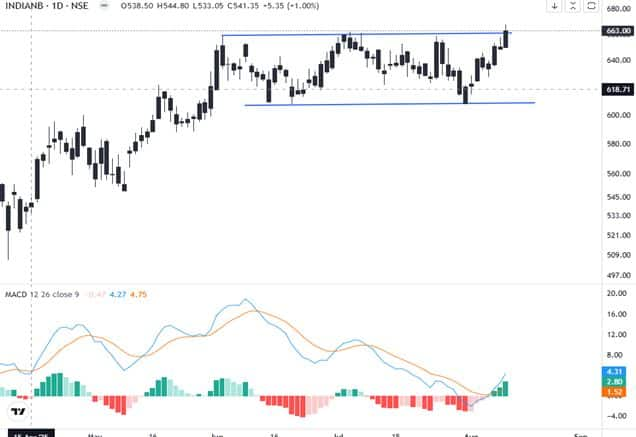
Indian Bank has provided a breakout from a Rs 50 range and has managed to close above it as well. There has been long buildup in this stock, and with this breakout, long positions are likely to be added, which will provide support at lower levels. There has been significant Put addition from the Rs 630 to Rs 660 strikes, which is a good support range.
Meanwhile, the Rs 670 and Rs 680 strikes have a huge Call base, so above those levels, further upward momentum is expected. The stock is trading well above its 20-day VWAP (volume-weighted average price) as well as its maximum pain level, thus confirming an upward breakout. Buy Indian Bank Futures in the range of Rs 680–675.
Strategy: Buy
Target: Rs 700, Rs 725
Stop-Loss: Rs 659
InterGlobe Aviation | CMP: Rs 5,878.5

IndiGo has been consolidating in the range of Rs 5,900 to Rs 5,700 levels, and the stock has been witnessing long buildup, so the breakout is likely to be on the upside. There has been Call unwinding on the lower side, while Put additions have been observed from Rs 5,500 to Rs 5,900 levels. Hence, these levels will act as crucial support.
However, Rs 5,900 and Rs 6,000 levels have a significant Call base as well, so a clear breakout will only occur above those levels. Since the stock is trading with a positive bias, the breakout is likely to be on the upside. Buy IndiGo Futures in the range of Rs 5,855 to Rs 5,870.
Strategy: Buy
Target: Rs 6,050, Rs 6,150
Stop-Loss: Rs 5,750
Larsen & Toubro | CMP: Rs 3,668.4
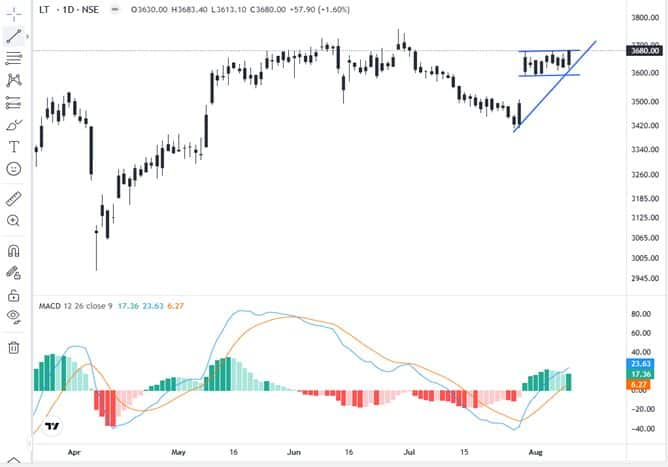
Larsen & Toubro has reversed in the upward direction with a gap post its results. Overall, there has been long buildup in the stock; hence, the medium-term trend is positive. There was some correction due to long unwinding; however, post-results and following some fresh order confirmations, the stock has reversed and turned momentum upward.
The stock was consolidating in a narrow range; however, a breakout has occurred, and further long buildup is expected. As per the options data, the Rs 3,700 strike has a huge Call base, so above those levels, further momentum is expected. The stock is trading well above its 20-day VWAP and maximum pain level, hence there is good support on the lower side, making the risk-to-reward ratio favourable for long positions. Buy Larsen & Toubro in the range of Rs 3,665 to Rs 3,675.
Strategy: Buy
Target: Rs 3,770, Rs 3,820
Stop-Loss: Rs 3,690
Vidnyan S Sawant, Head of Research at GEPL Capital
Transrail Lighting | CMP: Rs 798.9
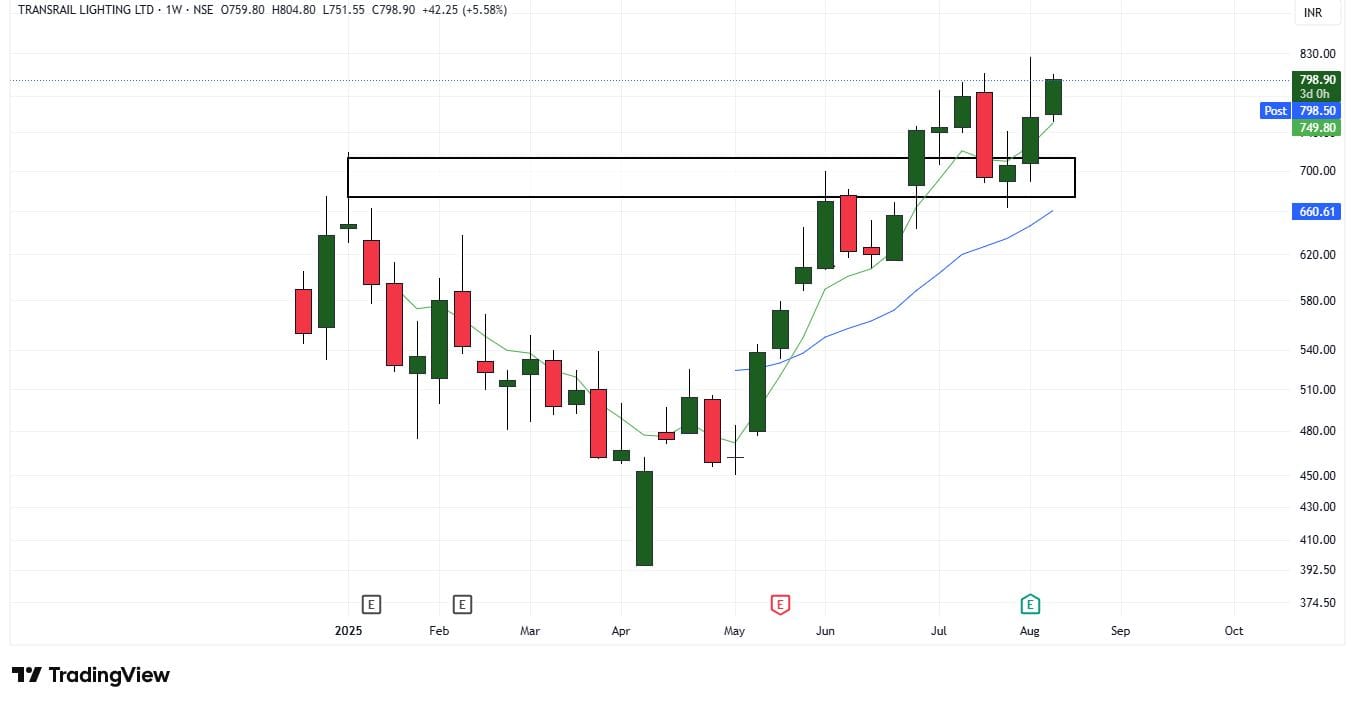
Transrail Lighting is displaying a constructive price structure, consistently forming higher highs and higher lows, reflecting sustained buying interest and positive market sentiment. On the weekly chart, the stock has witnessed a bullish polarity shift, where previous resistance levels have turned into support — a sign of strengthening trend conviction. Additionally, it continues to trade well above its 12- and 26-week EMA levels — a technical setup that typically signals strong medium-term momentum.
Strategy: Buy
Target: Rs 918
Stop-Loss: Rs 750
Fortis Healthcare | CMP: Rs 920.65

Fortis has shown remarkable resilience and strength, outperforming the broader market even during phases of overall weakness. The stock is trading well above its 12-, 26-, and 50-week EMAs, a technical configuration that underscores the stability and strength of its prevailing uptrend. Currently at lifetime highs, it sustains a robust higher-high, higher-low formation — a classic hallmark of a bullish price structure. The MACD indicator remains in positive territory with an upward slope, further validating the presence of strong bullish momentum.
Strategy: Buy
Target: Rs 1,031
Stop-Loss: Rs 874
One 97 Communications | CMP: Rs 1,122
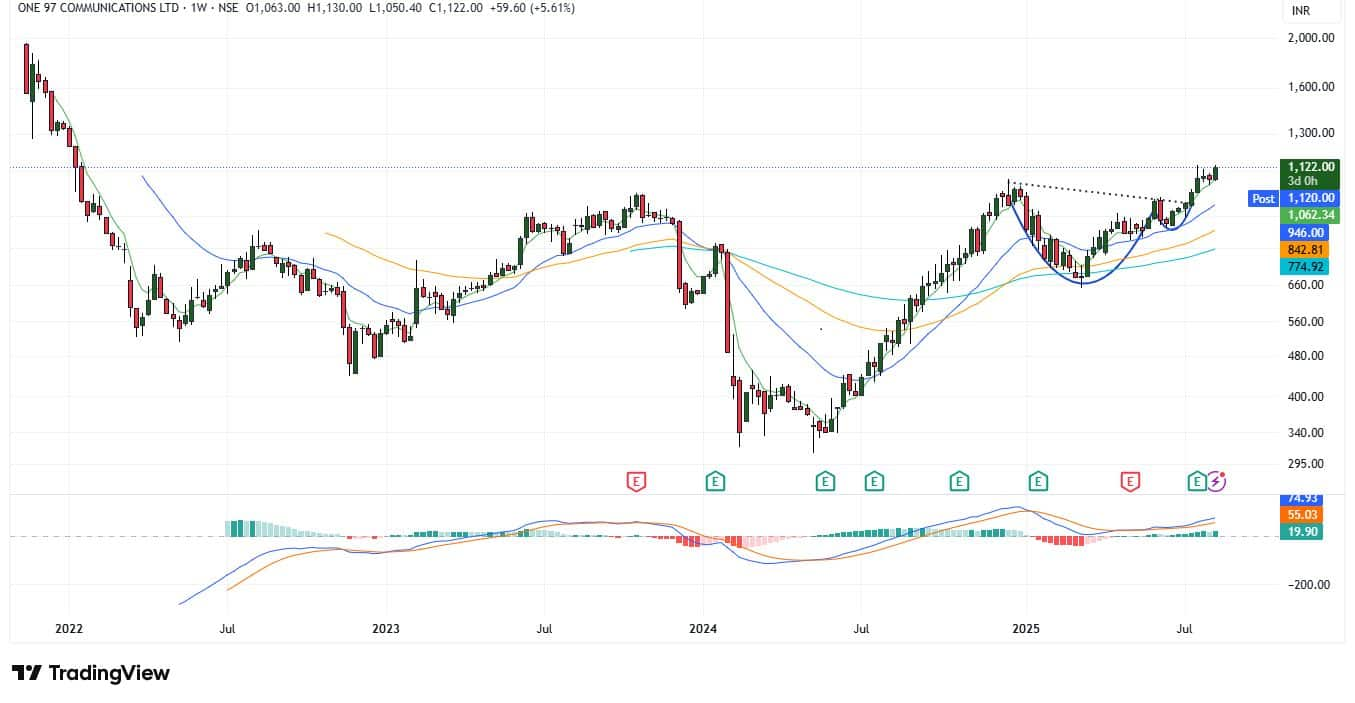
Paytm is exhibiting a robust positive price structure on the weekly chart, maintaining a pattern of higher highs and higher lows. On the daily timeframe, the stock has staged a bullish mean reversion from the 12-day EMA, supported by a notable rise in volumes above the 20-day average. It continues to hold firmly above the 5-, 12-, and 26-week EMAs, underscoring the strength of its underlying trend. The MACD remains in buy mode, indicating sustained bullish momentum and the potential for further upside.
Strategy: Buy
Target: Rs 1,232
Stop-Loss: Rs 1,075
GMDC | CMP: Rs 418.3

Gujarat Mineral Development Corporation is exhibiting a bullish polarity shift, with the previous resistance levels of November and December 2024 now serving as strong support in July and August 2025. The weekly chart shows a steady pattern of higher highs and higher lows, reflecting a firmly established uptrend backed by consistent institutional participation. The stock trades comfortably above its 5-, 12-, 25-, and 50-week EMAs, underscoring the strength of the prevailing trend and limiting downside risk. Additionally, the MACD’s sustained position in positive territory reinforces the bullish outlook, suggesting that any pullbacks are likely to invite fresh buying interest.
Strategy: Buy
Target: Rs 472
Stop-Loss: Rs 397
Disclaimer: The views and investment tips expressed by investment experts on Moneycontrol.com are their own and not those of the website or its management. Moneycontrol.com advises users to check with certified experts before taking any investment decisions.
Discover the latest Business News, Sensex, and Nifty updates. Obtain Personal Finance insights, tax queries, and expert opinions on Moneycontrol or download the Moneycontrol App to stay updated!