


The benchmark indices remained under pressure amid rangebound trading for the second consecutive session, falling 0.2 percent on July 3. The market breadth was slightly in favour of bears, as about 1,363 shares advanced against 1,283 declining shares on the NSE. The frontline indices are expected to see more consolidation with a negative bias in case the 10-day EMA is broken. Below are some short-term trading ideas to consider:
Mandar Bhojane, Senior Equity Research Analyst at Choice Broking
Dr Reddy's Laboratories | CMP: Rs 1,291.3
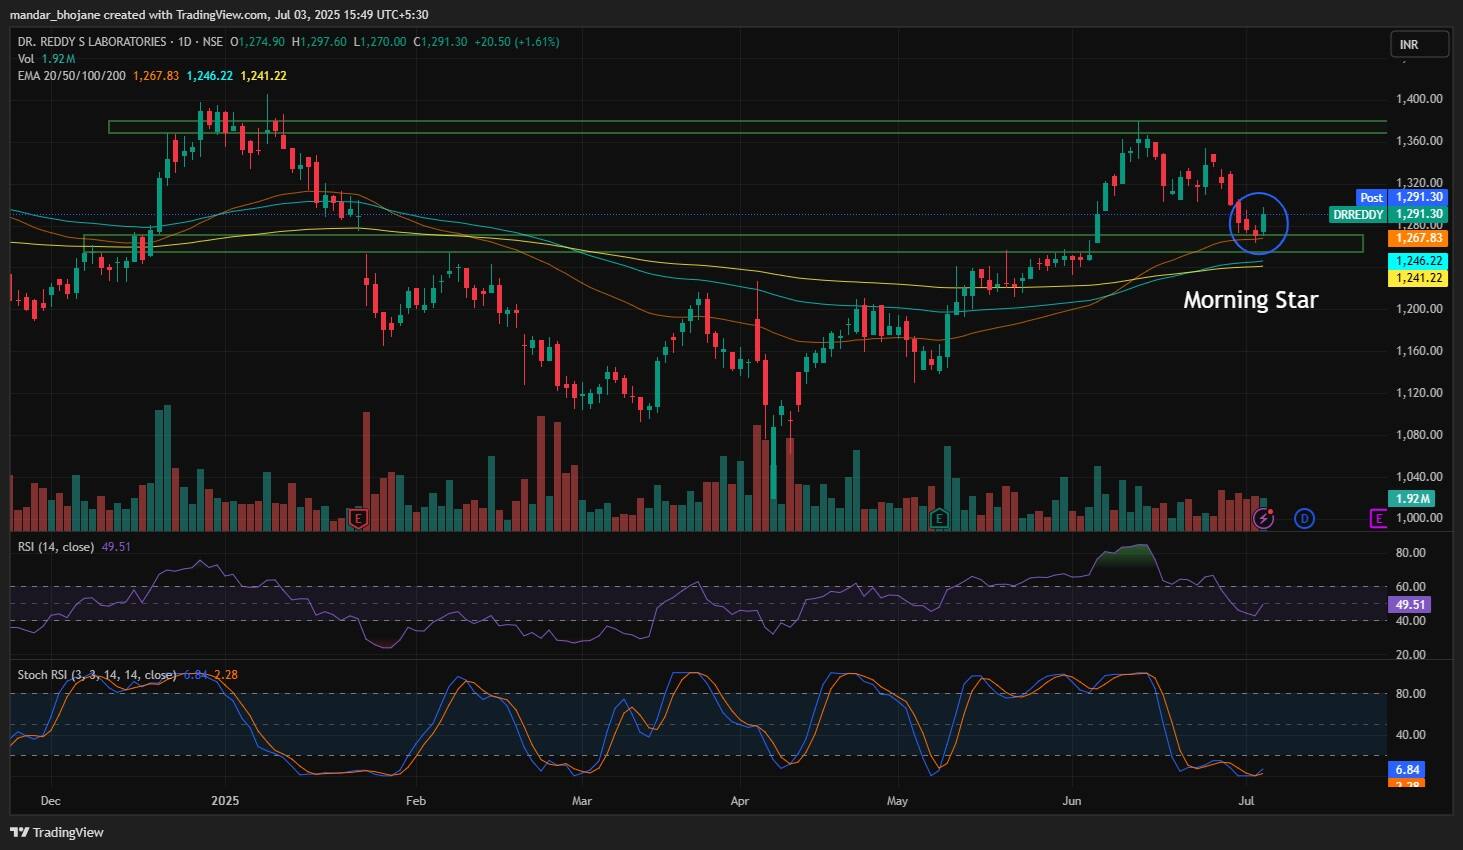
Dr Reddy's Laboratories is showing signs of a bullish reversal from a key support zone. The recent formation of a Morning Star pattern on the daily chart suggests a potential trend reversal. This is further validated by rising volumes, indicating renewed buying interest and strengthening sentiment around the stock.
The immediate support is placed around Rs 1,270, which can be seen as a strong accumulation zone for investors looking to enter on dips. The RSI (Relative Strength Index) is at 49.51 and trending upward, reflecting early signs of improving momentum. This suggests that the recent selling pressure may be fading, with buyers gradually regaining control. Given these technical cues, Dr Reddy's Laboratories looks poised for an upward move.
Strategy: Buy
Target: Rs 1,400
Stop-Loss: Rs 1,240
BSE | CMP: Rs 2,820.1
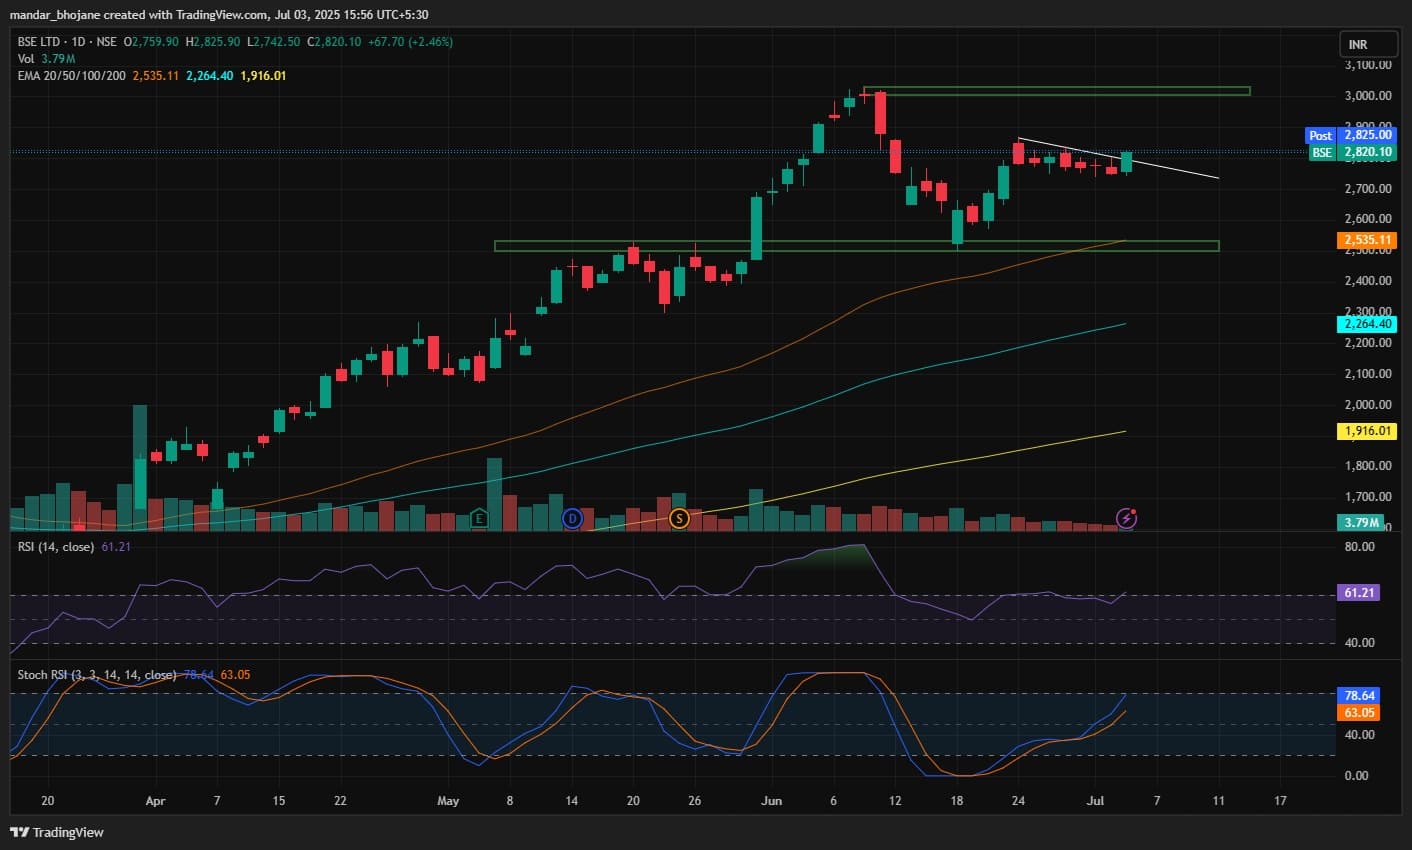
BSE has been consolidating in a narrow range, showing signs of strength as it approaches a potential breakout. The stock is forming a Flag and Pole pattern on the daily chart, which is typically a bullish continuation setup. Rising trading volumes indicate increasing investor interest, further supporting the possibility of an upside breakout in the near term.
A decisive close above the key resistance level of Rs 2,850 would confirm the breakout and strengthen the ongoing bullish momentum. The RSI is at 61.2, indicating positive momentum while still leaving room for further upside. On the downside, immediate support is placed at Rs 2,740, which could serve as a good entry point for traders looking to buy on dips.
Strategy: Buy
Target: Rs 3,050
Stop-Loss: Rs 2,680
Oil India | CMP: Rs 452.95
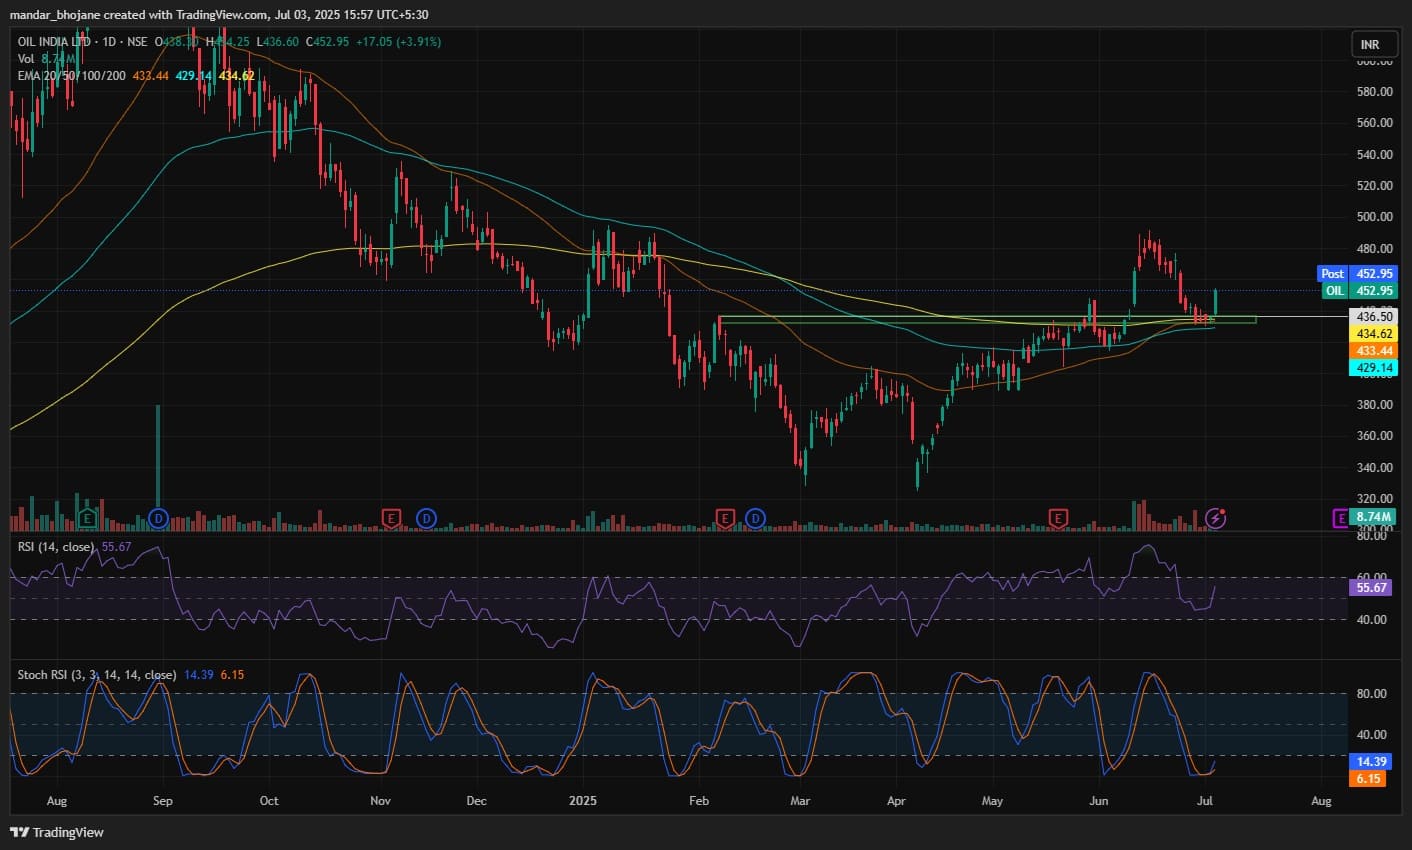
Oil India is showing early signs of a bullish reversal from a major support zone. A strong bullish candle formed on the daily chart, coupled with rising volumes, signals renewed buying interest and a possible trend shift in favour of the bulls. The price action suggests that the stock is attempting to reverse the recent downtrend, making it attractive for traders looking to enter early in a potential upmove.
Technically, the RSI is at 55.67 and trending upwards, indicating strengthening bullish momentum. The Rs 442 level acts as a solid support zone and could serve as an accumulation level for dips. If the stock sustains above current levels with continued volume support, it may head towards the short-term target of Rs 500.
Strategy: Buy
Target: Rs 500
Stop-Loss: Rs 430
Om Mehra, Technical Research Analyst at Samco Securities
IRCTC | CMP: Rs 778.50
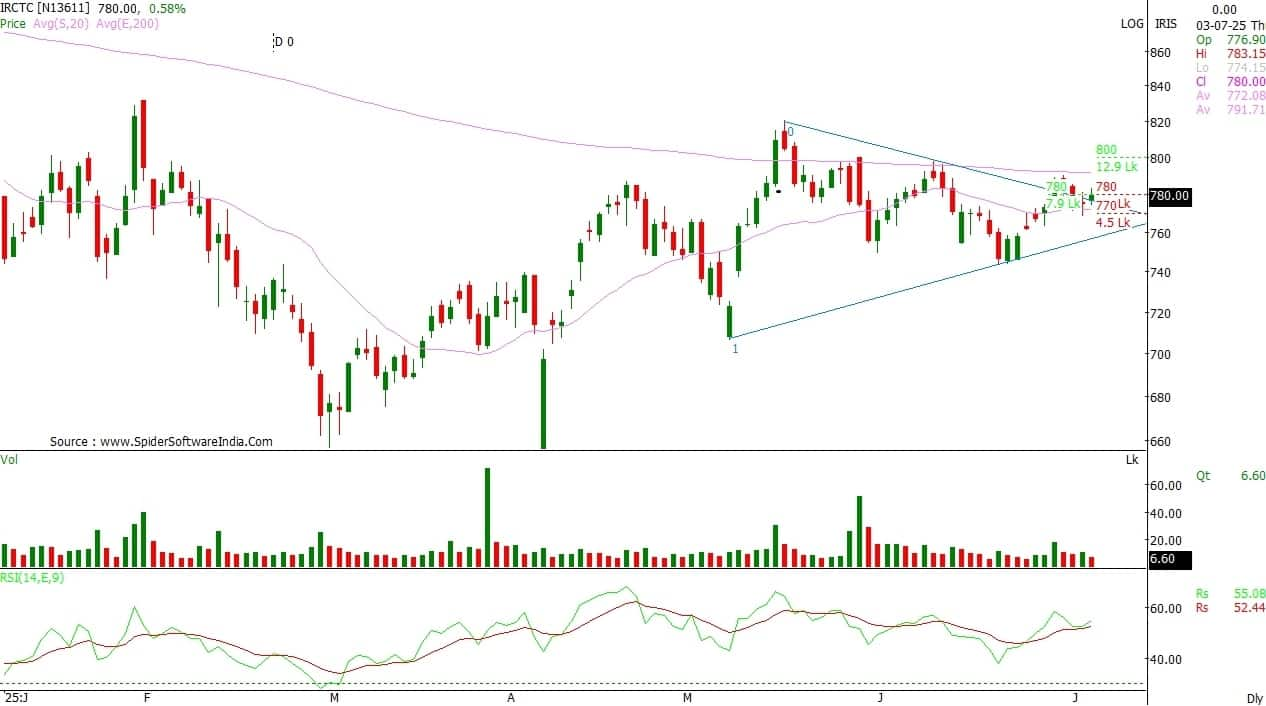
Indian Railway Catering & Tourism Corporation (IRCTC) has been trading within a narrowing range and is showing signs of strength after recently reclaiming the 50-day EMA and sustaining above it. The stock appears to be forming a contracting triangle, bounded by rising support and falling resistance lines, and is now approaching a potential breakout zone near Rs 790. A series of higher lows along the lower trendline reinforces the underlying bullish undertone.
The price is currently holding above the 9-day and 20-day EMAs, both of which have started to slope upward, indicating a short-term revival in momentum. The 200-day EMA, placed above the triangle pattern, may act as a medium-term breakout trigger if crossed decisively. The RSI stands at 48, hovering around the neutral zone and showing a gradual upturn. The volume has remained relatively stable, and any rise during the breakout could confirm strength.
Strategy: Buy
Target: Rs 825
Stop-Loss: Rs 754
IDFC First Bank | CMP: Rs 77.66
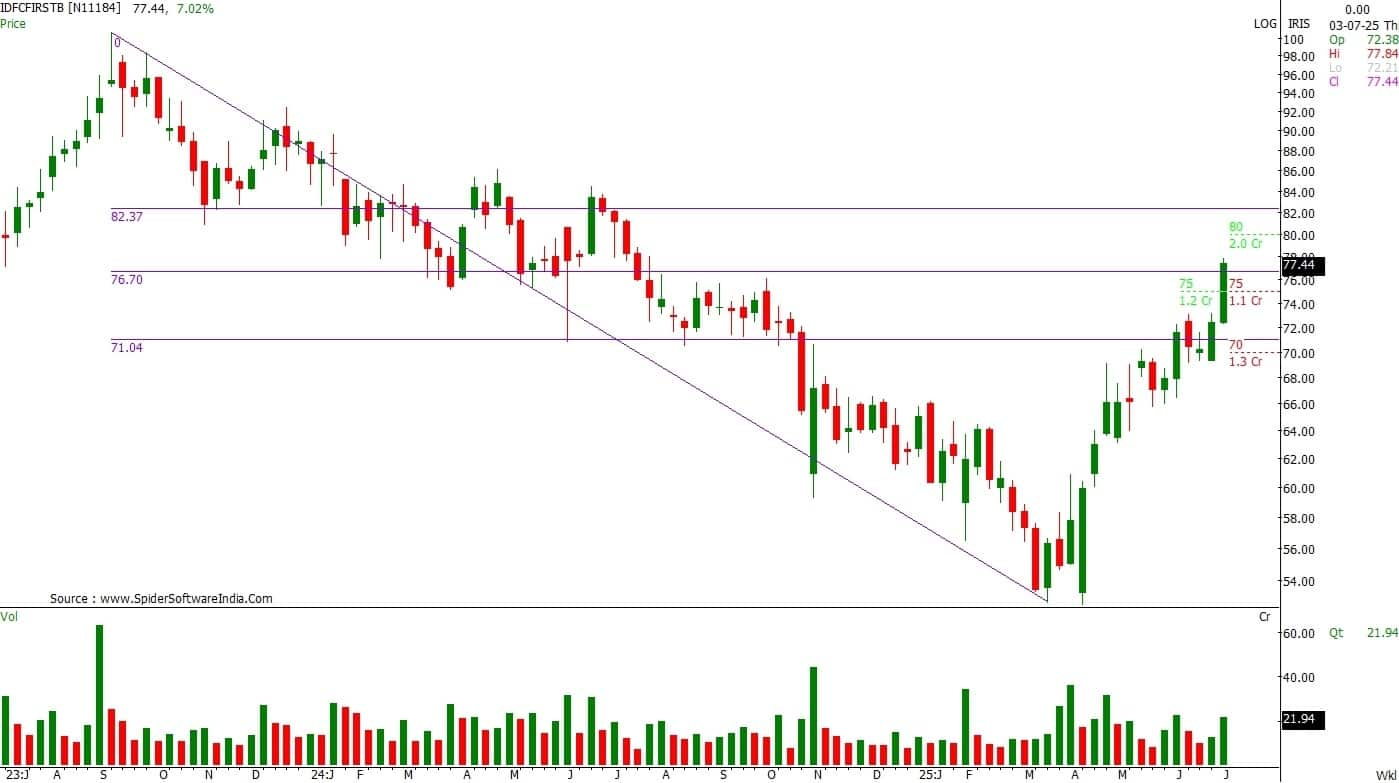
IDFC First Bank has delivered a strong breakout above the key resistance zone near Rs 76, which coincides with the 50% Fibonacci retracement level drawn from the previous swing high of Rs 100.70 to the low of Rs 52.89. The stock had been consolidating in a narrow rising channel and has now broken out with strong momentum — the first time in several months.
The price is currently trading above all major moving averages, confirming a shift in the medium-term trend. The RSI has surged to 67, indicating rising strength without yet entering overbought territory. The MACD is in a strong bullish crossover, with the fast line significantly above the signal line and the histogram expanding sharply. The recent breakout is also accompanied by a rise in volume, lending credibility to the move. Any dip toward the Rs 75–76 zone could offer a fresh entry point.
Strategy: Buy
Target: Rs 83
Stop-Loss: Rs 74.70
Voltas | CMP: Rs 1,367
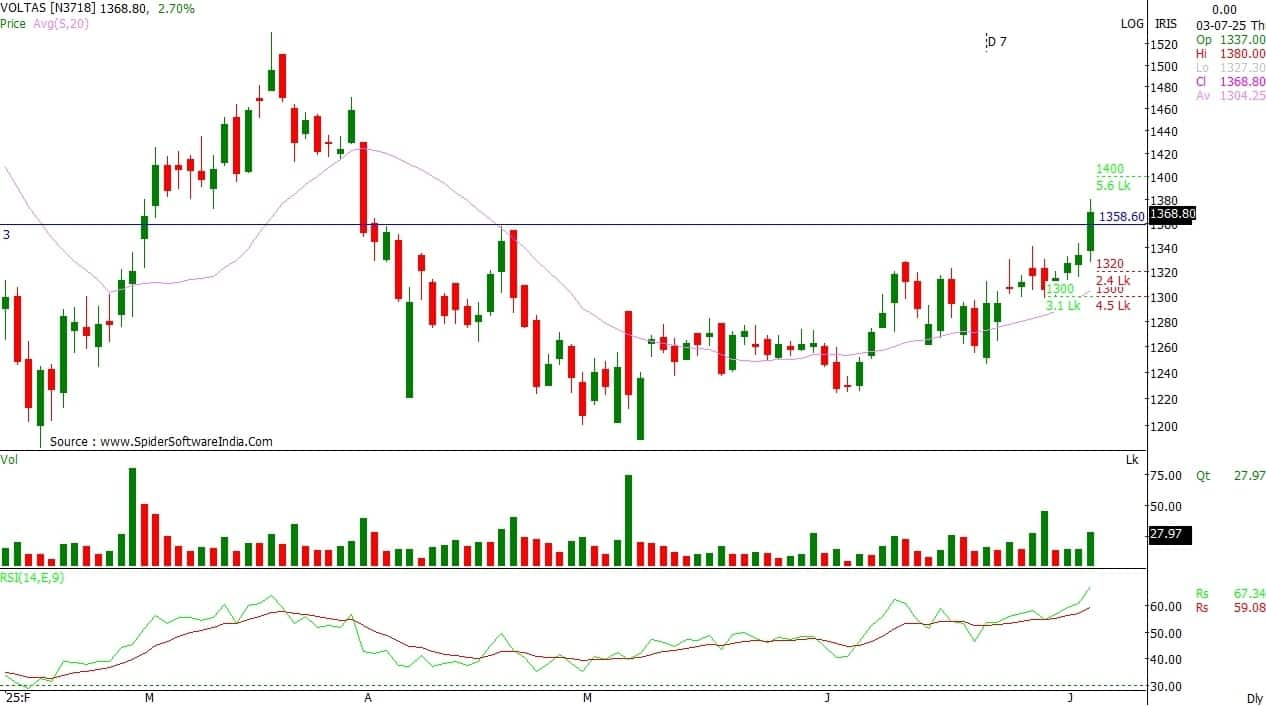
Voltas has registered a decisive breakout from a well-defined saucer formation after weeks of base formation. The stock surged over 2.5 percent in the last session with strong bullish intent, rising above the neckline of the rounding base and confirming the breakout. The move is accompanied by a noticeable pickup in volume as well.
The stock is now trading comfortably above the 20- and 50-day SMAs and also holds well above the Supertrend support. The upward-curving price base, combined with higher lows and a bullish crossover in both momentum indicators, signals continuation of the recent uptrend.
The RSI has climbed to 67, nearing the overbought zone but still showing strength with a steady rising slope. The MACD is already in a strong bullish crossover, with the fast line widening its gap above the signal line and the histogram turning positive and expanding consistently.
Strategy: Buy
Target: Rs 1,460
Stop-Loss: Rs 1,325
Chandan Taparia, Head – Technical Research and Derivatives at Motilal Oswal Financial Services
Pidilite Industries | CMP: Rs 3,114.5
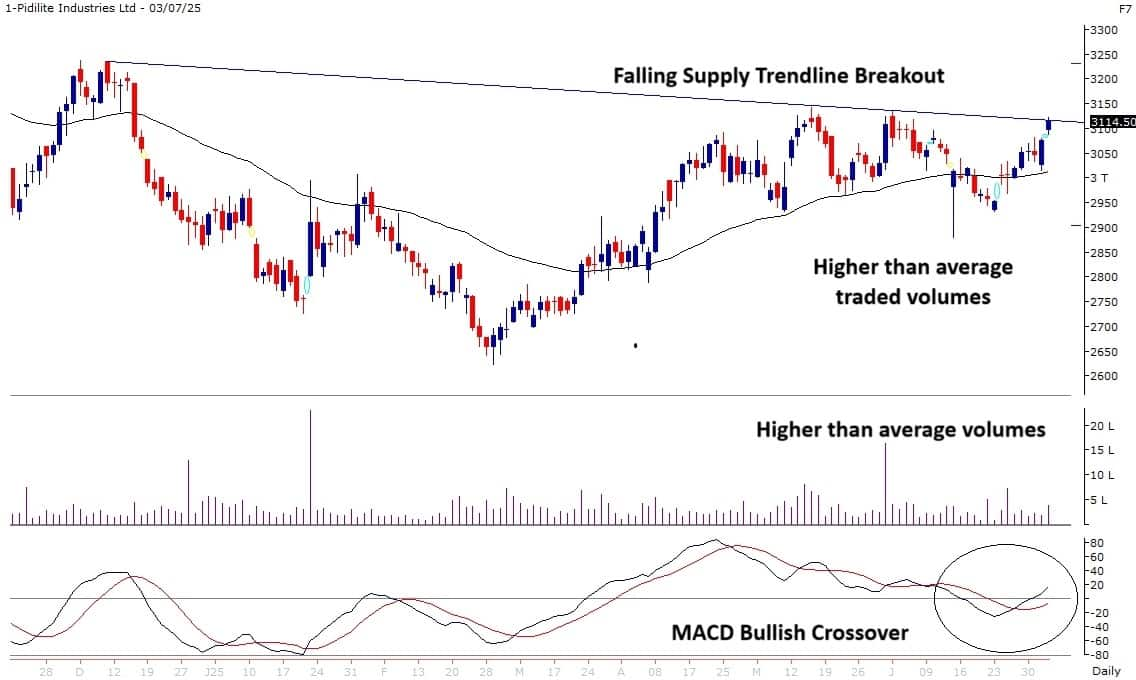
Pidilite Industries has broken out of a falling supply trendline on the daily chart, indicating a shift in momentum from consolidation to an upward bias. The stock is respecting its 50 DEMA, with shallow dips being actively bought into. The MACD has given a positive crossover, adding strength to the bullish setup.
Strategy: Buy
Target: Rs 3,230
Stop-Loss: Rs 3,050
Amber Enterprises India | CMP: Rs 7,345
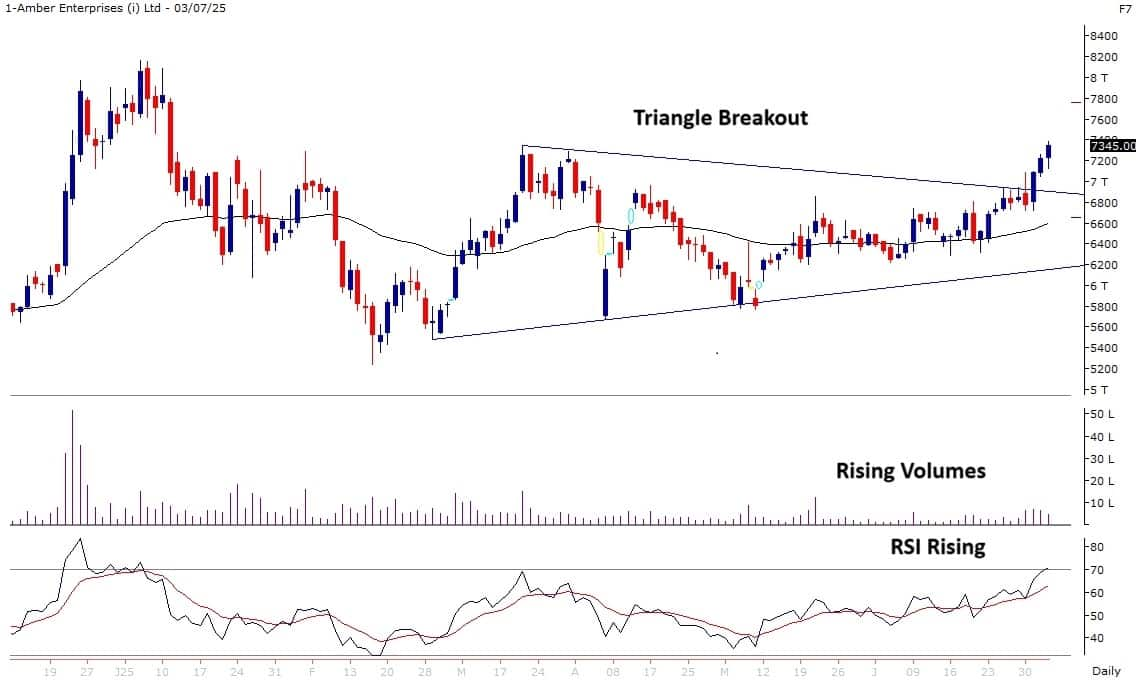
Amber Enterprises has given a breakout from a triangle pattern on the daily chart, supported by a strong-bodied bullish candle, signaling a potential continuation of the uptrend. The RSI is rising steadily, indicating strengthening momentum.
Strategy: Buy
Target: Rs 7,820
Stop-Loss: Rs 7,075
Disclaimer: The views and investment tips expressed by investment experts on Moneycontrol.com are their own and not those of the website or its management. Moneycontrol.com advises users to check with certified experts before taking any investment decisions.
Discover the latest Business News, Sensex, and Nifty updates. Obtain Personal Finance insights, tax queries, and expert opinions on Moneycontrol or download the Moneycontrol App to stay updated!
Find the best of Al News in one place, specially curated for you every weekend.
Stay on top of the latest tech trends and biggest startup news.