


The Nifty 50 bounced back with a stellar performance, rising over half a percent on November 19 despite weak overall market breadth. The technical and momentum indicators remained in favour of the bulls, signalling a positive mood going ahead. The index climbed toward 26,100—the crucial hurdle—for the third time since October. If the index successfully crosses and consistently holds above this zone, a move toward 26,300 (near the record high) could be easily seen in the upcoming sessions. However, support is placed in the 25,750–25,850 zone, according to experts.

Here are 15 data points we have collated to help you spot profitable trades:
1) Key Levels For The Nifty 50 (26,053)
Resistance based on pivot points: 26,078, 26,130, and 26,213
Support based on pivot points: 25,911, 25,860, and 25,776
Special Formation: The Nifty 50 formed a long bullish candle and closed above the high of the previous day’s bearish candle on the daily charts, signalling strength and continuation of the upward trend. The short- and medium-term moving averages were inclined northward, while the RSI at 64.21 and the Stochastic RSI maintained a bullish crossover. The MACD also showed a positive crossover with the histogram climbing above the zero line. All this indicates sustained bullish momentum and strong buying interest at lower levels.
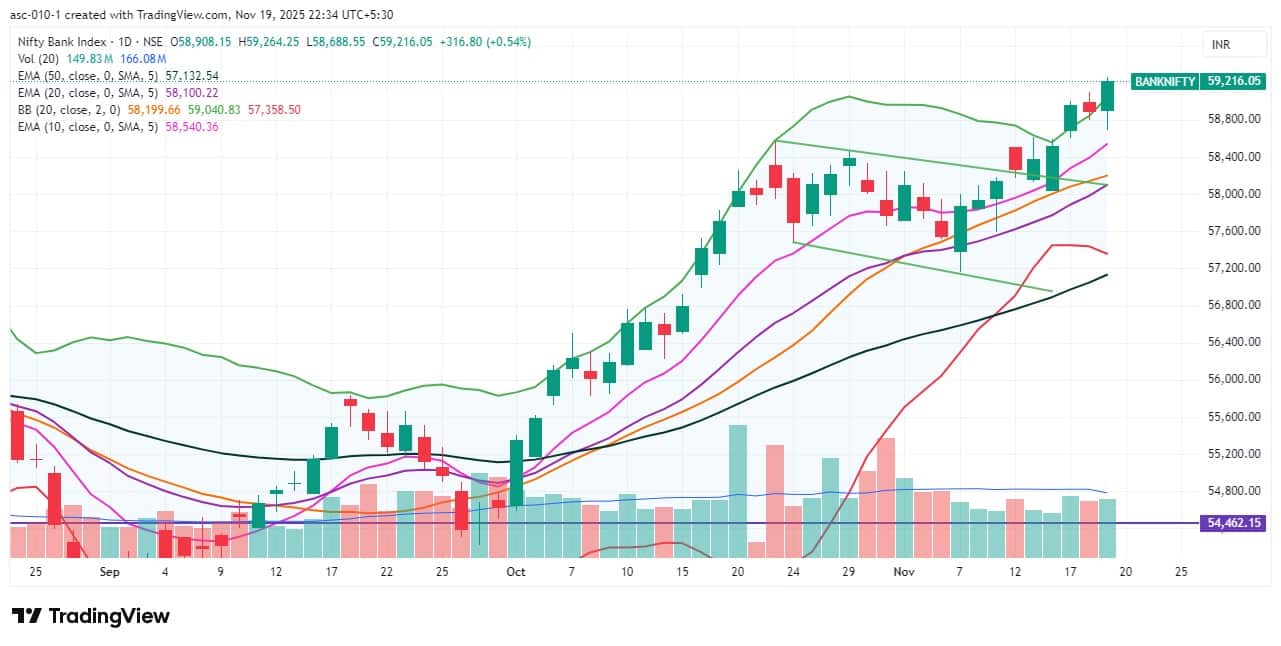
2) Key Levels For The Bank Nifty (59,216)
Resistance based on pivot points: 59,276, 59,412, and 59,632
Support based on pivot points: 58,836, 58,701, and 58,481
Resistance based on Fibonacci retracement: 59,455, 60,875
Support based on Fibonacci retracement: 58,767, 58,460
Special Formation: The Bank Nifty sustained above the upper line of the Bollinger Bands for the third straight session, rising 0.54 percent to register a new closing high and forming a bullish candle with a lower shadow on the daily timeframe—signalling that bulls remain firmly in control. The RSI jumped to 72.88, and the Stochastic RSI continued its upward journey with a bullish crossover. The MACD remained in a positive crossover with further strengthening in the histogram. All this indicates robust bullish momentum and the possibility of continued upside in the near term.
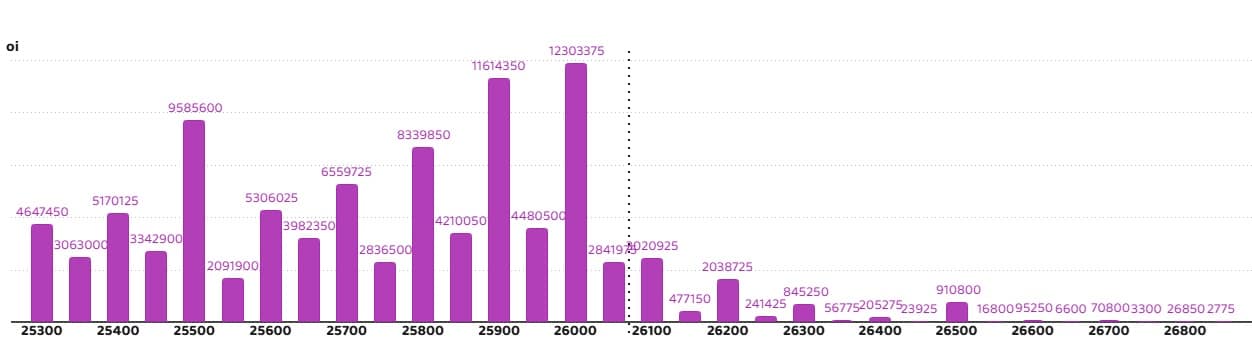
According to the monthly options data, the 26,000 strike holds the maximum Call open interest (with 1.14 crore contracts). This level can act as a key level for the Nifty in the short term. It was followed by the 26,500 strike (1.03 crore contracts) and 26,200 strike (70.58 lakh contracts).
Maximum Call writing was observed at the 26,500 strike, which saw an addition of 31.25 lakh contracts, followed by the 26,300 and 26,400 strikes, which added 19.07 lakh and 15.31 lakh contracts, respectively. The maximum Call unwinding was seen at the 26,000 strike, which shed 18.28 lakh contracts, followed by the 25,900 and 25,950 strikes, which shed 17.13 lakh and 6.49 lakh contracts, respectively.

On the Put side, the maximum Put open interest was seen at the 26,000 strike (with 1.23 crore contracts), which can act as a key level for the Nifty in the short term. It was followed by the 25,900 strike (1.16 crore contracts) and the 25,500 strike (95.85 lakh contracts).
The maximum Put writing was placed at the 25,900 strike, which saw an addition of 64.39 lakh contracts, followed by the 25,800 and 25,850 strikes, which added 34.48 lakh and 32.04 lakh contracts, respectively. The maximum Put unwinding was seen at the 26,500 strike which shed 73,725 contracts, followed by the 26,700 strike, which shed 2,700 contracts.
5) Bank Nifty Call Options Data
According to the monthly options data, the maximum Call open interest was seen at the 60,000 strike, with 11.51 lakh contracts. This can act as a key resistance level for the index in the short term. It was followed by the 58,500 strike (10.8 lakh contracts) and the 59,000 strike (10.69 lakh contracts).
Maximum Call writing was observed at the 59,200 strike (with the addition of 1.83 lakh contracts), followed by the 59,300 strike (71,435 contracts) and 59,700 strike (53,830 contracts). The maximum Call unwinding was seen at the 59,000 strike, which shed 3.34 lakh contracts, followed by the 58,500 and 58,900 strikes, which shed 2.08 lakh and 1.24 lakh contracts, respectively.

6) Bank Nifty Put Options Data
On the Put side, the 58,000 strike holds the maximum Put open interest (with 15.87 lakh contracts), which can act as a key support level for the index. This was followed by the 58,500 strike (15.69 lakh contracts) and the 59,000 strike (13.67 lakh contracts).
The maximum Put writing was placed at the 59,000 strike (which added 2.73 lakh contracts), followed by the 59,200 strike (2.61 lakh contracts) and the 57,800 strike (1.38 lakh contracts). The maximum Put unwinding was seen at the 57,500 strike, which shed 1.21 lakh contracts, followed by the 58,500 and 57,300 strikes, which shed 1.02 lakh and 57,260 contracts, respectively.


The Nifty Put-Call ratio (PCR), which indicates the mood of the market, jumped to 1.29 on November 19, compared to 1.02 in the previous session.
The increasing PCR, or being higher than 0.7 or surpassing 1, means traders are selling more Put options than Call options, which generally indicates the firming up of a bullish sentiment in the market. If the ratio falls below 0.7 or moves towards 0.5, then it indicates selling in Calls is higher than selling in Puts, reflecting a bearish mood in the market.

9) India VIX
The India VIX, which measures expected market volatility, remained well below the 13 zone and hovered around its short-term moving averages. The index fell 1.01 percent to 11.97, providing comfort to the bulls.

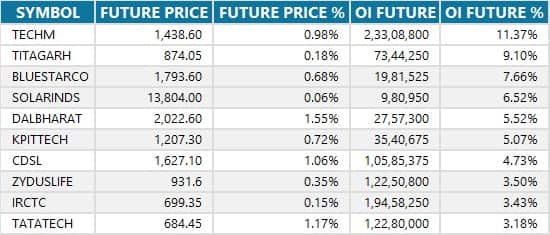
A long build-up was seen in 50 stocks. An increase in open interest (OI) and price indicates a build-up of long positions.
11) Long Unwinding (32 Stocks)
32 stocks saw a decline in open interest (OI) along with a fall in price, indicating long unwinding.
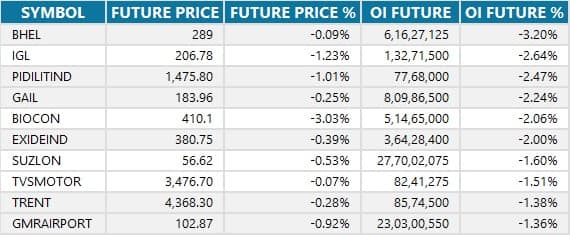
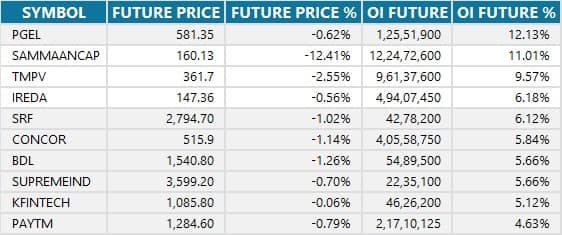
12) Short Build-up (80 Stocks)
109 stocks saw an increase in OI along with a fall in price, indicating a build-up of short positions.
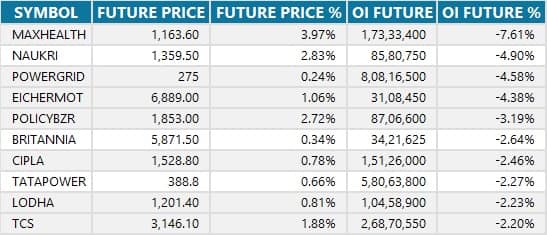
13) Short-Covering (50 Stocks)
50 stocks saw short-covering, meaning a decrease in OI, along with a price increase.
Here are the stocks that saw a high share of delivery trades. A high share of delivery reflects investing (as opposed to trading) interest in a stock.

Securities banned under the F&O segment include companies where derivative contracts cross 95 percent of the market-wide position limit.
Stocks added to F&O ban: Sammaan Capital
Stocks retained in F&O ban: SAIL
Stocks removed from F&O ban: Nil
Disclaimer: The views and investment tips expressed by experts on Moneycontrol are their own and not those of the website or its management. Moneycontrol advises users to check with certified experts before taking any investment decisions.Disclaimer: Moneycontrol is a part of the Network18 group. Network18 is controlled by Independent Media Trust, of which Reliance Industries is the sole beneficiary.Discover the latest Business News, Sensex, and Nifty updates. Obtain Personal Finance insights, tax queries, and expert opinions on Moneycontrol or download the Moneycontrol App to stay updated!
Find the best of Al News in one place, specially curated for you every weekend.
Stay on top of the latest tech trends and biggest startup news.


