


The sell-off continued in the equity market for the fifth consecutive session, pulling the benchmark indices down by nearly 1 percent on October 4, with market breadth favouring the bears. About 1,779 shares declined, while 1,055 shares advanced on the NSE. Overall sentiment remains weak, but given the somewhat oversold conditions, a bounce back cannot be ruled out early next week. Below are some trading ideas for the near term:
Rajesh Palviya, Senior Vice President Research (Head Technical Derivatives) at Axis Securities
Anant Raj | CMP: Rs 721
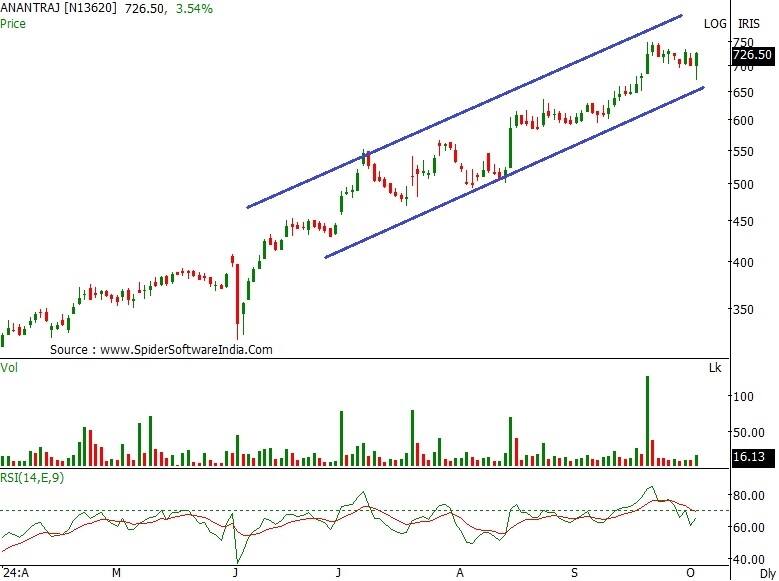
Anant Raj is in a strong uptrend across all time frames, reflecting bullish sentiment. On the daily chart, the stock is trending higher within an "Up-Sloping Channel," further indicating positive sentiment. Recently, the stock recaptured its 20-day SMA (Simple Moving Average) and rebounded sharply, reaffirming the bullish trend. The weekly and monthly strength indicators, RSI (Relative Strength Index), are in positive terrain, justifying rising strength across all time frames. Investors should buy, hold, and accumulate this stock, with an expected upside of Rs 805-850 and downside support in the Rs 670-630 range.
Strategy: Buy
Target: Rs 805, Rs 850
Stop-Loss: Rs 670
Dr Lal PathLabs | CMP: Rs 3,495

On the daily and weekly timeframes, Dr Lal PathLabs has decisively broken out of the past couple of months' "consolidation range" (Rs 3,470-3,215) on a closing basis. This breakout is accompanied by heavy volumes, indicating increased participation. The weekly "Bollinger Bands" buy signal also shows rising participation. The stock is well-placed above its 20, 50, 100, and 200-day SMAs, all of which are inching upward alongside the price, reaffirming the bullish trend. The daily, weekly, and monthly RSI indicators are in positive terrain, supporting rising strength across all time frames. Investors should buy, hold, and accumulate this stock, with an expected upside of Rs 3,800-3,985 and downside support in the Rs 3,395-3,300 range.
Strategy: Buy
Target: Rs 3,800, Rs 3,985
Stop-Loss: Rs 3,395
Whirlpool of India | CMP: Rs 2,362.6

On the weekly timeframe, Whirlpool has confirmed a "Flag" formation at the Rs 2,250 level on a closing basis, indicating the continuation of the prior trend. The daily "Bollinger Bands" buy signal shows increased participation. The stock is positioned above its 20, 50, 100, and 200-day SMAs, which are also rising with the price, reaffirming the bullish trend. The daily, weekly, and monthly RSI indicators are in positive terrain, justifying the rising strength across all time frames. The past 8-10 months have seen rising volumes, signifying increased participation from lower levels. Investors should buy, hold, and accumulate this stock, with an expected upside of Rs 2,500-2,730 and downside support in the Rs 2,250-2,185 range.
Strategy: Buy
Target: Rs 2,500, Rs 2,730
Stop-Loss: Rs 2,250
Rajesh Bhosale, Technical Analyst at Angel One
JK Paper | CMP: Rs 490
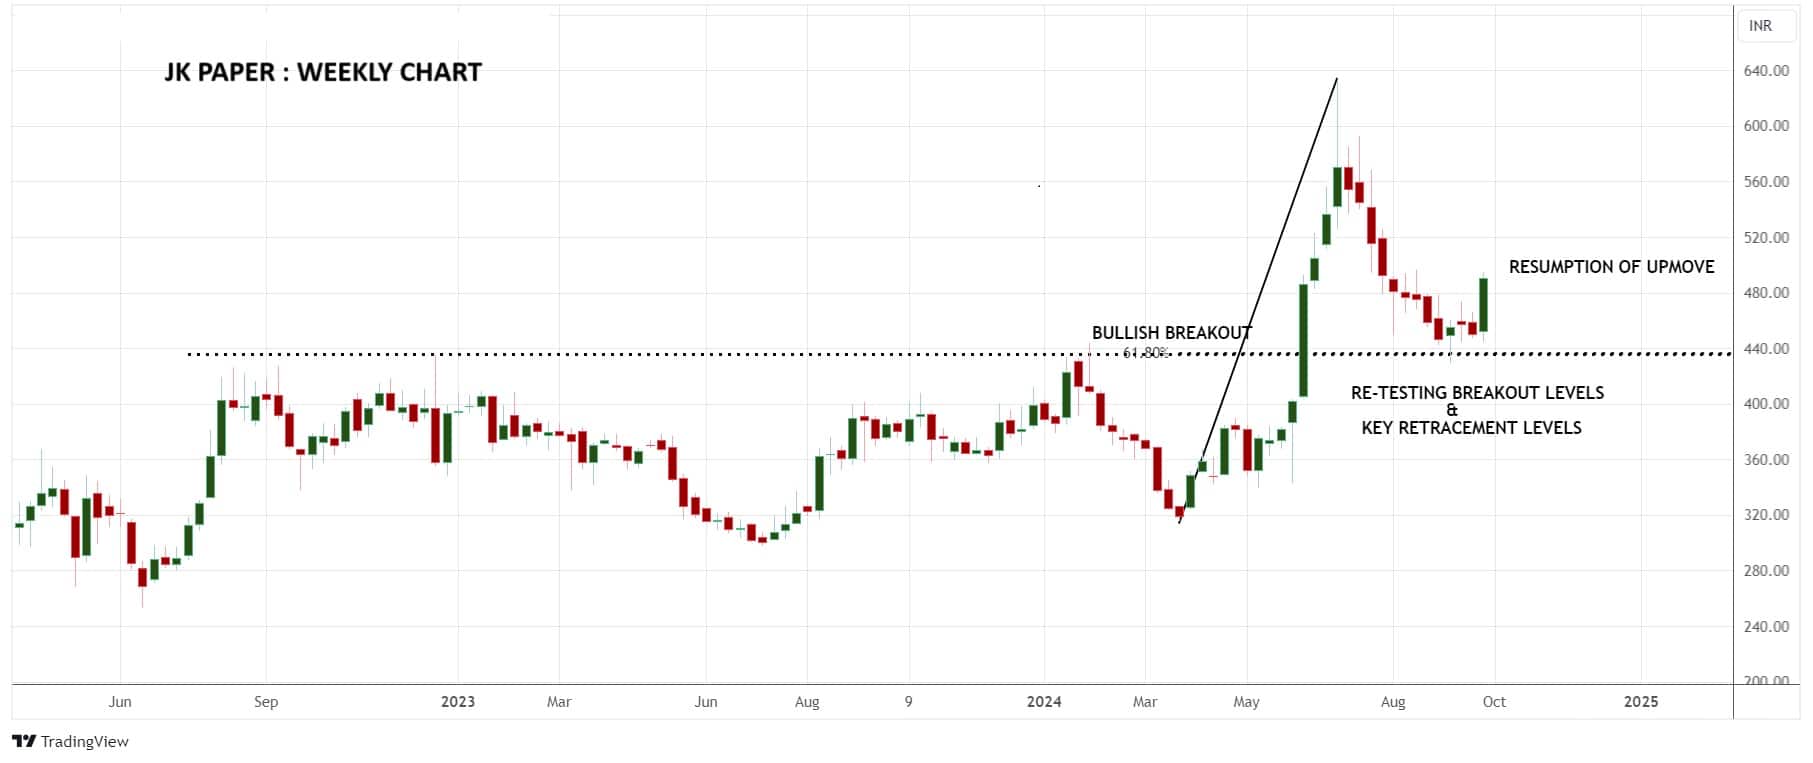
Since the March swing lows, JK Paper saw a strong rally, doubling from Rs 320 to Rs 640. However, in the last couple of months, prices entered a correction phase. Last week, despite a broad-based market sell-off, the stock outperformed and resumed its uptrend after finding support at the 61.8 percent retracement of the previous rally and at the prior breakout zone. On the daily chart, a bullish range breakout, accompanied by significant volume, signals positive momentum for the bulls. Therefore, we recommend buying JK Paper around Rs 490-486.
Strategy: Buy
Target: Rs 530
Stop-Loss: Rs 469
Zaggle Prepaid Ocean Services | CMP: Rs 460

The daily chart of Zaggle Prepaid shows a continuation breakout pattern known as a Flag. Volume analysis reveals above-average buying volume during the upmove compared to lower volume on down ticks. Additionally, the RSI, after a brief dip and finding support, has turned upward, confirming a bullish crossover with a smoothed indicator. These factors collectively suggest a strong positive bias for this stock. Hence, we recommend buying Zaggle Prepaid around Rs 460-455.
Strategy: Buy
Target: Rs 500
Stop-Loss: Rs 438
Vinay Rajani, CMT, Senior Technical and Derivative Analyst at HDFC Securities
Vijaya Diagnostic Centre | CMP: Rs 989

Vijaya Diagnostic Centre has broken out from the bullish "Flag" pattern on the weekly chart, indicating the continuation of an uptrend. The price rise was accompanied by healthy volumes. The diagnostic sector has been outperforming the market for the past couple of months. The stock has been forming higher tops and higher bottoms on the weekly charts. Short-term moving averages are trading above long-term moving averages.
Strategy: Buy
Target: Rs 1,000
Stop-Loss: Rs 924
Jubilant Ingrevia | CMP: Rs 794

Jubilant Ingrevia is on the verge of registering a fresh all-time high above Rs 839. The primary trend of the stock has been bullish, with higher tops and higher bottoms on the weekly and daily charts. Short-term moving averages are positioned above long-term moving averages. The chemical sector has started showing momentum on the upside. The stock has formed a strong rounding bottom formation on the monthly chart.
Strategy: Buy
Target: Rs 875
Stop-Loss: Rs 748
Jigar S Patel, Senior Manager - Equity Research at Anand Rathi
Som Distilleries and Breweries | CMP: Rs 111.8

Som Distilleries and Breweries reached a peak near Rs 149 in May 2024, but since then, it has experienced a significant decline of 29 percent in price. This sharp decline brought the stock down to a critical support level, forming a triple bottom pattern in the range of Rs 105-108. The triple bottom pattern, occurring at a previous demand zone, is often considered a bullish signal, suggesting that the stock has found strong support at these levels and may be poised for a reversal. On daily scale Bullish BAT pattern has been seen near Rs 110-109 which aligns with previous demand zone thus making it lucrative. These technical developments make the stock an attractive buy candidate at current levels. Based on this analysis, we recommend going long in the price range of Rs 110-112, targeting an upside of Rs 132. To manage risk, a stop-loss should be placed at Rs 101 on a daily closing basis, ensuring protection against any further downside.
Strategy: Buy
Target: Rs 132
Stop-Loss: Rs 101
Bank of Baroda | CMP: Rs 250.6

The nearly three-month-long bearish phase in Bank of Baroda appears to be nearing its end, as a bullish pattern emerges on the daily chart. The stock has formed a triple bottom structure in Rs 230-235 zone, a strong reversal signal indicating that the downward trend may be exhausted. Currently, Bank of Baroda is trading around Rs 250 level, and the triple bottom pattern has developed near the 200-day Exponential Moving Average (DEMA), adding further appeal to the stock at this point. Additionally, the daily RSI has broken through a bearish trendline along with bull divergence, signalling a shift in momentum towards the bullish side. Given these technical indicators, it is advised to go long on Bank of Baroda in the price range of Rs 248-250.
Strategy: Buy
Target: Rs 270
Stop-Loss: Rs 239
Disclaimer: The views and investment tips expressed by investment experts on Moneycontrol.com are their own and not those of the website or its management. Moneycontrol.com advises users to check with certified experts before taking any investment decisions.
Discover the latest Business News, Sensex, and Nifty updates. Obtain Personal Finance insights, tax queries, and expert opinions on Moneycontrol or download the Moneycontrol App to stay updated!
Find the best of Al News in one place, specially curated for you every weekend.
Stay on top of the latest tech trends and biggest startup news.


