


The Nifty Smallcap Index is down 40 percent from its peak, the Nifty Midcap Index is down 25 percent from its peak while Nifty 50 is down just 8 percent from the peak. In terms of investor sentiment, we seem to be somewhere between denial and desperation.
Drawdowns from peak are part and parcel of investing and no investor can avoid them. The pain comes basically in two forms – one the pain of seeing the portfolio investment going down and two which is the more painful one – seeing it stay low for a very long time.
On March 10, 2000, Nasdaq Composite Index saw it make a new all-time high. This event in itself wasn’t surprising given that the index was breaking all-time highs literally every other day since October of 1999.
What was different about this high was that it was the last hurrah and one that stayed as the all-time high for the index till a warm fuzzy day in June of 2015 when this was finally broken. In other words, if you had by chance invested in the index at the high point, you were required to wait for a decade and a half before you saw the price again.
Of the top 10 components by market-cap in 2000, only three were still in the top 10 when it came to market-cap in 2015 – Microsoft, Cisco and Intel.
In the 1930s, Dow Jones made a new high in April 1930. This high stood the test of time until it was finally broken in March 1954. 24 years under water is a long time for even the investor with the longest time horizon to keep your head when all around you, others are losing theirs (due apologies to Rudyard Kipling).
 (Image source: Capitalmind)
In India, the longest drawdown we have seen lasted nearly six years. The 2008 high for the Sensex was not broken till 2013 (2,122 calendar days). On a close-to-close basis, Nifty 50 made a new closing high on November 5, 2010.
As we are seeing currently, even then the differential between Nifty 50 and Nifty Smallcap 100 index was rather huge. While the large cap index was close to testing the all-time high, the smallcap index was still 24 percent away from its peak (requiring a move of 32 percent on the other side).
Markets, we are told move up like one travels in an escalator – slow and steady. At the time of reversal, it goes down in an elevator – fast and furious. The data chart below showcases the same by splitting the time markets took to achieve the next new high (Total period) and the time taken from the high to the lowest point (Fall Period).
Do note that to reduce clutter, only drawdowns that lasted more than a month were taken into account. Thus, the date mentioned in the table may or may not relate to the final new high that is formed.
 (Image source: Capitalmind)
While both Nifty Small Cap 100 and Nifty Mid Cap 100 have similar data length, Nifty Small Cap has lower number of draw-downs that lasted a month or more due to the one monster draw-down that started in 2008 and ended in 2016 – It did hit a high in 2015, but we are considering the close rather than Highs, the first time Nifty Small Cap 100 index closed above the high it saw in 2008 was in 2016.
Dollar cost averaging aka Systematic Investment Plan (SIP)We cannot time the market, experts tell us and hence it’s better to keep buying all the time for that overall averages our buying price and hence results in a much better return. But what kind of returns should one expect when one dollar cost averages over time?
We can look at that in two ways –
One, invest every day (eliminates biases such as Starting point) and compare the returns against each other.
Second would be to compare the rolling returns of the Indices over a certain period of time.
But first, the return generated by the major indices since 2004. The reason for using starting point of 2004 lies in the fact that Nifty Small Cap Index starts in 2004.
 (Image source: Capitalmind)
The above chart showcases the relative performance of the major indices in question. Since inception, Nifty 50 has delivered returns as on date close to returns by Nifty Small Cap with much lower volatility.
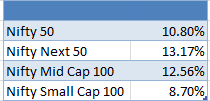
Rolling ReturnsBut even the above chart suffers from point to point Bias since our starting point is 2004. Lets hence use rolling returns and average it out for the 15 years.
 (Image source: Capitalmind)
Smallcap investing is risky is given, what is surprising is that for the additional risks one takes, the returns are sub-par. Here is the average rolling returns of the indices. Notice how Small Cap Index doesn't even beat Nifty other than on the extreme short term. In other words, the longer your holding period, lower will be your return and one that is lower than what you could have generated with much lower risk involved.
What if you invested every day since 2004, XIRR returns for the same are as below.
 (Image source: Capitalmind)
Smallcap stocks and indices are majorly down compared to the large cap. But as the evidence in the data presented herewith showcases, that may not be abnormal. Mutual Fund AUM if split based on style suggests that less than 10 percent is invested in smallcap funds. The data excludes Index funds and Exchange Traded Funds since EPFO inflow can skew the data significantly.
 (Image source: Capitalmind)The best will leave
One problem with a smallcap index is that:
- The best stocks grow to become mid-caps and thus leave the smallcap index
- The worst mid-caps become smallcaps and then become part of the small-cap index
Meaning: your best stocks leave you and the worst stocks of the higher category become part of you. Any business that loses its best people but has forced inflow of bad people from elsewhere will suffer, naturally.
Therefore, it may be better to buy smallcap stocks, selectively. Because the stocks could easily grow to become big. For example, Bajaj Finance was part of the Small cap Index till it exited in 2013 – and since then, has gone up 20x. That one stock alone would have been equal to 20 duds (like a Gitanjali Gems, or Amtek Auto, both of which were also part of the Smallcap index).
Effectively, if you only stick with the index, it will only cause heartburn as the best stocks leave – so it’s better to simply buy the stocks and stick with them.
Smallcap investing is hard but if you can get it right, the rewards can be enormous. But if you are not cut out for the same, investing in large cap and mid cap stocks/funds maybe the best way for a good return accompanied by good sleep.
(The author is Head of Compliance at Capitalmind. The article first appeared on Capitalmind. It has been reproduced with permission. You can read the original article here.)Discover the latest Business News, Sensex, and Nifty updates. Obtain Personal Finance insights, tax queries, and expert opinions on Moneycontrol or download the Moneycontrol App to stay updated!
Find the best of Al News in one place, specially curated for you every weekend.
Stay on top of the latest tech trends and biggest startup news.


