


The market made a sharp rebound from a day of correction and ended at a record closing high on June 16, aided by positive trend in global peers and a rally in banking and financial services and FMCG stocks.
The Nifty50 jumped 1.4 percent for the week to 18,826 and traded around 60 points away from its all-time intraday high, forming a long, bullish candlestick pattern on the weekly charts, while maintaining a higher-high formation for the twelfth week in a row, despite intermittent corrections and consolidations.
The index has maintained a five-week EMA (exponential moving average) since after crossing 13-week as well as 26-week EMA in second half of April, while momentum indicators RSI (relative strength index) at 65 and MACD maintaining positive crossover above zero line indicated positive signals.
Hence, the momentum is expected to take the index up to 19,000 mark in the coming days, with immediate support at 18,800, then 18,700-18,500 area, experts said.
"Amid the ambiguity, the Nifty is close to clocking fresh record highs and even reaching yet another milestone of 19,000. Considering a strong close above 18,800 and with recent laggard BFSI space participating in the move on Friday, we will not be surprised to see this achievement in the first half of this week," Sameet Chavan, Head Research, Technical and Derivatives at Angel One, said.
On the flip-side, he feels the base has shifted higher towards 18,600 – 18,550, before which 18,700 is to be considered as an immediate support.
Ashwin Ramani, Derivatives and Technical Analyst at SAMCO Securities, believes the Nifty will continue to be a ‘buy on dip’ market as long as it is trading above the 20 DEMA zone (18,559). "I think 18,500 will act as a strong support for Nifty," he said.
The broader markets remained in action throughout last week, with the Nifty Midcap 100 and Smallcap 100 indices rising 2.9 percent each.
Let's take a look at the top 10 trading ideas by experts for the next three-four weeks. Returns are based on the June 16 closing prices:
Expert: Nandish Shah, Senior Derivative and Technical Analyst at HDFC Securities
Surya Roshni: Buy | LTP: Rs 833 | Stop-Loss: Rs 780 | Target: Rs 895-935 | Return: 12 percent
The stock price has broken out on the daily chart on June 14 with sharp rise in volumes. Primary and intermediate trend turned positive as stock price is trading above all important moving averages.
Momentum Oscillators - RSI (11) and MFI(money flow index 10) is sloping upwards and placed above 60 on the daily chart, indicating strength in the current uptrend of the stock.

M&M Financial Services: Buy | LTP: Rs 305 | Stop-Loss: Rs 286 | Target: Rs 324-335 | Return: 10 percent
The stock price has broken out on the daily and weekly charts to close at highest level since August 2018. Stock price has been forming bullish higher top higher bottom formation on the weekly chart.
NBFC as a sector is looking strong on the daily chart. Plus DI (directional indicator) is trading above minus DI while ADX (average directional index) line is started sloping upwards, indicating stock price is likely to gather momentum in the coming days.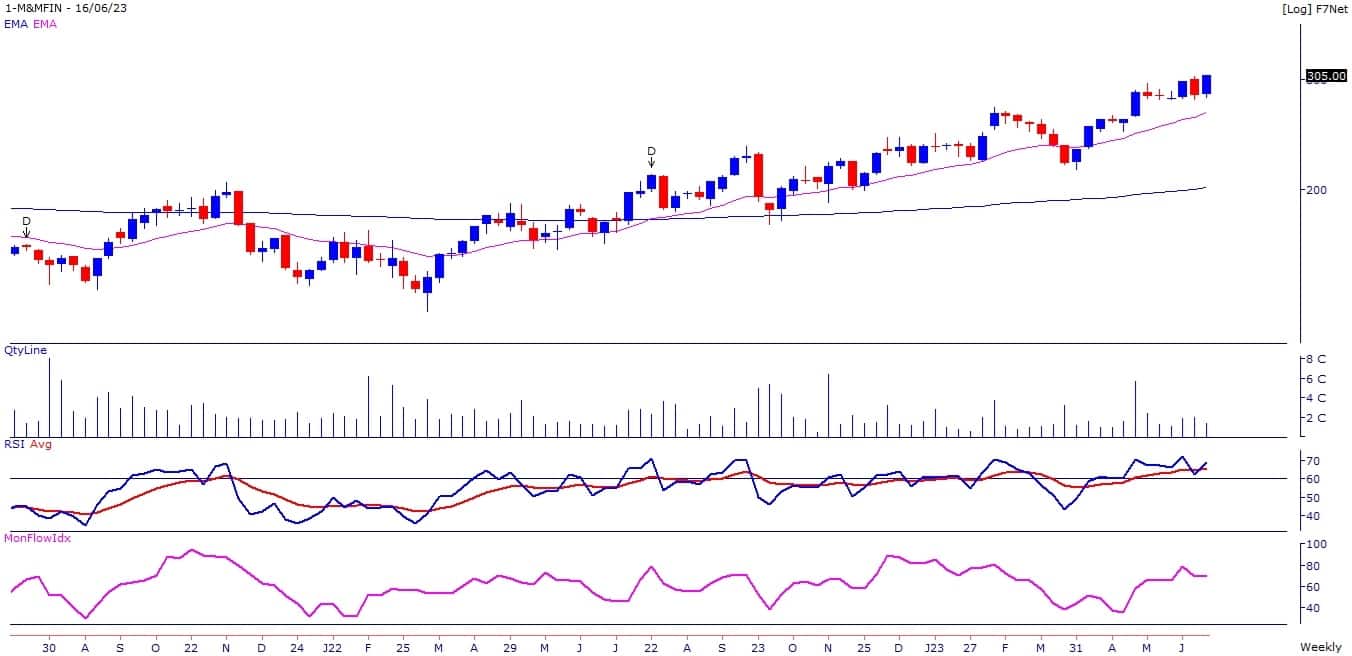
Vidhi Specialty Food Ingredients: Buy | LTP: Rs 394 | Stop-Loss: Rs 365 | Target: Rs 430-445 | Return: 13 percent
The stock price has broken out from the downward sloping trendline on the weekly chart, adjoining the highs of April 8, 2022 and April 28, 2023 with higher volumes. It has also broken out from the symmetrical triangle on the daily chart.
Momentum Oscillators - RSI (11) and MFI(10) is sloping upwards and placed above 60 on the daily and weekly chart, indicating strength in the current uptrend of the stock.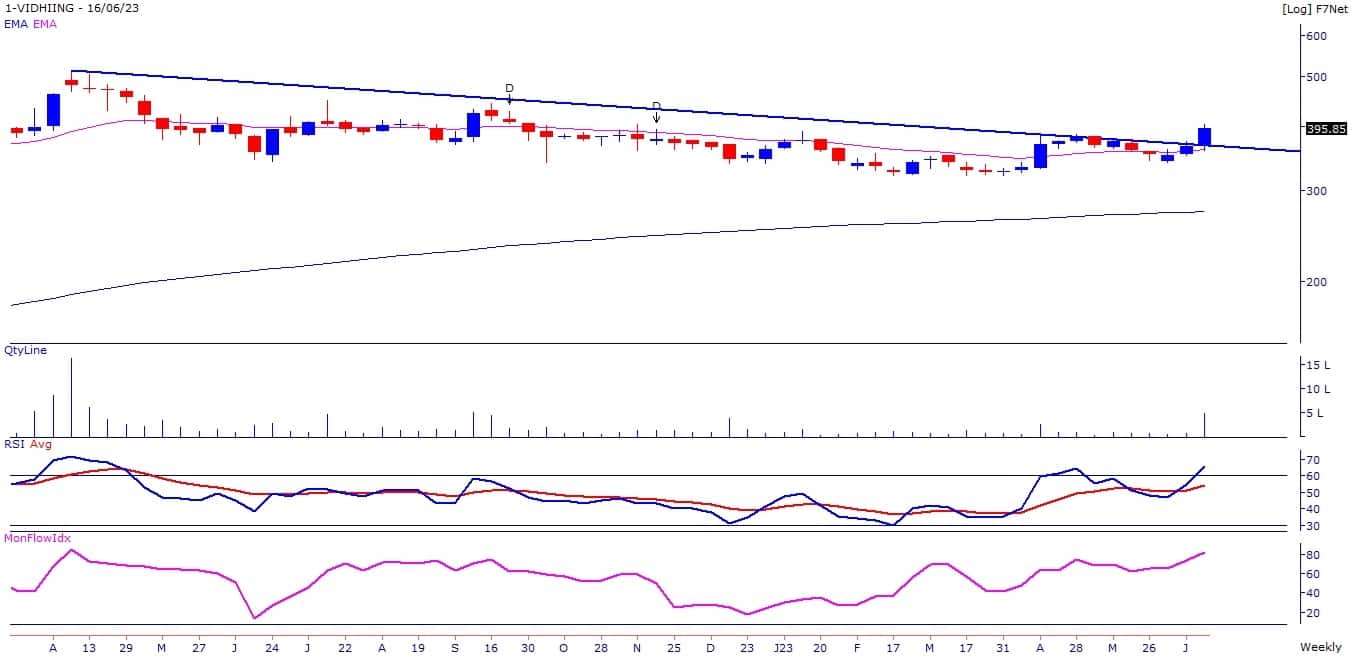
Expert: Shrikant Chouhan, Head of Equities Research (Retail) at Kotak Securities
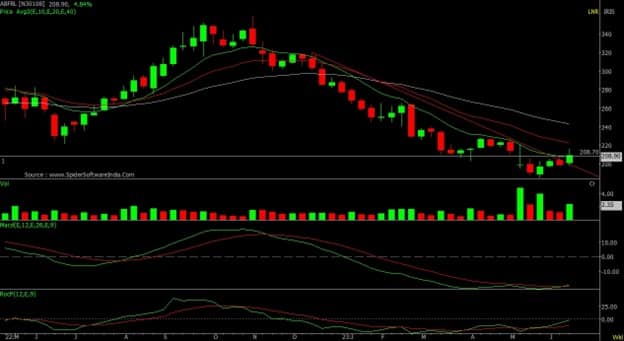
Aditya Birla Fashion & Retail: Buy | LTP: Rs 209 | Stop-Loss: Rs 180 | Target: Rs 250-275 | Return: 32 percent
The stock was at Rs 360 in November 2022 and from there it fell to Rs 180. It is a vertical drop and erosion of 50 percent that we saw in 7 months' time. However, if we consider the last two months, it was more in consolidation mode. It has started diverging positively on the weekly charts.
Based on the formation, we may see a pull-back-up move in the coming weeks. The strategy should be to buy at current levels with a final stop-loss at Rs 180 and on further declines if it corrects to Rs 190. On higher levels, it would face resistance near Rs 250 and Rs 275.
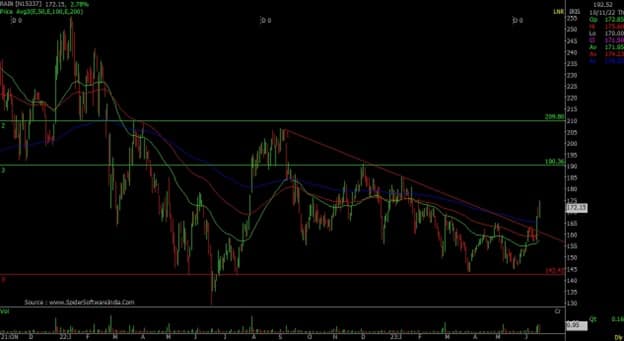
Rain Industries: Buy | LTP: Rs 172 | Stop-Loss: Rs 155 | Target: Rs 190-210 | Return: 22 percent
It is a classic case of a double bottom or higher bottom on the weekly chart. The stock has spent a lot of time above the Rs 140 level since May 2022, which acts as bullish support. It has also crossed all the longer-term EMAs on daily basis, which is indicating fresh inflows for the stock.
It is a buy at current levels and holds at Rs 160, which is taking support at 100-day EMA. Keep the stop-loss at Rs 155 for the target of Rs 190 and Rs 210.
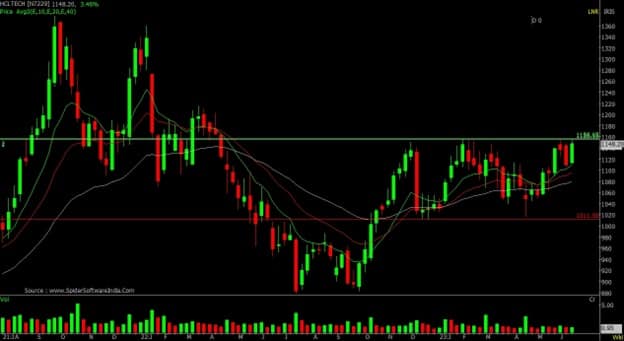
HCL Technologies: Buy | LTP: Rs 1,148 | Stop-Loss: Rs 1,080 | Target: Rs 1,250-1,350 | Return: 17.6 percent
The stock is in a rectangle consolidation between the trading range of Rs 1,000 and Rs 1,155. It has spent 7 months within the given trading range, however, in the last week, the stock formed a reversal formation, which may help the stock to move higher above Rs 1,155.
On the break of Rs 1,155, it would start moving towards the suggested pattern target of Rs 1,300. Buy the stock in two tranches. Buy 50 percent at current levels and the rest at Rs 1,110. Place a stop-loss at Rs 1,080, and resistance will be Rs 1,250 & Rs 1,350.
Expert: Mitesh Karwa, Research Analyst at Bonanza Portfolio
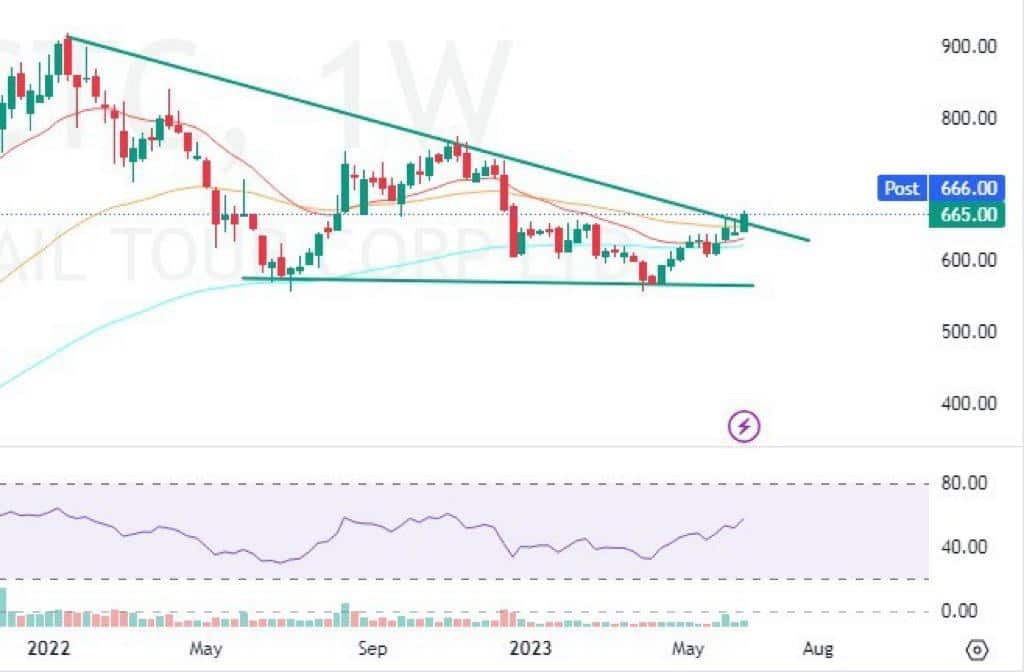
IRCTC: Buy | LTP: Rs 665 | Stop-Loss: Rs 627 | Target: Rs 720 | Return: 8 percent
IRCTC has broken out of a descending triangle pattern with a big bullish candlestick on the weekly timeframe and is also trading above important EMAs of 20/50/100/200 which indicates strength.
On the indicator front the Supertrend indicator is indicating a bullish continuation, momentum oscillator RSI (14) is at around 68 on the daily time frame indicating strength by sustaining above 50. The Ichimoku Cloud is also suggesting a bullish move as the price is trading above the conversion line, base line and cloud on the daily timeframe.
Observation of the above factors indicates that a bullish move in IRCTC is possible for targets upto Rs 720. One can initiate a buy trade in the range of Rs 660-665, with stop-loss of Rs 627 on daily closing basis.
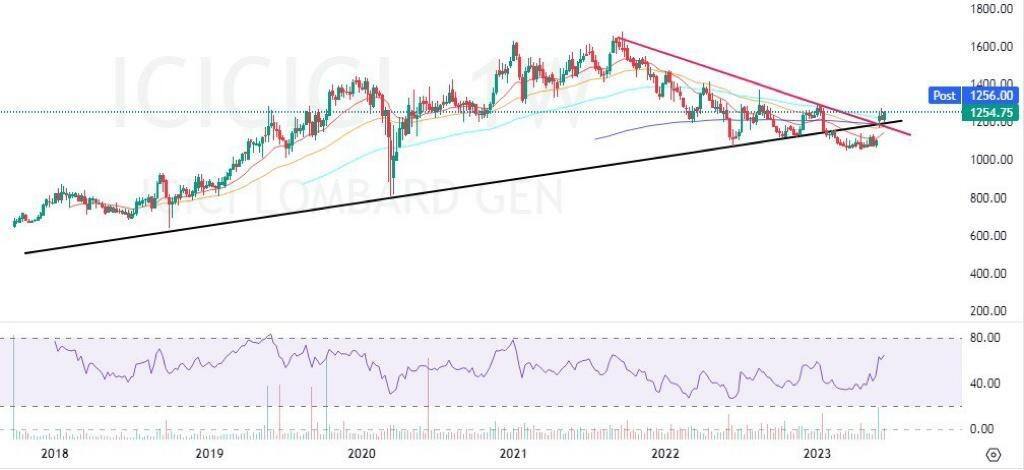
ICICI Prudential Life Insurance: Buy | LTP: Rs 534 | Stop-Loss: Rs 485 | Target: Rs 600 | Return: 12 percent
The stock has been sustaining above a downwards sloping trendline breakout on the weekly timeframe with a bullish candlestick pattern and is trading above all its important EMAs on the daily timeframe which indicates bullish strength.
The Supertrend indicator is also indicating a bullish continuation which supports the bullish view. Momentum oscillator RSI (14) is at around 74 on the daily time frame indicating strength by sustaining above 50. The Ichimoku Cloud is also suggesting a bullish move as the price is trading above the conversion line, base line and cloud.
Observation of the above factors indicates that a bullish move in ICICI Prudential is possible for target upto Rs 600. One can initiate a buy trade in between the range of Rs 530-534, with a stop-loss of Rs 485 on daily closing basis.
Expert: Jigar S Patel, Senior Manager - Equity Research at Anand Rathi
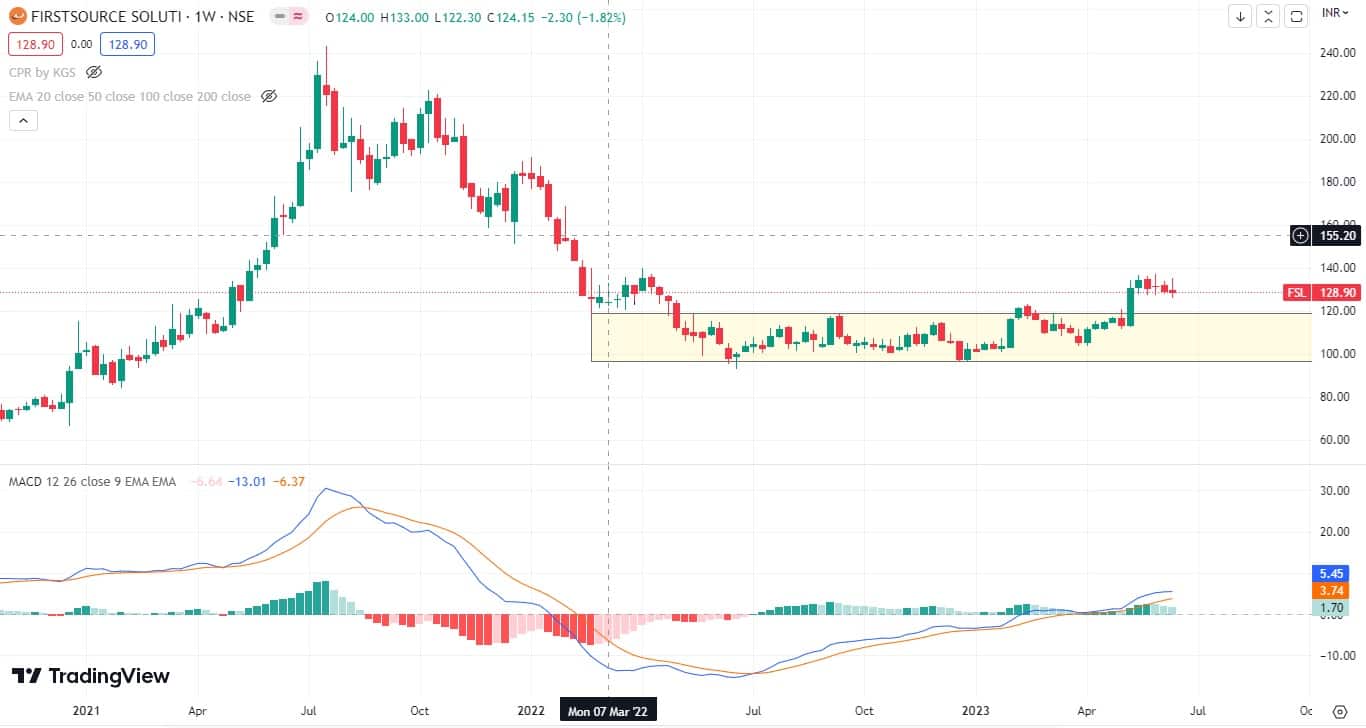
Firstsource Solutions: Buy | LTP: Rs 129 | Stop-Loss: Rs 112 | Target: Rs 155 | Return: 20 percent
For the last one year, the said counter has been consolidating in the range of Rs 100-120 approximately. Recently, it gave a clean breakout along with heavy volume which hints towards further upside in the counter.
Additionally, on weekly scale MACD is displaying bullish crossover exactly above zero line which is sign of further bullish momentum.
One can buy in the range of Rs 125-132, for a target of Rs 155 and stop-loss of Rs 114.
Expert: Ruchit Jain, Lead Research at 5paisa.com
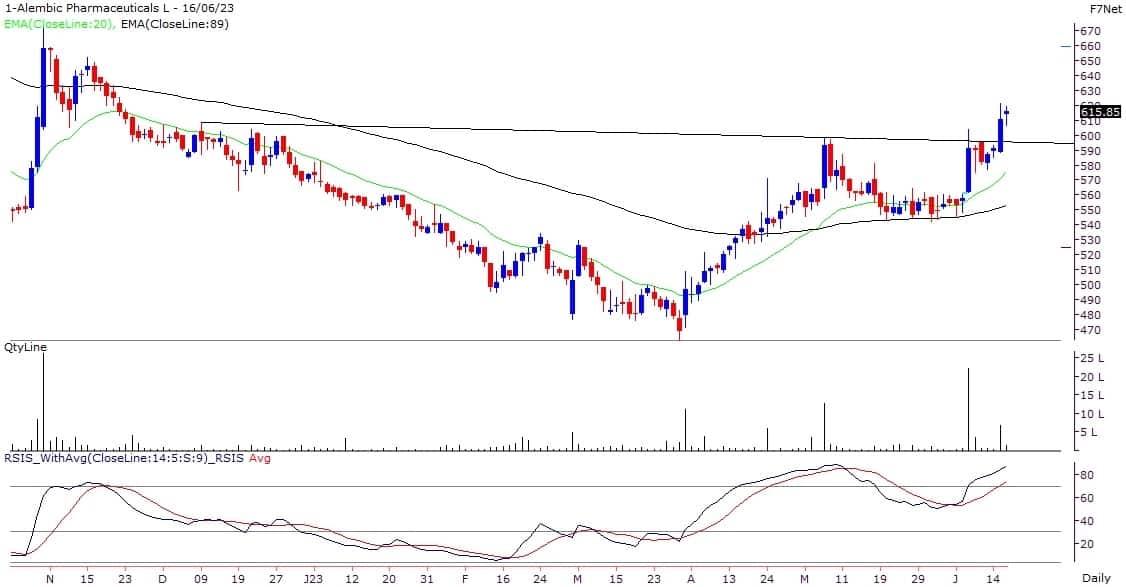
Alembic Pharma: Buy | LTP: Rs 616 | Stop-Loss: Rs 585 | Targets: Rs 655-668 | Return: 8 percent
The pharma stocks have witnessed a good momentum in last few weeks and the Nifty Pharma index showed outperformance during last week. Within this sector, Alembic Pharma has given breakout from a ‘Cup and Handle’ pattern on the daily chart which is a bullish pattern.
The stock is trading above its key moving average supports and the RSI oscillator is hinting at a positive momentum.
Hence, traders can buy this stock in the range of Rs 615-610 for potential near term targets of Rs 655 and Rs 668. The stop-loss on long positions should be placed below Rs 585.
IRCTC: Buy | LTP: Rs 665 | Stop-Loss: Rs 642 | Target: Rs 688-705 | Return: 6 percent
Stocks related to the railway sector have rallied sharply in last couple of months but IRCTC has shown a relative underperformance as it has consolidated within a range. The prices have given a breakout above the resistance zone of Rs 650-660 in Friday’s session and ended above that which confirms a breakout on the weekly chart as well.
The volumes on the breakout were high, the 20 DEMA has been acting as a support and the RSI oscillator is indicating a positive momentum.
Hence, short term traders can buy this stock in the range of Rs 665-660 for potential targets of Rs 688 and Rs 705, with a stop-loss below Rs 642.

Disclaimer: The views and investment tips expressed by investment experts on Moneycontrol.com are their own and not those of the website or its management. Moneycontrol.com advises users to check with certified experts before taking any investment decisions.
Discover the latest Business News, Sensex, and Nifty updates. Obtain Personal Finance insights, tax queries, and expert opinions on Moneycontrol or download the Moneycontrol App to stay updated!

Find the best of Al News in one place, specially curated for you every weekend.
Stay on top of the latest tech trends and biggest startup news.


