
Bears were in action on August 22, driving the benchmark indices down nearly 1 percent with subdued market breadth. A total of 1,704 shares saw selling pressure compared to 1,025 shares that gained on the NSE. The market is expected to remain rangebound until the frontline indices reclaim and sustain above last week's high. Below are some short-term trading ideas to consider:
Rajesh Palviya, Senior Vice President Research (Head Technical Derivatives) at Axis Securities
Olectra Greentech | CMP: Rs 1,553.5
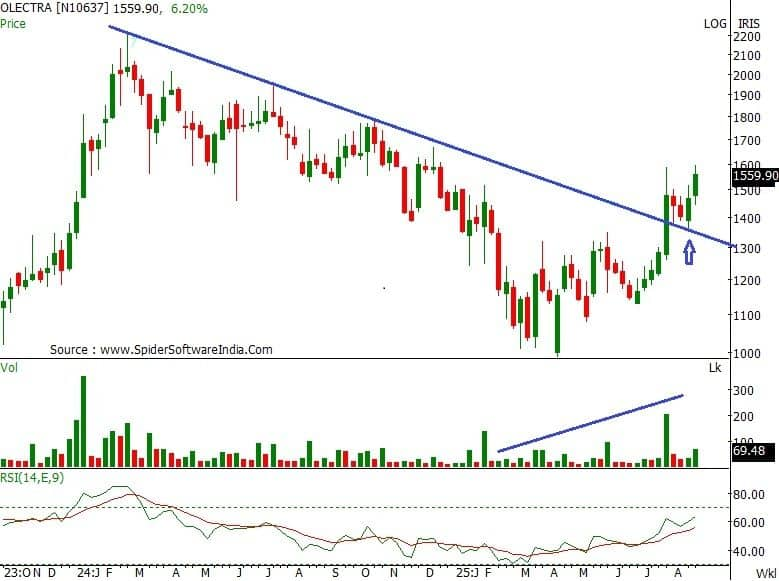
On the daily and weekly charts, Olectra Greentech has experienced a trend reversal, forming a series of higher tops and bottoms. It has also decisively surpassed the past one-year "down-sloping trendline" on a closing basis, which shows trend reversal. Huge volumes signal increased participation.
The stock is well placed above its 20, 50, 100, and 200-day SMA, which reconfirms a bullish trend, and these averages are also inching up along with the price rise, further confirming bullish sentiments. The daily, weekly, and monthly strength indicator RSI indicates rising strength. The daily and weekly "Bollinger Bands" buy signal indicates increased momentum.
Strategy: Buy
Target: Rs 1,685, Rs 1,800
Stop-Loss: Rs 1,500
Cummins India | CMP: Rs 3,916

With the current close, Cummins India has decisively surpassed the past one-year "multiple resistance" zone of Rs 3,870 levels on a closing basis, indicating bullish sentiments. The stock is well placed above its 20, 50, 100, and 200-day SMA, which reconfirms a bullish trend, and these averages are also inching up along with the price rise, further confirming bullish sentiments. The daily, weekly, and monthly strength indicator RSI indicates rising strength.
Strategy: Buy
Target: Rs 4,060, Rs 4,200
Stop-Loss: Rs 3,835
Godawari Power and Ispat | CMP: Rs 238.61
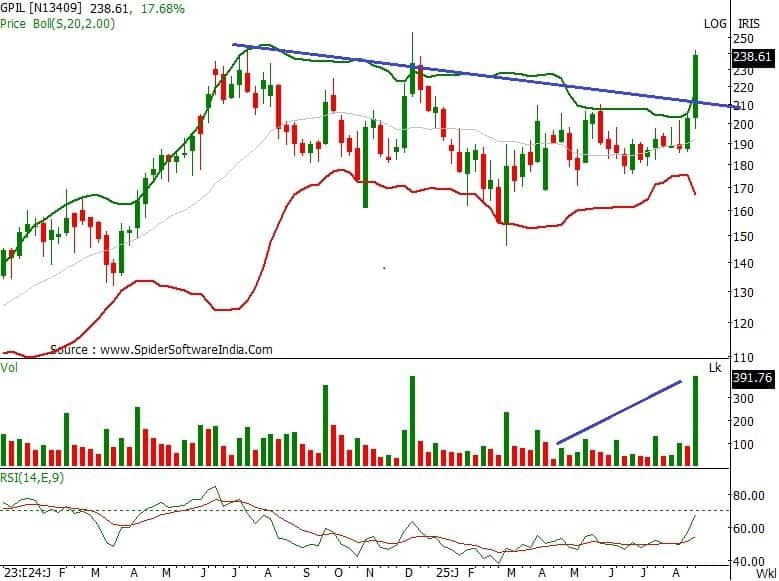
On the weekly chart, Godawari Power and Ispat has decisively surpassed the past one-year "down-sloping trendline" breakout at Rs 220 levels on a closing basis, indicating a strong comeback of bulls. This breakout is accompanied by huge volumes, which signal increased participation. The daily and weekly "Bollinger Bands" buy signal indicates increased momentum. The daily, weekly, and monthly strength indicator RSI indicates rising strength.
Strategy: Buy
Target: Rs 277, Rs 300
Stop-Loss: Rs 223
Rajesh Bhosale, Technical Analyst at Angel One
Aditya Birla Capital | CMP: Rs 286.35
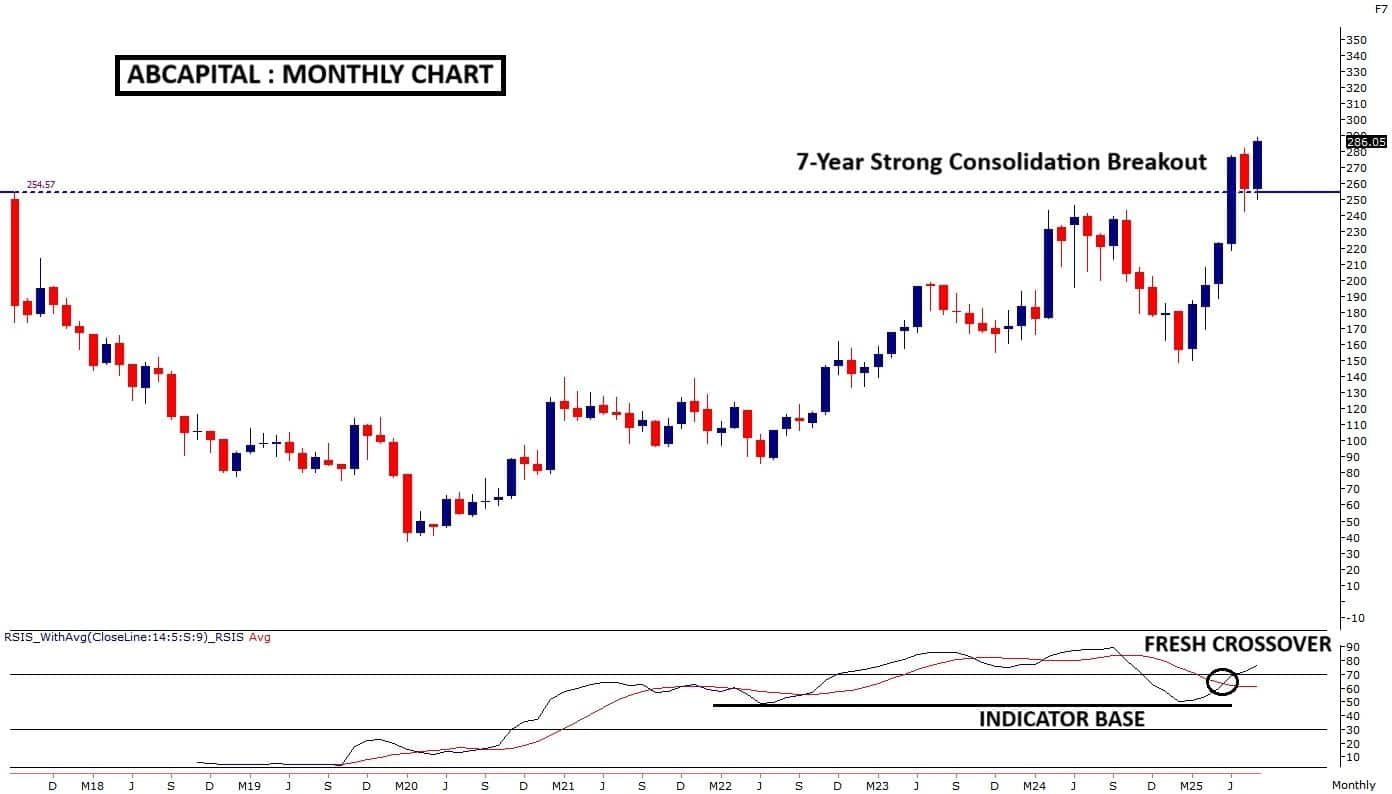
On the monthly chart, Aditya Birla Capital has registered a breakout after a prolonged seven-year consolidation phase, often signaling the onset of a strong directional move. The breakout is well-supported by robust volume action, with higher volumes on advances and relatively lower volumes on declines, reflecting sustained accumulation and lending credibility to the move.
From an indicator standpoint, the RSI smoothened had earlier stabilized near the 50 level and has now turned upward with a bullish crossover, indicating fresh positive momentum and further strengthening the bullish outlook.
Strategy: Buy
Target: Rs 312
Stop-Loss: Rs 273
Asahi India Glass | CMP: Rs 882.85
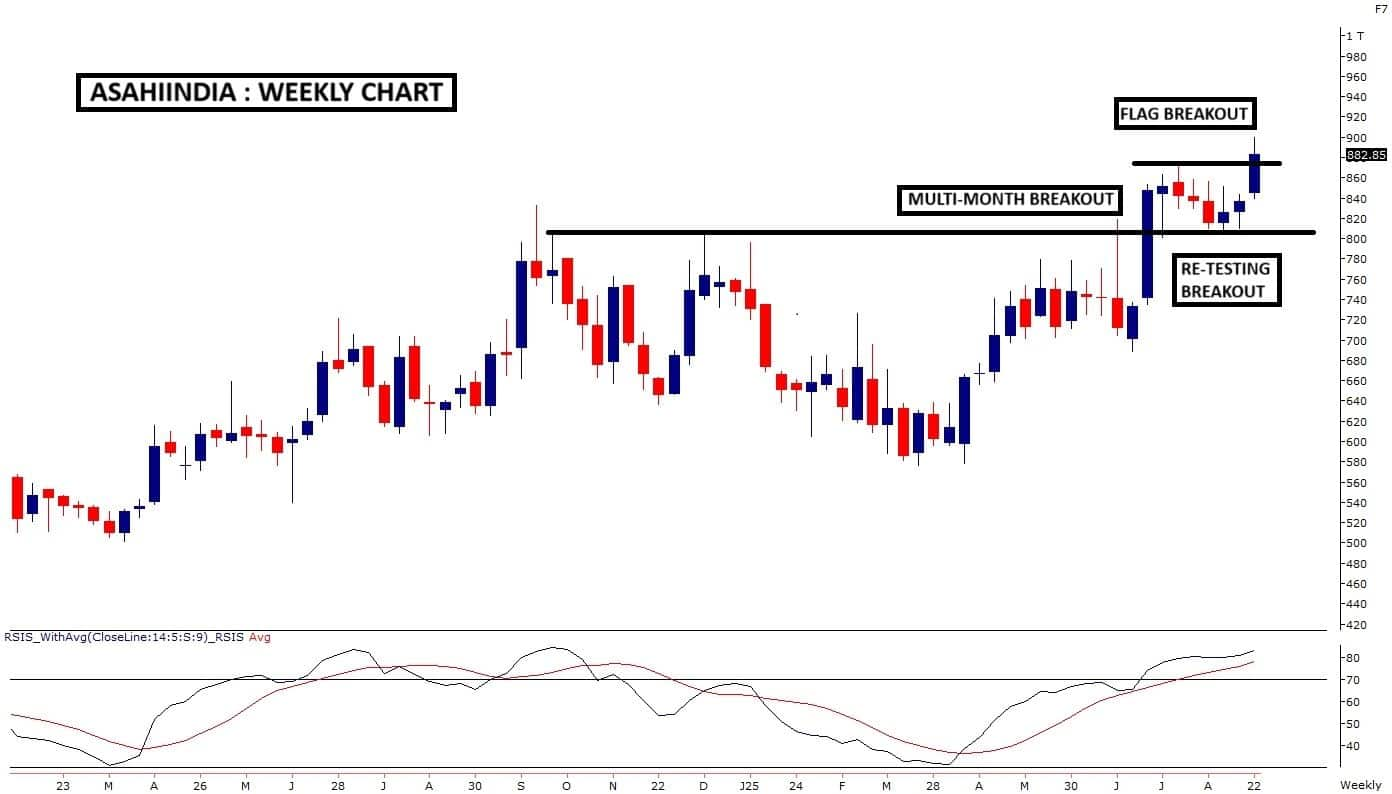
Asahi India Glass witnessed a multi-month breakout in July, followed by a strong up-move. After a brief consolidation over the past couple of weeks, prices have resumed their uptrend this week with a continuation flag breakout. Currently trading in uncharted territory, the stock reflects inherent strength and clear outperformance against the broader markets. The breakout is further validated by a favourable indicator setup and the formation of a bullish Marubozu candle.
Strategy: Buy
Target: Rs 975
Stop-Loss: Rs 837
Rashtriya Chemicals and Fertilizers | CMP: Rs 158.9

During the last week, chemical and fertilizer stocks remained in focus, and Rashtriya Chemicals and Fertilizers (RCF) too showcased notable strength. On the weekly chart, it registered a breakout from a strong bullish reversal pattern, the “Inverse Head and Shoulder,” accompanied by above-average volumes. Moreover, on the daily chart, the RSI smoothened crossed above the 60 mark, confirming robust positive momentum in the counter.
Strategy: Buy
Target: Rs 175
Stop-Loss: Rs 149
Anshul Jain, Head of Research at Lakshmishree Investments
Pidilite Industries | CMP: Rs 3,087.2
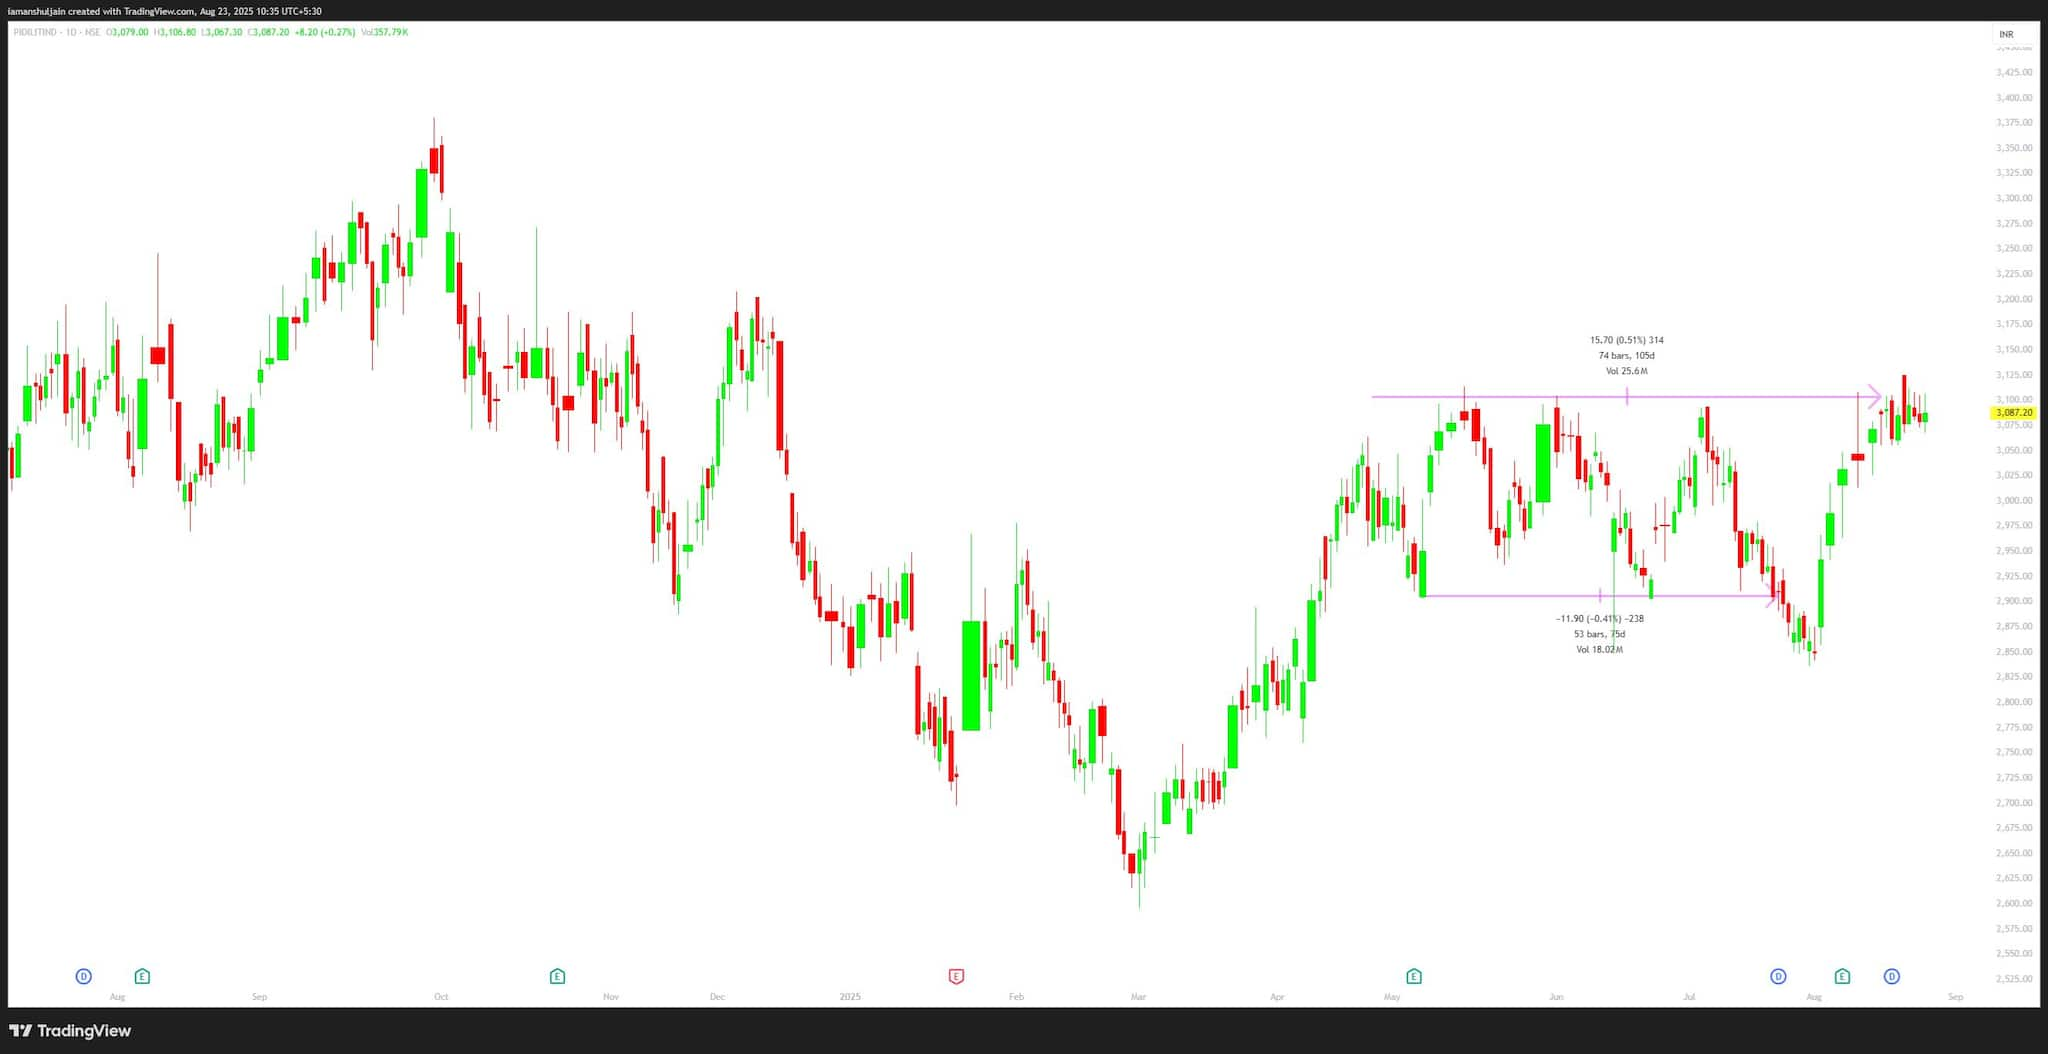
Pidilite recently posted a failed breakdown of its box pattern, defined by outer boundaries at Rs 2,900–3,110. The stock sharply rebounded from the box low and is now consolidating near the box high with an inside bar formation. The bear trap at lower levels has added strength to the structure, as failed breakdowns often act as strong bullish signals. Current price action suggests accumulation around resistance.
A breakout and sustained move above Rs 3,120 will confirm bullish continuation and likely propel the stock higher. The immediate upside target stands around Rs 3,400 levels, offering a strong risk-reward opportunity for investors.
Strategy: Buy
Target: Rs 3,400
Stop-Loss: Rs 3,000
TD Power Systems | CMP: Rs 518

TD Power Systems on the daily charts is showing a classic base-on-base formation, a highly bullish continuation structure. The first base was a 108-day-long rounding pattern, followed by a second base of 63 days, also rounding in nature. Such sequential formations typically indicate strong institutional accumulation and suggest that the stock is setting up for a powerful breakout.
However, confirmation will only come on a decisive move and sustained close above Rs 530. Once that occurs, the stock is likely to gather momentum and head towards Rs 570 initially, followed by Rs 600 in the near term.
Strategy: Buy
Target: Rs 617.7
Stop-Loss: Rs 500
Netweb Technologies India | CMP: Rs 2,322.4
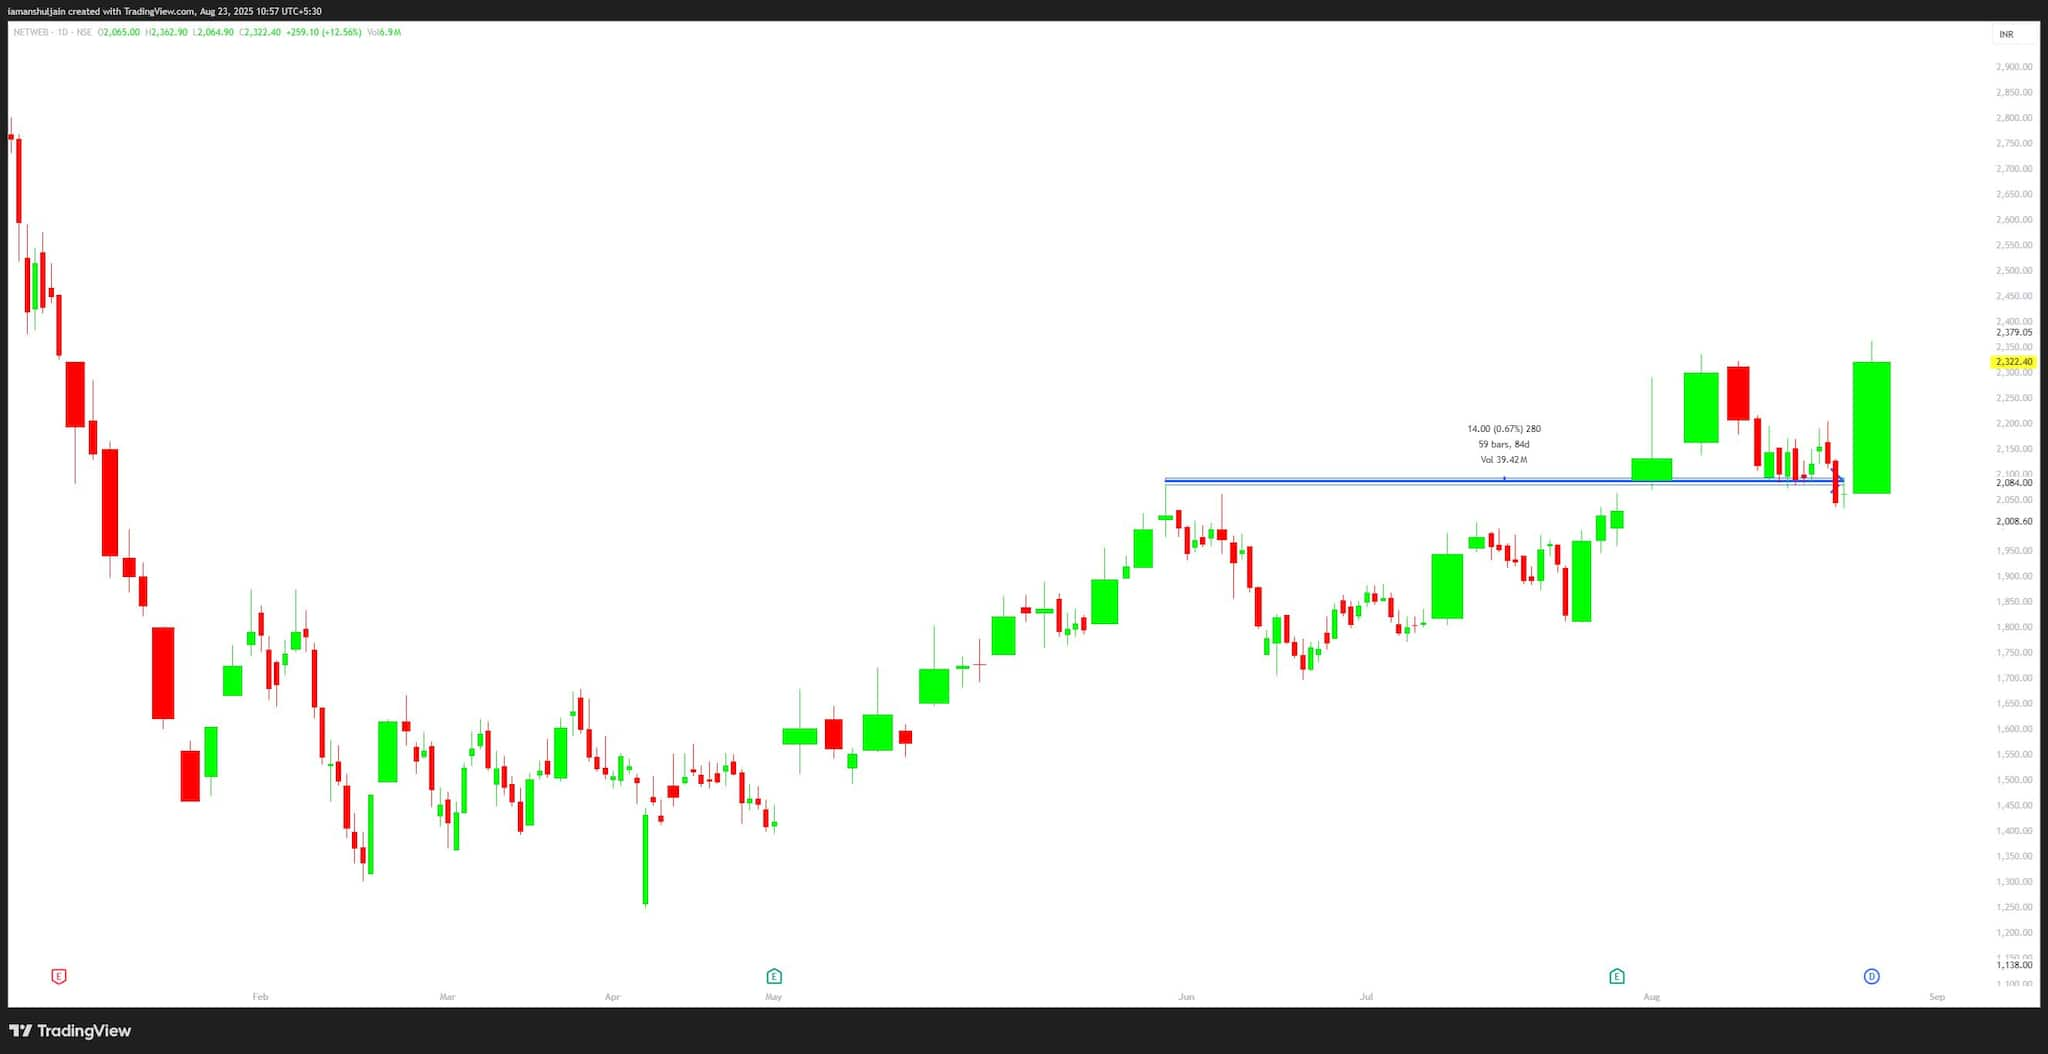
Netweb posted a 46-day cup and handle breakout, followed by a 12-day pullback and a weak shakeout of longs. The stock has now made a strong comeback, with volumes surging over 870% against its 50-day EMA — a clear sign of institutional accumulation. Price action is currently hovering around the key resistance level of Rs 2,380. A decisive breach and sustained close above Rs 2,380 will act as the trigger for the next strong leg of the uptrend. Once confirmed, the stock is poised to rally sharply and head towards Rs 2,800, supported by momentum and fresh buying interest.
Strategy: Buy
Target: Rs 2,800
Stop-Loss: Rs 2,100
Disclaimer: The views and investment tips expressed by investment experts on Moneycontrol.com are their own and not those of the website or its management. Moneycontrol.com advises users to check with certified experts before taking any investment decisions.
Discover the latest Business News, Sensex, and Nifty updates. Obtain Personal Finance insights, tax queries, and expert opinions on Moneycontrol or download the Moneycontrol App to stay updated!