


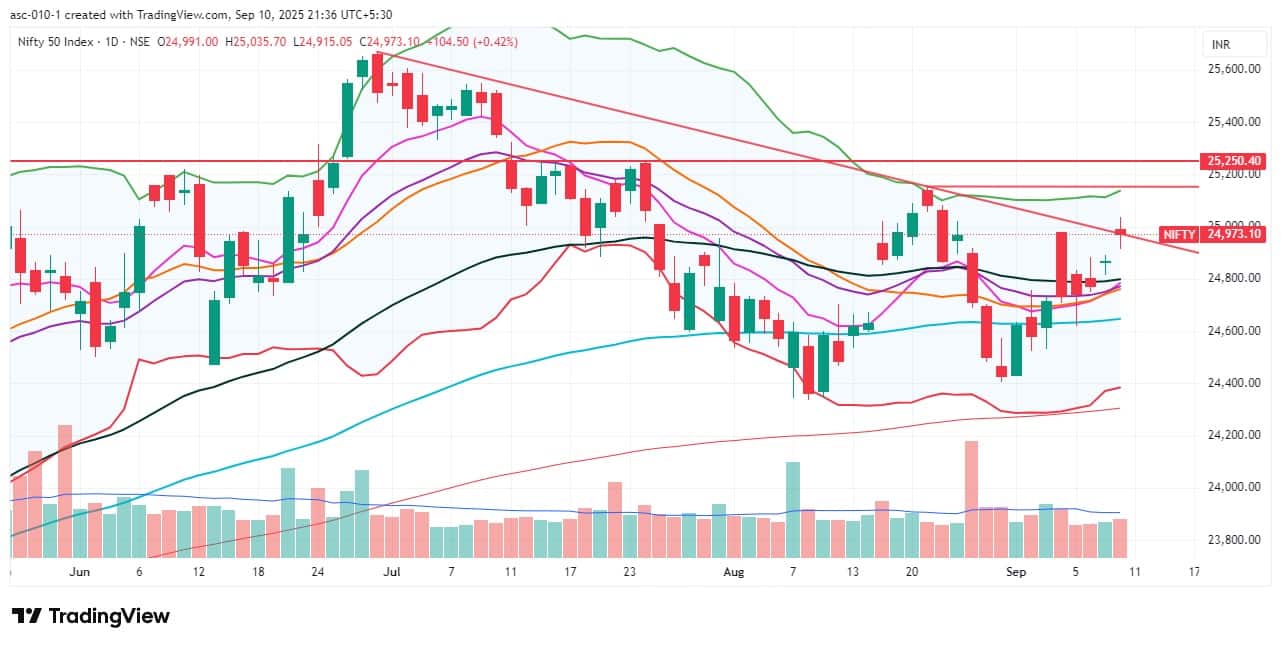
Bulls continued their support to the market for the sixth straight day, taking the Nifty 50 above 25,000 intraday on September 10. The index advanced 105 points and closed at a more than two-week high, trading firmly above all key moving averages, with further strength observed in momentum indicators and oscillators. If the Nifty 50 decisively closes above 25,000, the lower high–lower low formation will be negated, and a rally toward 25,150–25,250 cannot be ruled out. However, on the downside, 24,900–24,800 is expected to act as immediate key support, according to experts.
Here are 15 data points we have collated to help you spot profitable trades:
1) Key Levels For The Nifty 50 (24,973)
Resistance based on pivot points: 25,021, 25,049, and 25,095
Support based on pivot points: 24,929, 24,900, and 24,854
Special Formation: The Nifty 50 formed a Doji or high wave-like candlestick pattern on the daily charts, indicating a tug of war between bulls and bears. It closed at the falling resistance trendline, a breakout above which could drive another leg of the upmove. The RSI climbed further to 56.81 with a positive crossover, while the MACD, with a bullish crossover, inched closer to the zero line and the histogram gained more strength. All of this indicates a potential continuation of bullish momentum.
2) Key Levels For The Bank Nifty (54,536)
Resistance based on pivot points: 54,664, 54,736, and 54,852
Support based on pivot points: 54,430, 54,358, and 54,242
Resistance based on Fibonacci retracement: 54,107, 55,586
Support based on Fibonacci retracement: 54,400, 53,400
Special Formation: The Bank Nifty formed a Doji candlestick pattern on the daily timeframe, indicating indecision between bulls and bears. The index traded above the 5-day and 10-day EMAs but could not sustain above the 20-day EMA and the midline of the Bollinger Bands — levels that need to be reclaimed for a further upward trend. The RSI maintained its bullish crossover, rising to 45.24, while the MACD gave a positive crossover, though it remained below the zero line. The histogram also turned positive. All of this indicates emerging bullish signals, though confirmation is still awaited.

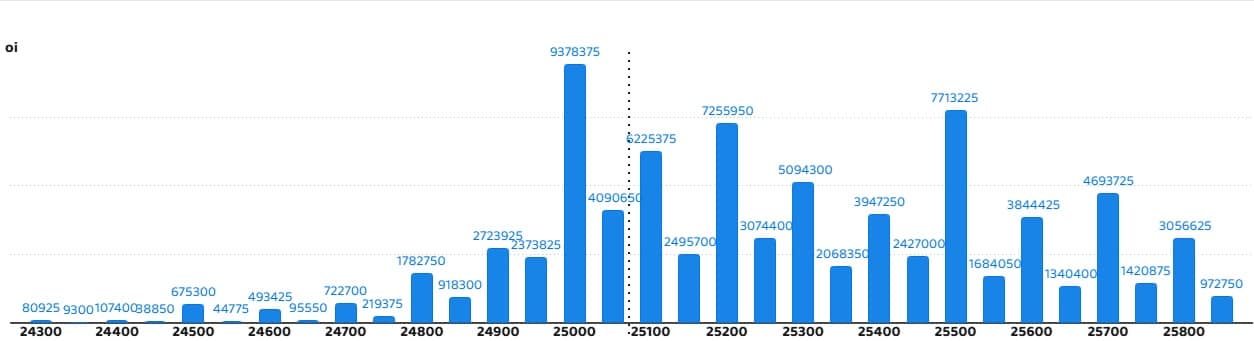
According to the weekly options data, the maximum Call open interest was placed at the 25,000 strike (with 93.78 lakh contracts). This level can act as a key resistance for the Nifty in the short term. It was followed by the 25,500 strike (77.13 lakh contracts), and the 25,200 strike (72.55 lakh contracts).
Maximum Call writing was observed at the 25,000 strike, which saw an addition of 38.77 lakh contracts, followed by the 25,200 and 25,100 strikes, which added 36.34 lakh and 33.74 lakh contracts, respectively. The maximum Call unwinding was seen at the 24,900 strike, which shed 12.15 lakh contracts, followed by the 24,800 and 24,850 strikes, which shed 7.94 lakh and 6.89 lakh contracts, respectively.
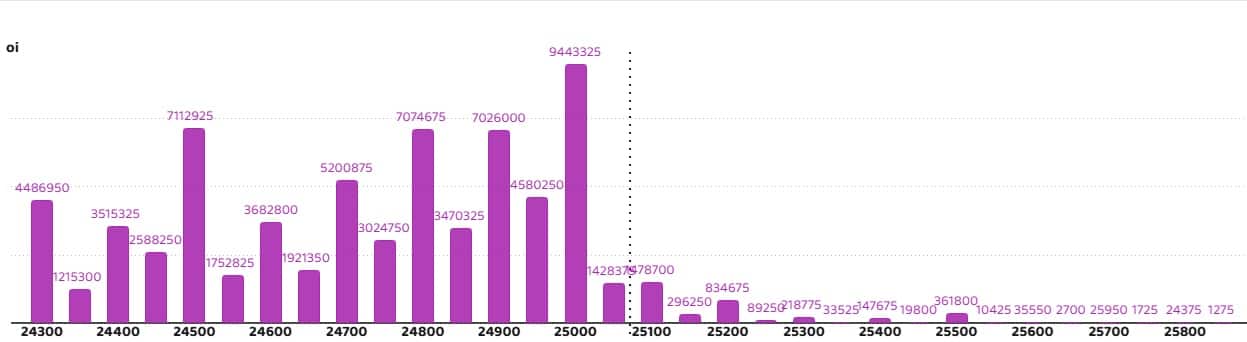
On the Put side, the 25,000 strike holds the maximum Put open interest (with 94.43 lakh contracts), which can act as a key level for the Nifty. It was followed by the 24,500 strike (71.12 lakh contracts) and the 24,800 strike (70.74 lakh contracts).
The maximum Put writing was placed at the 25,000 strike, which saw an addition of 72.89 lakh contracts, followed by the 24,950 and 24,900 strikes, which added 42.39 lakh and 36.77 lakh contracts, respectively. There was hardly any Put unwinding seen in the 24,300-25,850 strike band.
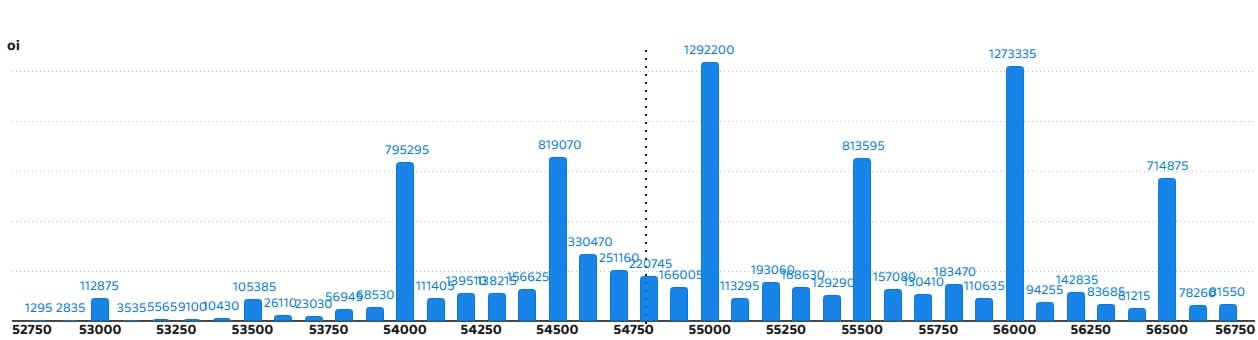
5) Bank Nifty Call Options Data
According to the monthly options data, the 55,000 strike holds the maximum Call open interest, with 12.92 lakh contracts. This can act as a key resistance level for the index in the short term. It was followed by the 56,000 strike (12.73 lakh contracts) and the 54,500 strike (8.19 lakh contracts).
Maximum Call writing was observed at the 54,600 strike (with the addition of 1.89 lakh contracts), followed by the 54,700 strike (91,735 contracts), and the 54,800 strike (57,120 contracts). The maximum Call unwinding was seen at the 54,200 strike, which shed 1.54 lakh contracts, followed by 54,000 and 55,000 strikes, which shed 1.4 lakh and 1.33 lakh contracts, respectively.
6) Bank Nifty Put Options Data
On the Put side, the maximum Put open interest was placed at the 54,000 strike (with 14.19 lakh contracts), which can act as a key support level for the index. This was followed by the 54,500 strike (9.47 lakh contracts) and the 53,000 strike (9.3 lakh contracts).
The maximum Put writing was observed at the 54,500 strike (which added 2.26 lakh contracts), followed by the 54,800 strike (95,830 contracts) and the 54,600 strike (84,035 contracts). The maximum Put winding was seen at the 54,300 strike, which shed 31,605 contracts, followed by the 54,100 and 52,800 strikes, which shed 22,295 and 7,735 contracts, respectively.


The Nifty Put-Call ratio (PCR), which indicates the mood of the market, rose to 1.15 on September 10, compared to 1.08 in the previous session.
The increasing PCR, or being higher than 0.7 or surpassing 1, means traders are selling more Put options than Call options, which generally indicates the firming up of a bullish sentiment in the market. If the ratio falls below 0.7 or moves towards 0.5, then it indicates selling in Calls is higher than selling in Puts, reflecting a bearish mood in the market.

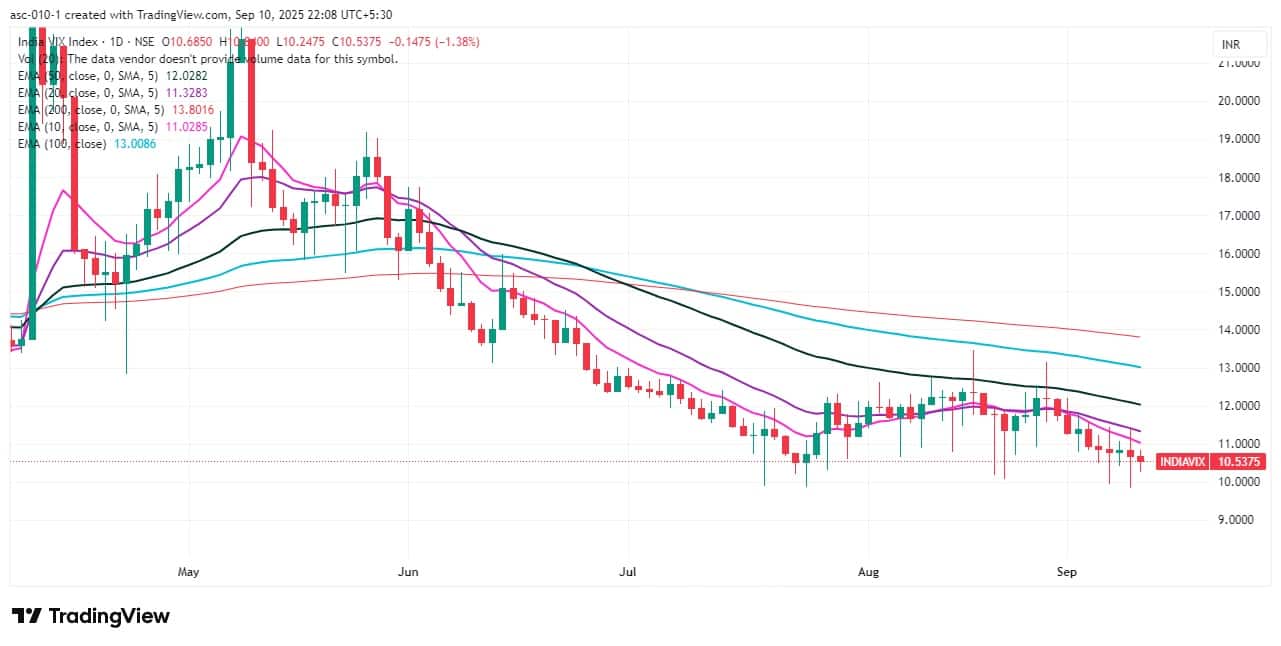
9) India VIX
The fear gauge, India VIX, declined further by 1.38 percent to 10.54 — its lowest closing level since July 23 — signaling more comfort for the bulls and a low-uncertainty environment.
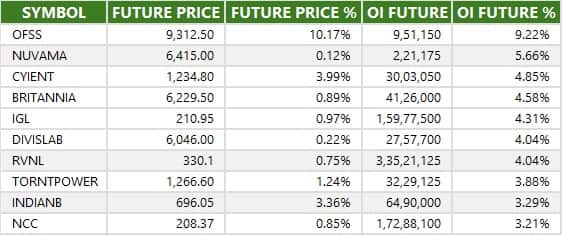
A long build-up was seen in 66 stocks. An increase in open interest (OI) and price indicates a build-up of long positions.
11) Long Unwinding (21 Stocks)
21 stocks saw a decline in open interest (OI) along with a fall in price, indicating long unwinding.

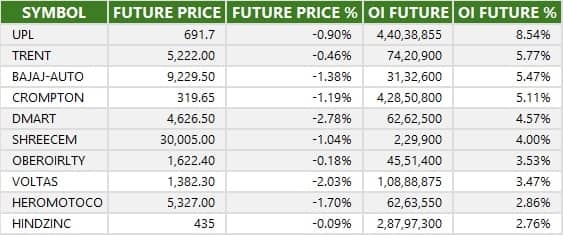
12) Short Build-up (33 Stocks)
33 stocks saw an increase in OI along with a fall in price, indicating a build-up of short positions.
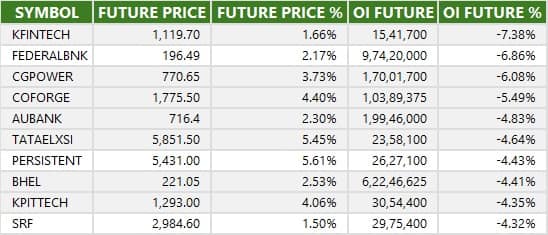
13) Short-Covering (94 Stocks)
94 stocks saw short-covering, meaning a decrease in OI, along with a price increase.
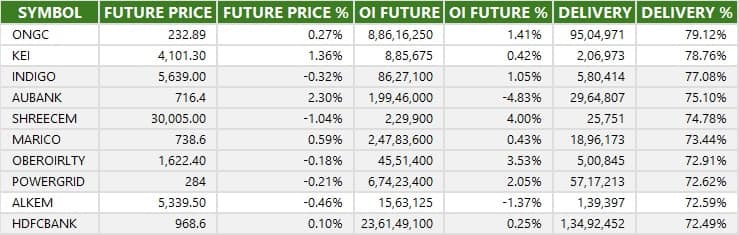
Here are the stocks that saw a high share of delivery trades. A high share of delivery reflects investing (as opposed to trading) interest in a stock.
Securities banned under the F&O segment include companies where derivative contracts cross 95 percent of the market-wide position limit.
Stocks added to F&O ban: Nil
Stocks retained in F&O ban: RBL Bank
Stocks removed from F&O ban: Nil
Disclaimer: The views and investment tips expressed by experts on Moneycontrol are their own and not those of the website or its management. Moneycontrol advises users to check with certified experts before taking any investment decisions.Disclosure: Moneycontrol is a part of the Network18 group. Network18 is controlled by Independent Media Trust, of which Reliance Industries is the sole beneficiary.Discover the latest Business News, Sensex, and Nifty updates. Obtain Personal Finance insights, tax queries, and expert opinions on Moneycontrol or download the Moneycontrol App to stay updated!
Find the best of Al News in one place, specially curated for you every weekend.
Stay on top of the latest tech trends and biggest startup news.


