Google is introducing a feature for its Maps platform on mobile phones that will provide essential information about COVID-19, which has now become a regular part of daily lives, at least of the people travelling and commuting. The new layer will give provide essential information about the rate of infections.
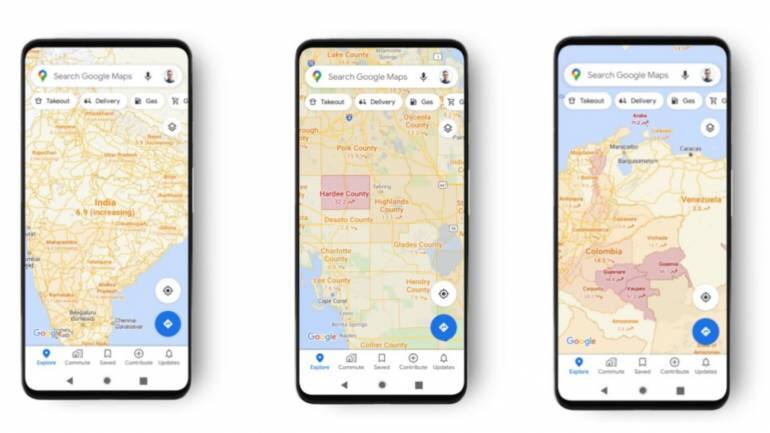
When you open Google Maps, tap the ‘layers’ button on the top right-hand corner of the screen and click on ‘COVID-19 Info’. This will give you the seven-day average data of new COVID-19 cases per 100,000 people for the area of the map you are looking at.
Additionally, a label will indicate whether the cases are trending up or down with appropriate colour coding. Colour coding will also help you distinguish the density of new cases in an area. Moreover, you can also access trending case data for all 220 countries and territories supported by Google Maps. The data provides detailed information on cases in states, provinces, counties, and cities.
The data presented on Google Maps is gathered from multiple authoritative sources, including the New York Times, Johns Hopkins University, and Wikipedia. These sources receive data from public health organisations like the World Health Organisation, government health ministries, and state and local agencies.
Google also added that the data provided on Google Maps is the same as the data showcased in its Search engine and is only being expanded to Maps.
Source

Discover the latest Business News, Sensex, and Nifty updates. Obtain Personal Finance insights, tax queries, and expert opinions on Moneycontrol or download the Moneycontrol App to stay updated!
Find the best of Al News in one place, specially curated for you every weekend.
Stay on top of the latest tech trends and biggest startup news.