The market is broadly expected to be in a consolidation mode for now, though the Nifty50 started off the November series on a positive note on October 27, closing above the 19,000 mark after severe correction in the last six trading sessions. In case of continuation of Friday's uptrend, the index may face resistance at 19,200-19,300, whereas on the lower side, the recent low 18,840 or 200-day EMA (exponential moving average) will be critical for further steep fall towards 50-week EMA (18,670), experts said.
On Friday, the Nifty50 jumped 190 points or 1 percent to 19,047 after falling 5 percent in six straight sessions, forming a bullish candlestick pattern, which resembles Bullish Marubozu Opening candlestick pattern on the daily charts. It is a bullish reversal candlestick pattern formed at the downtrend.
The BSE Sensex climbed 635 points or 1 percent to 63,783, while the broader markets performed much better than the benchmarks, as the Nifty Midcap 100 and Smallcap 100 indices surged 1.5 percent and 2 percent respectively.
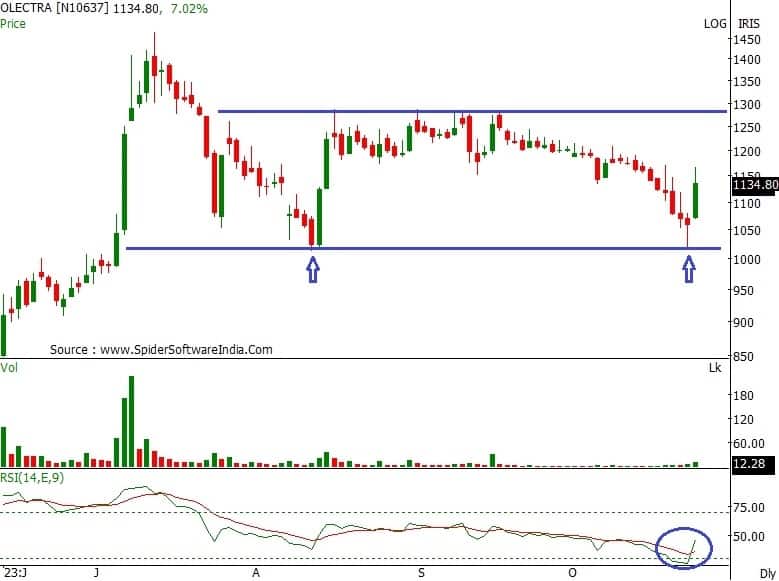
Stocks that outperformed broader markets included Olectra Greentech, Welspun India, and GMM Pfaudler. Olectra Greentech bounced back sharply by more than 7 percent to Rs 1,136 after nine-day of correction and taking a support exactly at August lows. The stock has formed bullish candlestick pattern with upper shadow on the daily charts with above average volumes and closed above 100-day EMA (Rs 1,088).
Welspun India rallied 10.5 percent on Friday to Rs 145.7 on the NSE, the highest closing level since January 21 last year and formed robust bullish candlestick pattern on the daily timeframe with strong volumes. The stock maintained downward sloping resistance trendline breakout in the mid of October as well as stayed above all key moving averages (20, 50, 100 and 200-day EMA), which is a positive sign.
GMM Pfaudler rebounded after four-day of downward move and closed 4.8 percent higher at Rs 1,733. The stock formed long bullish candlestick pattern with long upper shadown on the daily scale, indicating pressure at higher levels, but closed above 50-day EMA (Rs 1,726) and tested 20-day EMA (Rs 1,768) during the day. The holding 20-day EMA is crucial for further uptrend.
Here's what Rajesh Palviya of Axis Securities recommends investors should do with these stocks when the market resumes trading today:
On the daily and weekly charts, the stock has witnessed buying momentum forming a series of higher tops and bottoms formation. Recently the stock has recaptured its 20-day and 50-day SMA (simple moving average) and rebounded very sharply showing buying force on short term corrections.
The stock is well placed above its 20, 50, 100 and 200-day SMA which reconfirms bullish trend. This buying momentum was accompanied with huge volumes which signifies increased participation.
The daily and weekly "Bollinger band" buy signal indicates increased momentum. The daily, weekly and monthly strength indicator RSI (relative strength index) is in positive terrain which shows rising strength.
Investors should buy, hold and accumulate this stock with an expected upside of Rs 170-190, with downside support zone of Rs 130-115 levels.

Since July 2023, the stock is consolidating within Rs 1,300-1,020 levels indicating a short term pause in its strong up trend. In the past couple of sessions, the stock has sharply rebounded from its lower end "multiple support zone" of Rs 1,020 levels along with huge volumes. This indicates buying interest at the support zone.
The stock is well placed above its 100 and 200-day SMA which reconfirms bullish trend in medium to long trend. The monthly strength indicator RSI is in bullish terrain indicating sustained strength on a long term chart.
Investors should buy, hold and accumulate this stock with an expected upside of Rs 1,300-1,430, with downside support zone of Rs 1,020-1,000 levels.
With current week's low, the stock has corrected towards its prior breakout zone of Rs 1,650-1,630 and rebounded very sharply. The weekly price action has formed a "Hammer" candlestick pattern hence any follow up close above Rs 1,791 may confirm this reversal.
The stock is well placed above its 50, 100 and 200-day SMA and these moving averages are also inching up along with rising prices, which reconfirms positive trend. The monthly strength indicator RSI is in bullish terrain indicating sustained strength on a long term chart.
Investors should buy, hold and accumulate this stock with an expected upside of Rs 1,900-2,000, with downside support zone of Rs 1,660-1,640 levels.

Disclaimer: The views and investment tips expressed by investment experts on Moneycontrol.com are their own and not those of the website or its management. Moneycontrol.com advises users to check with certified experts before taking any investment decisions.
Discover the latest Business News, Sensex, and Nifty updates. Obtain Personal Finance insights, tax queries, and expert opinions on Moneycontrol or download the Moneycontrol App to stay updated!

Find the best of Al News in one place, specially curated for you every weekend.
Stay on top of the latest tech trends and biggest startup news.