


Given the cautious mood after the consistent upward journey of the volatility index and Bearish Engulfing candlestick pattern formation on the daily charts, 22,300—the low of the big bullish candle of April 25—is expected to be a key level to watch for a further downside in the Nifty 50.
On the higher side, in case there is a rebound, the index may face resistance at the 22,600-22,650 level, experts said.
On May 3, the Nifty 50 fell 172 points to close at 22,476 after hitting an all-time high intraday. The BSE Sensex was down 733 points at 73,878, while the selling pressure was lower in the broader markets as the Nifty Midcap 100 and Smallcap 100 indices fell 0.4 percent and 0.5 percent, respectively.
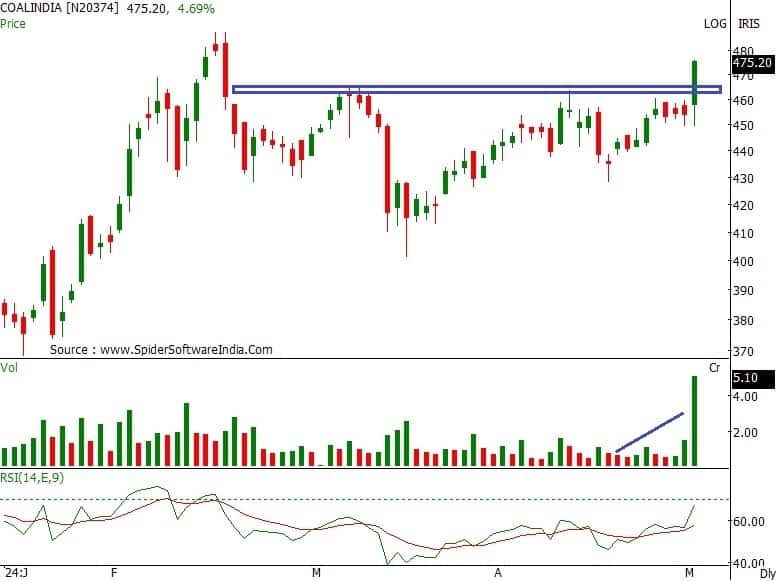
Stocks that bucked the market trend last Friday include Coal India, Blue Dart Express, and Grasim Industries. Coal India saw a decisive breakout of the consolidation seen in the previous four days as well as a breakout from the falling resistance trendline, with trading above all key moving averages, in a positive sign. The stock rallied 4.6 percent to Rs 474.60 on the NSE and formed a long bullish candlestick pattern on the daily charts with significantly higher volumes.
Blue Dart Express has also seen a consolidation breakout, with trading above all key moving averages. It surged 9.3 percent to Rs 6,821.5, the highest closing level since January 24 this year. The stock has formed a robust bullish candlestick pattern on the daily charts with a multifold jump in volumes.
Grasim Industries ended at a record closing high of Rs 2,481, up 1.81 percent, and formed a bullish candlestick pattern on the daily charts. Further, the stock traded above all key moving averages and continued its higher high, higher low formation with healthy volumes for three days in a row.
Here's what Rajesh Palviya of Axis Securities recommends investors do with these stocks when the market resumes trading today:
With three months of strong consolidation, the stock observed huge buying interest on May 3. It has surpassed the "multiple resistance" zone at the Rs 465 level along with huge volumes. This volume spurt signifies increased participation.
The stock has recaptured the 20-day SMA (simple moving average: Rs 449) and 50-day SMA (Rs 443) and rebounded sharply, which reconfirms the short-term bullish trend.
The daily, weekly and monthly strength indicator RSI (relative strength index) is in positive terrain, which signals rising strength. The daily "Bollinger band" buy signal indicates increased momentum.
Investors should buy, hold and accumulate this stock with an expected upside of Rs 500-525, with the downside support zone at the Rs 460-450 level.
On the daily timeframe, the stock has decisively broken out of an "Inverse Head & Shoulder'' trend reversal pattern around the Rs 6,500 level. The positive crossover of the 20- and 50-day SMA signifies a short and medium-term bullish trend. This breakout is being accompanied by huge volumes, indicating increased participation.
The daily, weekly and monthly strength indicator RSI is in positive terrain, which justifies the rising strength across all the time frames. The daily "Bollinger band" buy signal indicates increased momentum.
Investors should buy, hold and accumulate this stock with an expected upside of Rs 7,100-7,385, with the downside support zone at the Rs 6,500-6,400 level.

The stock is in a strong uptrend across all the time frames, forming a series of higher tops and bottoms, indicating a positive bias. The stock is well placed above its 20-, 50-, 100- and 200-day SMA, and these averages are also inching up with the price rise, which reconfirms the bullish trend.
The daily and weekly strength indicator RSI is in positive terrain, which signals rising strength. The daily and weekly "Bollinger band" buy signal indicates increased momentum.
Rising volumes on each rally signify increased participation. The stock has also registered an all-time high at Rs 2,487, indicating bullish sentiments.
Investors should buy, hold and accumulate this stock with an expected upside of Rs 2,600-2,720, with the downside support zone at the Rs 2,400-2,320 level.

Discover the latest Business News, Sensex, and Nifty updates. Obtain Personal Finance insights, tax queries, and expert opinions on Moneycontrol or download the Moneycontrol App to stay updated!
Find the best of Al News in one place, specially curated for you every weekend.
Stay on top of the latest tech trends and biggest startup news.


