


: Redington (India) Q1 profit jumps 36.5% YoY to Rs 326.34 crore. Revenue grows 25% YoY to Rs 16,803 crore. The company reported a 36.5% year-on-year growth in consolidated profit at Rs 326.34 crore for the quarter ended June 2022 led by operating performance and top line growth. Revenue grew by 25% YoY to Rs 16,803.14 crore for the June FY23 quarter.")
The market continued to consolidate for yet another session but bulls seem to be strongly holding the fort as the benchmark indices extended uptrend for the sixth consecutive day on August 3.
The BSE Sensex rallied more than 200 points to 58,350 while the Nifty50 climbed 43 points to 17,388 and formed a small-bodied bullish candle on daily charts with higher high higher low formation for the fifth straight day.
However, there was underperformance in the broader space on weak breadth. The Nifty Midcap 100 and Smallcap 100 indices fell 0.7 and 0.5 percent respectively. About two shares declined for every share rising on the NSE.
Stocks that were in action included Rossari Biotech which gained 5.8 percent at Rs 945, which has seen large bullish candlestick pattern formation on the daily charts with significantly higher volumes with expanding Bollinger Band after a day of high wave kind of candle formation. The long downward sloping trendline (adjoining record high point on October 12, 2021, and January 14, 2022) has broken out with a positive candle on July 28, 2022.
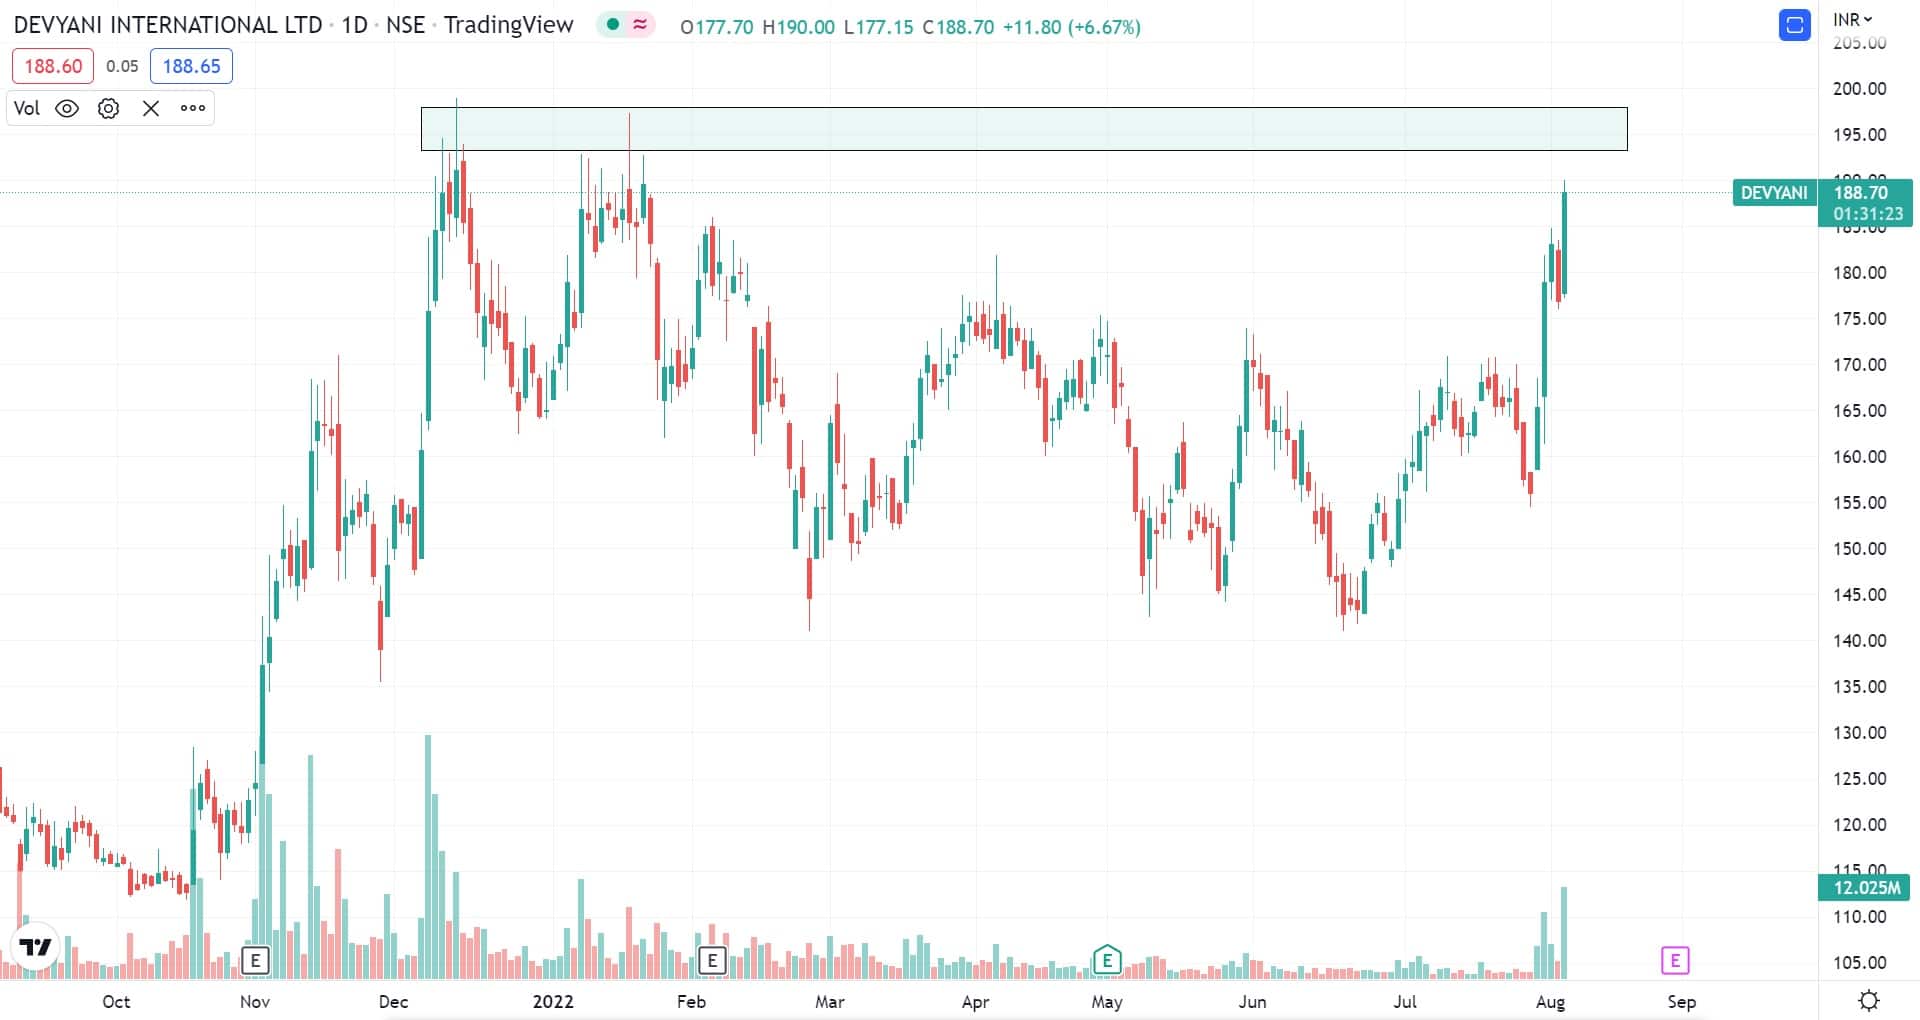
Devyani International was another stock that rallied 5.6 percent to close at Rs 186.75, the highest closing level since January 20 this year, forming robust bullish candlestick pattern which resembles Bullish Engulfing kind of pattern formation on the daily charts, with very high volumes.
Greenply Industries erased significant gains from its high point and finally settled with 1.3 percent gains at Rs 184.8, forming Inverted Hammer kind of pattern on the daily charts.
Here's what Jigar S Patel of Anand Rathi Shares & Stock Brokers recommends investors should do with these stocks when the market resumes trading today:
Rossari Biotech has witnessed a very sharp correction of 51 percent between October 2021 and June 2022. Since then the stock is consolidating between Rs 825-880 (see chart) and it has made a solid base near Rs 900 levels.
On August 3, 2022, it gave a classic breakout from said levels along with massive volume picking up which hints at further upside.
On the indicator front, weekly MACD (moving average convergence and divergence) is giving bullish crossover along with weekly RSI (relative strength index) displaying impulsive structure near oversold zone indicating further upside till Rs 1,100 with plausible support seen at Rs 875.
One can hold (if already bought) and add (if considering fresh buy) at the current market price.

On the daily chart, the counter is near resistance levels of approximately Rs 190-200. Over the last one month, the stock has seen 33 percent appreciation. If already holding, then one should book some profits between Rs 190-195 levels.
Last but not the least, fresh buying in the counter is not advisable at the current market price, as volumes are high at higher price which is a sign of exhaustion.
What a great setup we are having at Greenply Industries -- precise bullish BAT pattern which got completed at 0.886 ratio on the daily chart with N-wave formation near the potential reversal zone of Rs 170-175.
In the current scenario, the said counter has reversed from the said potential reversal zone with positive volume picking up which hints at further upside. One can buy at current levels in small tranche and another tranche at Rs 178 levels. Upside is expected till Rs 220 and plausible support is seen at Rs 170.

Disclaimer: The views and investment tips expressed by investment experts on Moneycontrol.com are their own and not those of the website or its management. Moneycontrol.com advises users to check with certified experts before taking any investment decisions.
Discover the latest Business News, Sensex, and Nifty updates. Obtain Personal Finance insights, tax queries, and expert opinions on Moneycontrol or download the Moneycontrol App to stay updated!
Find the best of Al News in one place, specially curated for you every weekend.
Stay on top of the latest tech trends and biggest startup news.


