


The benchmark indices closed a rangebound session on a negative note, continuing the downtrend for the fourth straight day, with an overall weak market breadth. About 1,607 shares declined, while 892 shares advanced on the NSE. The market is expected to remain consolidative with a negative bias. Below are some trading ideas for the near term:
Amol Athawale, VP-technical Research at Kotak Securities
Union Bank of India | CMP: Rs 110.3
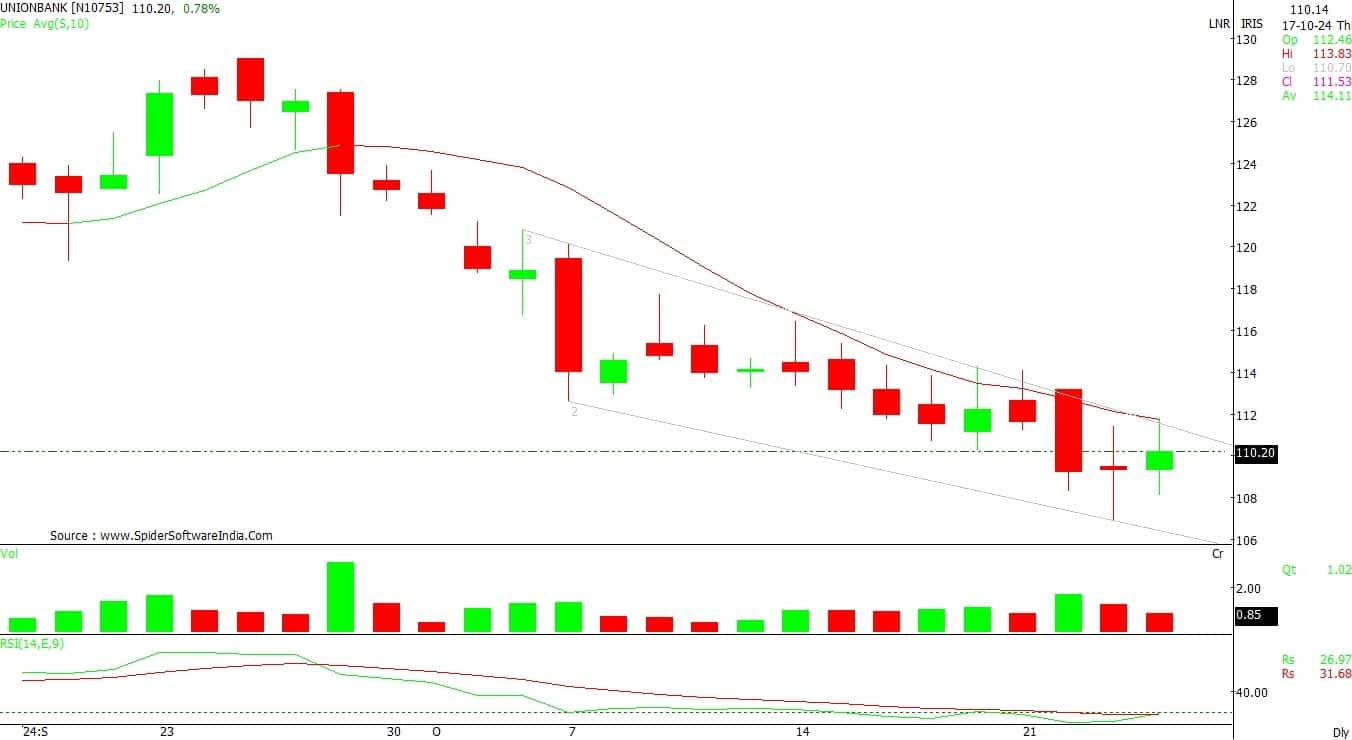
On a daily time frame, Union Bank of India has been in a downtrend. It is currently in oversold territory and is available near its demand area. The texture of the chart formation and the technical indicator RSI (Relative Strength Index) indicate that the stock is likely to rebound for a new leg of upward movement from its demand zone.
Strategy: Buy
Target: Rs 120
Stop-Loss: Rs 105
Mahindra and Mahindra | CMP: Rs 2,826.4
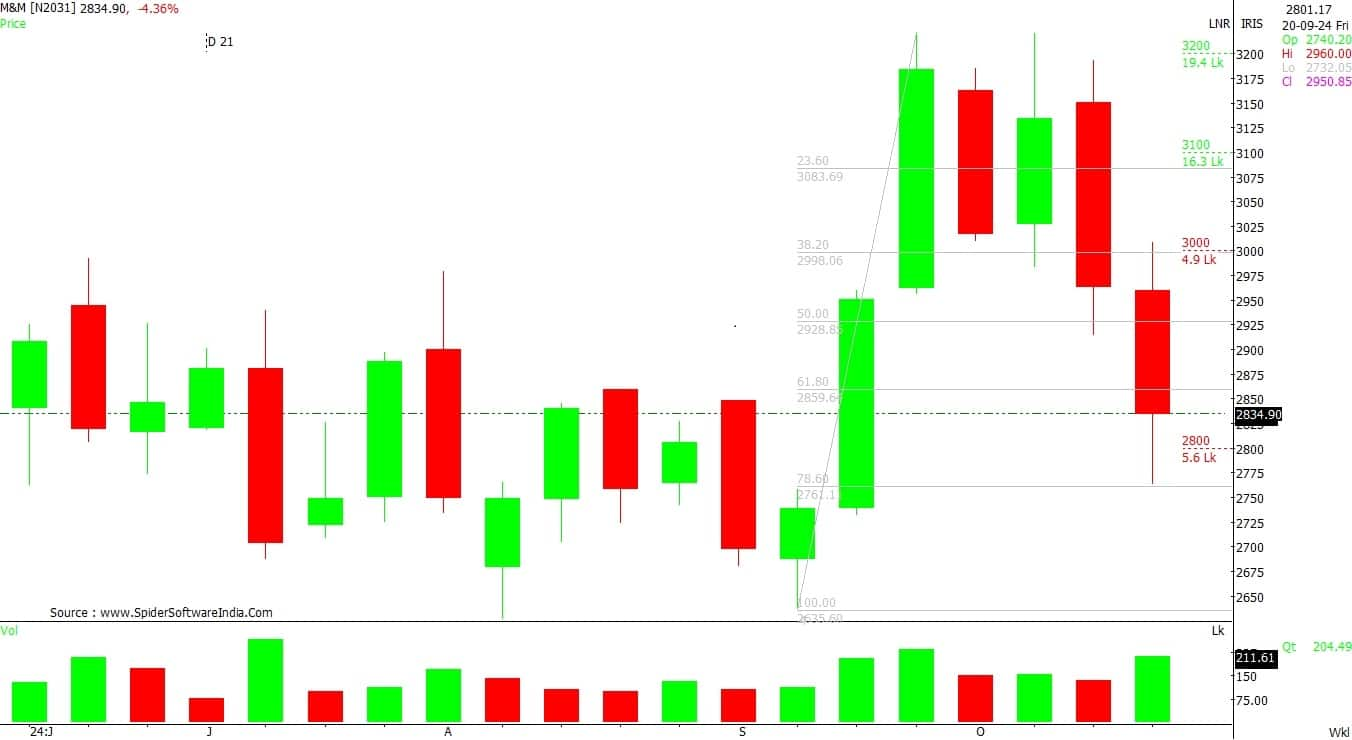
After the recent selloff from higher levels, the downward momentum in M&M has stopped. On the weekly charts, M&M has found support and reversed its trend from an important retracement zone. The chart formation and technical indicator RSI suggest further bullish movement from current levels in the coming horizon.
Strategy: Buy
Target: Rs 3,030
Stop-Loss: Rs 2,730
LTIMindtree | CMP: Rs 5,970.4
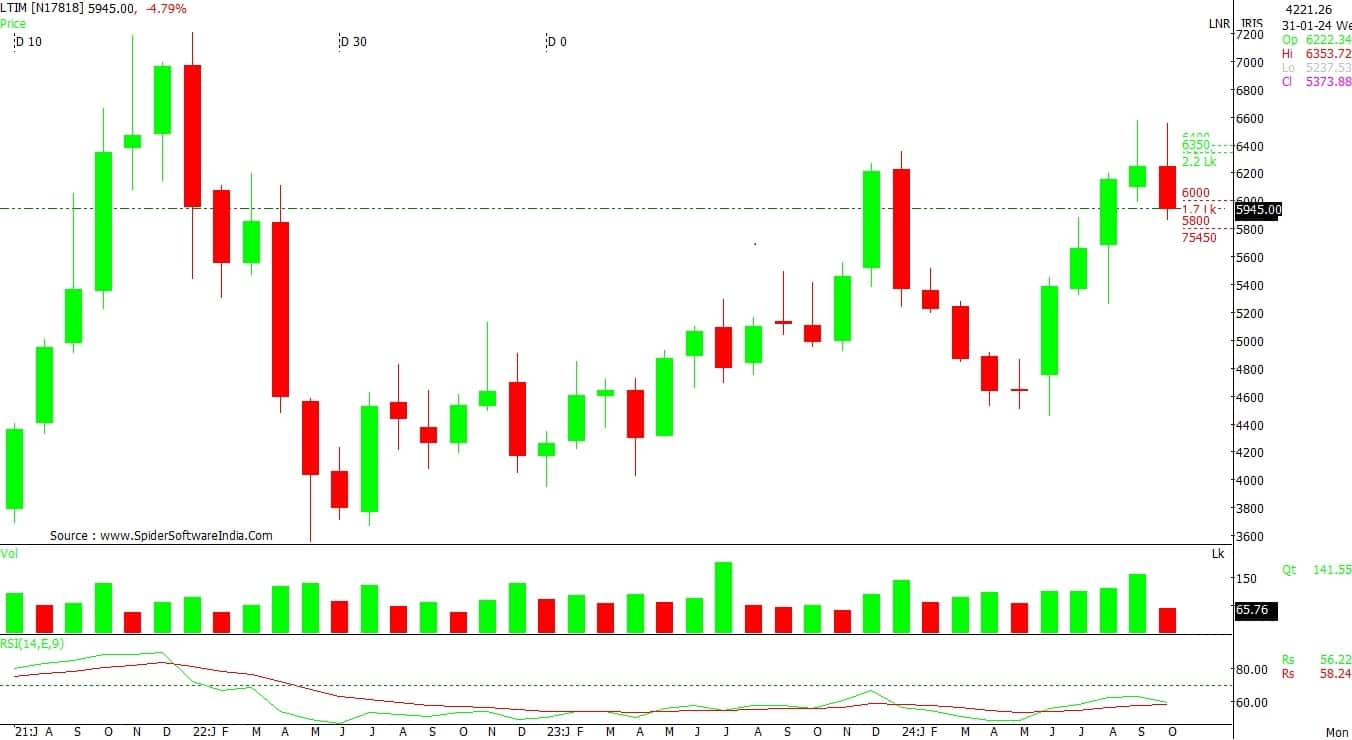
Following a sharp uptrend rally, LTIMindtree experienced some selling pressure, but its downward momentum has paused, and it has found support. On the monthly charts, the stock has formed a Cup and Handle pattern, and a fresh breakout from the resistance zone is likely to occur in the coming trading sessions.
Strategy: Buy
Target: Rs 6,360
Stop-Loss: Rs 5,730
Mandar Bhojane, Equity Research Analyst at Choice Broking
Syngene International | CMP: Rs 880
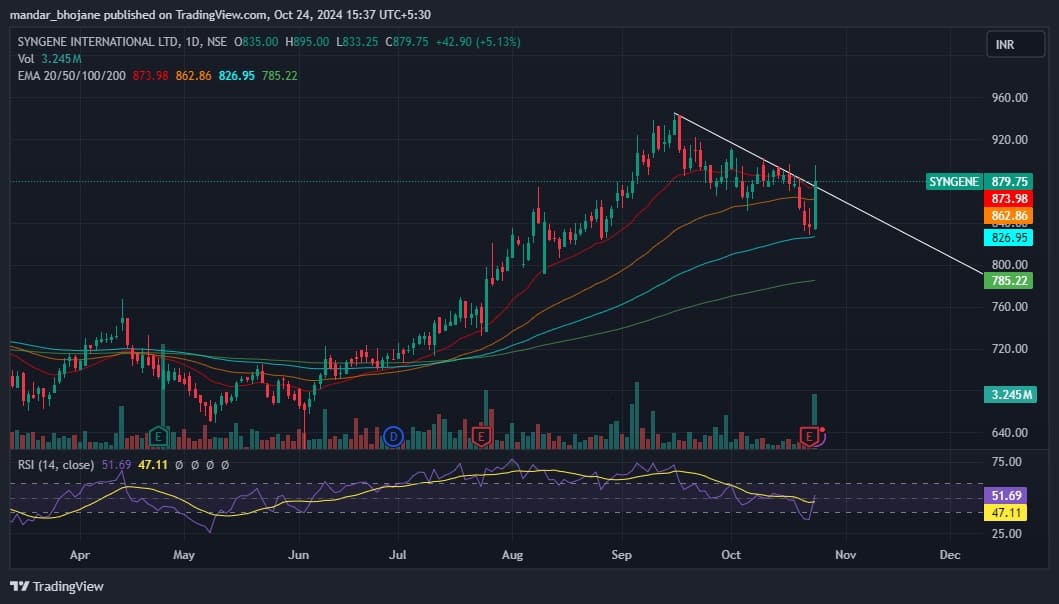
Syngene International has recently broken out of a falling trendline on the daily chart, supported by a significant uptick in trading volume, signaling a potential bullish trend. If the stock sustains above the Rs 880 level, it could target short-term levels of Rs 1,000 and Rs 1,050. On the downside, immediate support is found at Rs 850, offering buying opportunities on dips. The RSI is currently at 51.7 and moving upward, reflecting increasing buying momentum. For prudent risk management, a stop-loss at Rs 830 is recommended to protect against unexpected reversals.
Strategy: Buy
Target: Rs 1,000, Rs 1,050
Stop-Loss: Rs 830
CRISIL | CMP: Rs 5,084

CRISIL has formed a rounding bottom pattern on the daily chart, accompanied by a significant increase in trading volume, suggesting strong bullish momentum. A close above the Rs 5,100 level could pave the way for short-term targets of Rs 6,100 and Rs 6,400. On the downside, immediate support lies at Rs 4,800, offering potential buying opportunities on dips. The RSI currently stands at 68.2 and is trending upward, reflecting growing buying momentum. To mitigate risk, a stop-loss at Rs 4,650 is advised to safeguard against potential market reversals.
Strategy: Buy
Target: Rs 6,100, Rs 6,400
Stop-Loss: Rs 4,650
Bank of Baroda | CMP: Rs 244.77

Bank of Baroda is on the verge of breaking out from a descending triangle pattern on the daily chart, backed by a notable rise in trading volume. This breakout signals a potential bullish reversal. If the stock manages to close above the Rs 250 level, it could aim for short-term targets of Rs 290 and Rs 300. On the downside, immediate support is seen at Rs 235, providing potential buying opportunities on dips. The RSI is at 51.18 and trending upward, indicating growing buying momentum. For effective risk management, a stop-loss at Rs 230 is recommended to guard against unforeseen market reversals.
Strategy: Buy
Target: Rs 290, Rs 300
Stop-Loss: Rs 230
Virat Jagad, Technical Research Analyst at Bonanza
One 97 Communications | CMP: Rs 764.5

One 97 Communications (Paytm) has recently broken out from a Flag and Pole pattern on the daily chart, a strong bullish indicator suggesting a potential for a sustained uptrend. The breakout is supported by a surge in trading volume, reflecting increased buying interest and reinforcing the stock's positive outlook. Additionally, the stock is trading above key EMAs (Exponential Moving Averages), aligning with the ongoing bullish trend. A positive MACD (Moving Average Convergence Divergence) crossover further confirms this upward momentum. Overall, these technical signals point to a bullish scenario, with potential for further price appreciation in the near term.
Strategy: Buy
Target: Rs 870
Stop-Loss: Rs 712
Hindustan Zinc | CMP: Rs 539.5
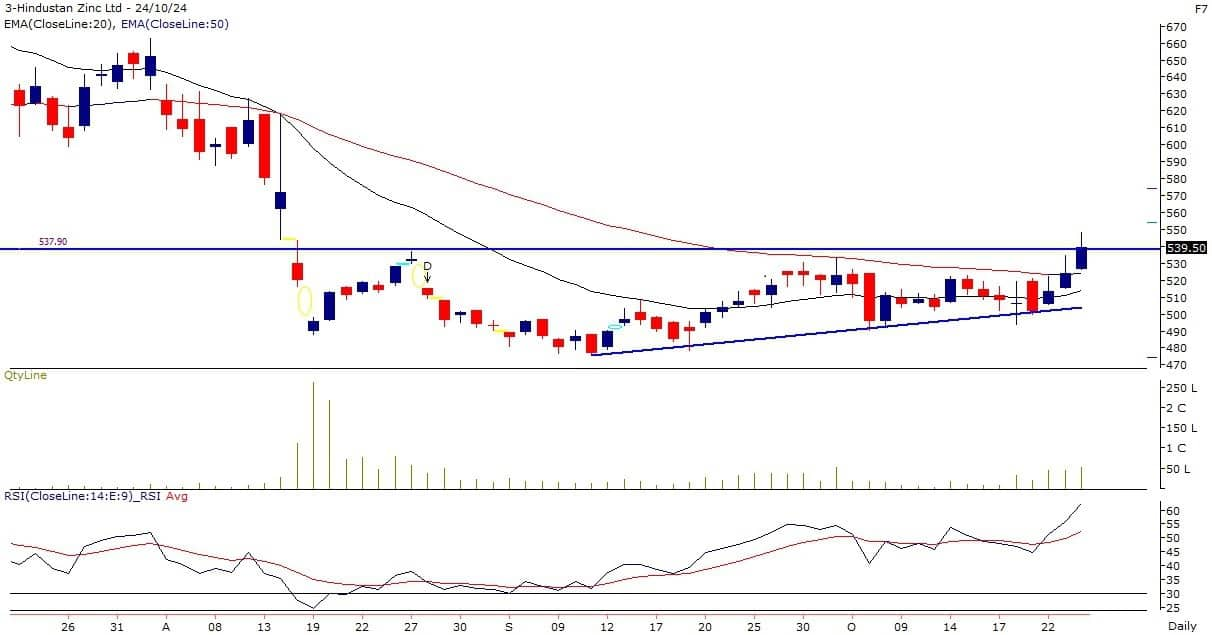
The daily chart of Hindustan Zinc shows a confirmed breakout from an ascending triangle pattern, a strong bullish signal. This breakout is supported by a significant rise in trading volume, indicating strong buying interest and positive market sentiment. The stock is trading near its recent highs, with both the Fast and Slow EMAs trending upward, reinforcing the bullish outlook. Additionally, the RSI has broken out in a bullish direction, highlighting the strength of the ongoing uptrend. These technical indicators collectively suggest a strong bullish outlook, with potential for continued price gains in the near term.
Strategy: Buy
Target: Rs 590
Stop-Loss: Rs 515
Radico Khaitan | CMP: Rs 2,296
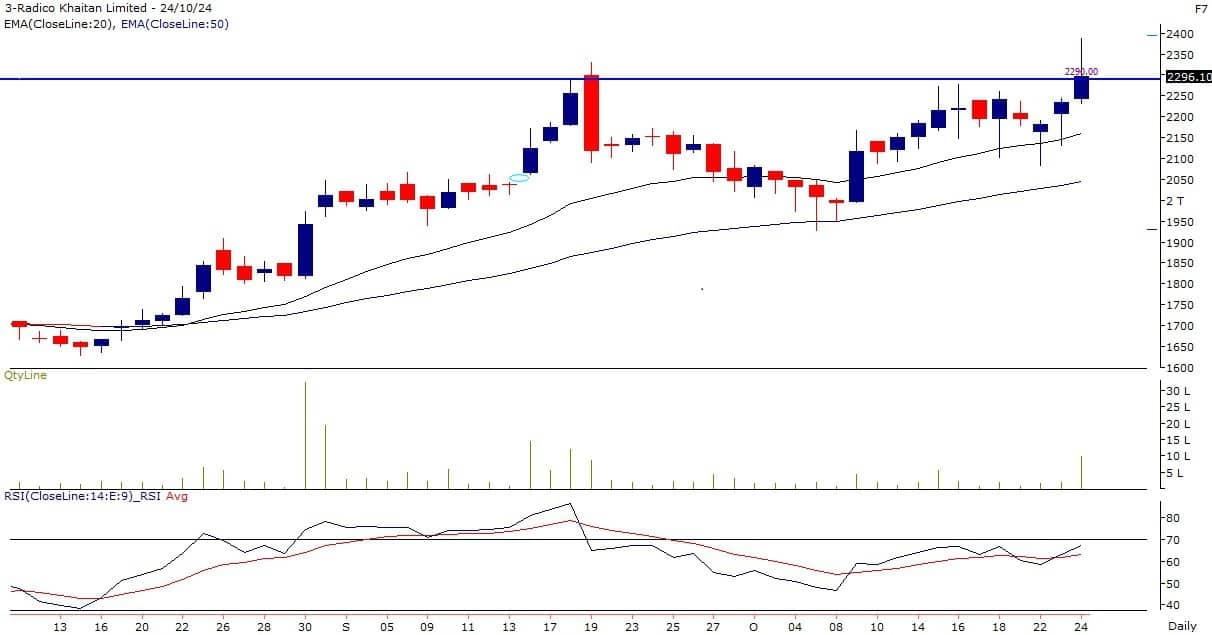
Radico Khaitan has recently broken out from a Cup and Handle pattern on the daily chart, signaling a potential uptrend. This bullish formation suggests the likelihood of further price appreciation. A significant surge in volume during the last session highlights increased buying interest, reinforcing the positive outlook. The stock is also trading above key EMAs, confirming sustained upward momentum. Additionally, the RSI has broken out in a bullish direction, underscoring the strength of the ongoing uptrend. Together, these technical signals suggest a strong bullish outlook for Radico Khaitan.
Strategy: Buy
Target: Rs 2,550
Stop-Loss: Rs 2,160
Rohan Shah, Technical Analyst at Asit C Mehta Investment Interrmediates
ICICI Prudential Life Insurance Company | CMP: Rs 768
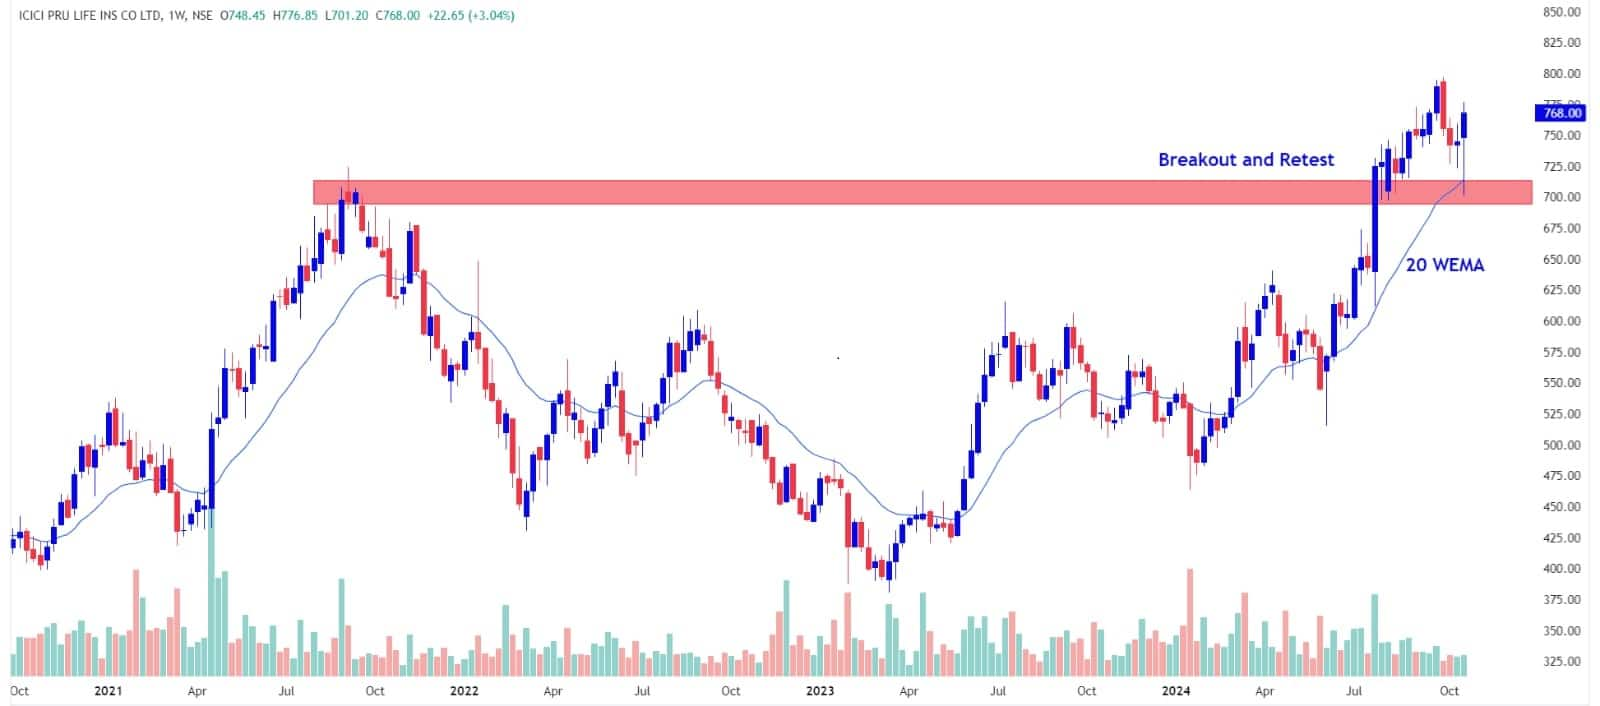
ICICI Prudential Life Insurance has been in a strong uptrend for over a year, forming a series of higher highs and lows with supportive volumes. In this process, the stock recorded a breakout from its previous swing high, signaling inherent strength in the trend. However, after hitting a high of Rs 795, the stock retraced lower to test its previous swing high and the 20-week EMA. It rebounded strongly from this support zone, forming a bullish candlestick pattern. On the momentum front, the RSI is trading in the bullish zone, complementing the positive price bias.
Strategy : Buy
Target: Rs 830
Stop-Loss: Rs 745
HCL Technologies | CMP: Rs 1,845
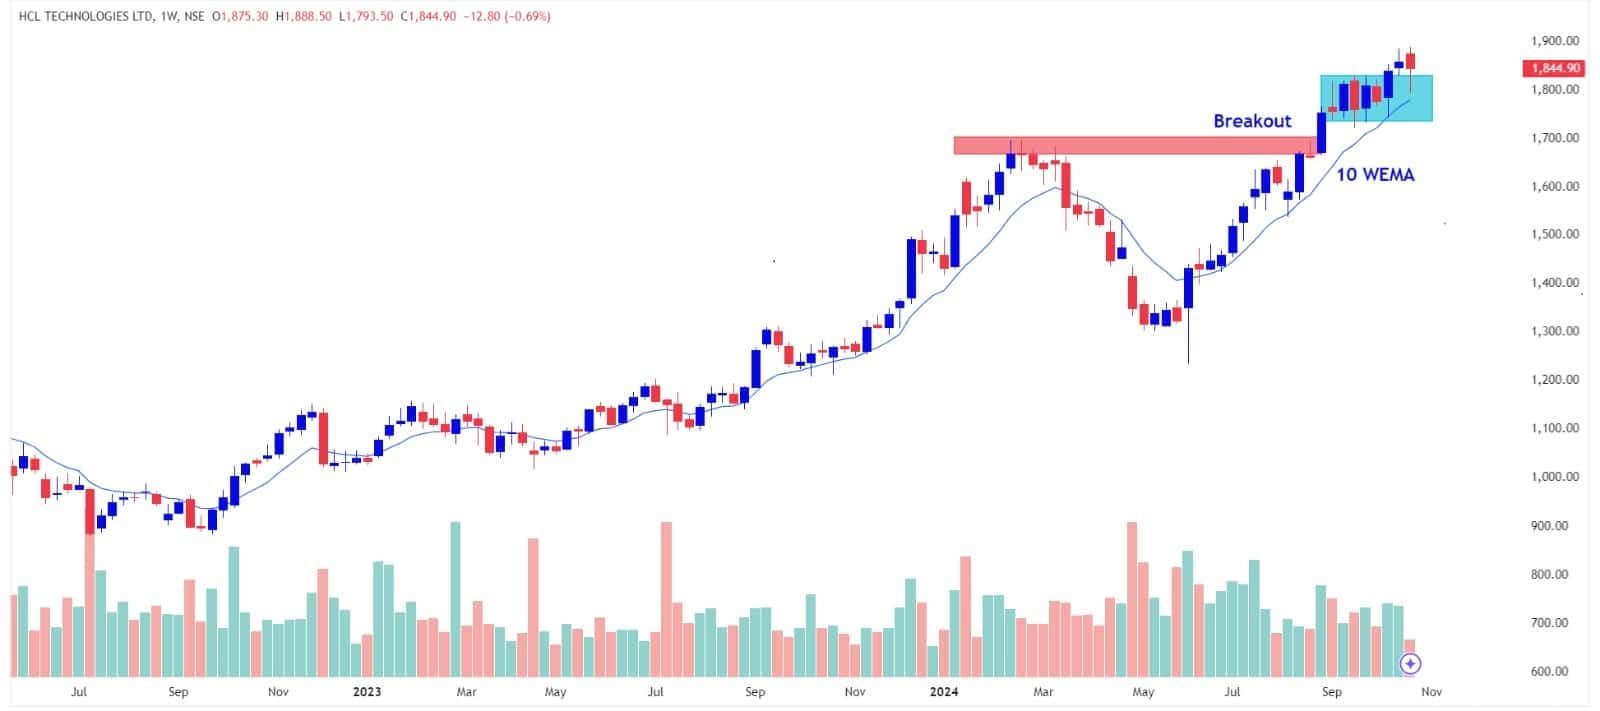
The IT sector has shown higher relative strength compared to other sectors and the benchmark index. Within this space, HCL Technologies offers a fresh buying opportunity with a favourable risk-reward profile. The stock has been gradually inching higher after breaking out from a Cup and Handle pattern. The price increase is accompanied by supportive volumes and momentum, indicating inherent strength. The gradual upmove has led to a breakout above the 127.2 percent external retracement ratio of its prior decline from Rs 1,697 to Rs 1,235. Based on the price action and relative strength, we expect the stock to head towards the 161.8 percent external retracement level, which aligns around Rs 1,985.
Strategy: Buy
Target: Rs 2,000
Stop-Loss: Rs 1,765
Crompton Greaves Consumer Electricals | CMP: Rs 395.6
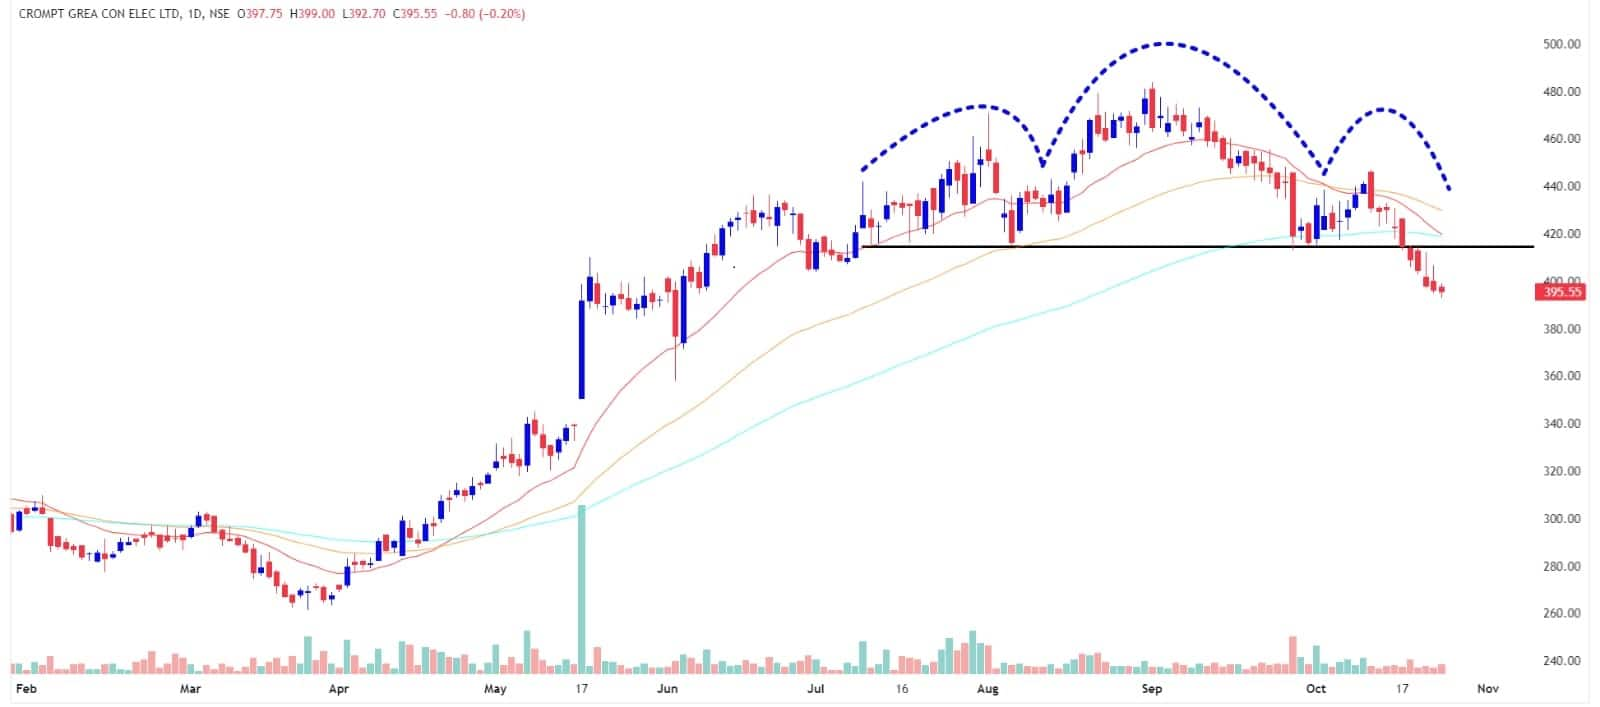
After a steady upmove over the last few months, Crompton Greaves Consumer Electricals is now showing signs of profit-taking as a bearish price pattern emerges. Technically, the stock has registered a breakdown from a Head and Shoulders pattern along with short-term moving averages, indicating weakness in the trend. Given this pattern, the stock has the potential to decline toward Rs 375-360 levels in the coming sessions.
Strategy: Sell
Target: Rs 360
Stop-Loss: Rs 415
Disclaimer: The views and investment tips expressed by investment experts on Moneycontrol.com are their own and not those of the website or its management. Moneycontrol.com advises users to check with certified experts before taking any investment decisions.
Discover the latest Business News, Sensex, and Nifty updates. Obtain Personal Finance insights, tax queries, and expert opinions on Moneycontrol or download the Moneycontrol App to stay updated!
Find the best of Al News in one place, specially curated for you every weekend.
Stay on top of the latest tech trends and biggest startup news.