


The market seems to be inching upwards gradually along with a shift in support as the Nifty50 climbed higher for the third week in a row, rising half a percent in the week ended February 17. The index has formed a bullish candle with upper and lower shadows on the weekly scale, indicating volatility.
Further, it has been making higher high for the week gone by, and higher low for second straight week. The index has breached the Budget day's high but there was some selling pressure at higher levels, leading to a close at 17,944.
The Nifty50 has crucial support in the 17,700-17,900 area, hence as long as it holds the same, 18,200-18,300 appear likely in the coming sessions, experts said.
Even the Options data indicated that 18,000 strike has maximum open interest on the Call as well as Put side, indicating a tug-of-war between bulls and bears.
"The recent price action could be seen as a constructive development for our markets as the index hover above the sloping trendline and has also attempted to transcend the sturdy hurdle of the 18,000 mark after two weeks of consolidation," Sameet Chavan, Chief Analyst-Technical and Derivatives at Angel One, said.


As far as levels are concerned, he remains hopeful till the sacrosanct support of 17,800-17,700 is withheld firmly. On the flip side, sustenance above 18,000 could only bring the cheer back in the market, while on the higher end, 18,200 is likely to be the sturdy wall in a comparable period, says Sameet.
Despite the lacklustre moves in the indices, individual pockets kept buzzing and experts expect this to continue.
Hence, Sameet advocate traders to focus on a stock-specific approach for better trading opportunities and stay with a similar buy on decline strategy till the time important supports are held comfortably.
Let's take a look at the top 10 trading ideas by experts for the next three-four weeks. Returns are based on the February 17 closing prices:
Expert: Shrikant Chouhan, Head of Equity Research (Retail) at Kotak Securities
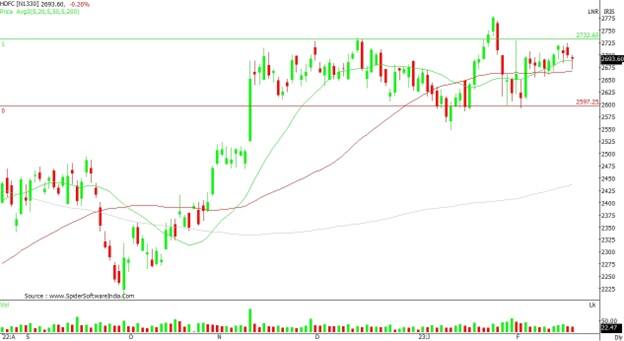
HDFC: Buy | LTP: 2,694 | Stop-Loss: Rs 2,580 | Target: Rs 2,950 | Return: 10 percent
The stock has been consolidating above Rs 2,600 level for quite some time now. Even though there was a weakness in the market, the stock held above the thin support line, otherwise it follows the market trend most of the time.
Technically, we can call it as a bullish divergence, which will reward positional traders in a bullish move in the market. The strategy should be to buy 50 percent at current levels and balance at Rs 2,650. Place stop-loss at Rs 2,580. On the upside, there could be a rally towards Rs 2,850 or Rs 2,950 in the medium term.
Tata Power Company: Buy | LTP: Rs 205 | Stop-Loss: Rs 190 | Target: Rs 230 | Return: 12 percent
The stock has been in the rectangle trading range for almost the last 15 months. It is following the trading range of Rs 190 and Rs 250. In the last eight weeks, the stock managed to stay above Rs 190 level, bucking the broad market trend, which had plunged to new lows.
The reward-to-risk ratio at the current levels is in favour of the bulls. Buy Tata Power between Rs 205 and Rs 195. For this, keep the stop-loss at Rs 190. On the upside, the stock may move towards Rs 230 with facing minor resistance near Rs 220.

Asian Paints: Buy | LTP: Rs 2,834 | Stop-Loss: Rs 2,680 | Target: Rs 3,100 | Return: 9 percent
The stock has formed a higher bottom after touching highly oversold levels. It was at Rs 3,580 in the month of September 2022 and since then the stock was falling. It touched the level of Rs 2,685, which was the higher bottom level compared to the previous low of Rs 2,560.
Such type of pattern mostly favours the bulls, however, a breakdown of recent lows invites further weakness.
Traders can take a tactical trading call at current levels and on the further downside and keep a tight stop-loss at Rs 2,680. On the upside, it would find resistance near Rs 3,000 and Rs 3,100.

Expert: Jigar S Patel, Senior Manager - Equity Research at Anand Rathi
Borosil Renewables: Buy | LTP: Rs 478 | Stop-Loss: Rs 445 | Target: Rs 535 | Return: 12 percent
The free fall which started from July 20, 2022 resulted in 38 percent cut in price. At current juncture, the said counter has formed bullish Butterfly pattern which is looking lucrative at current market price.
In addition, it has also formed Bullish Engulfing pattern exactly around potential reversal zone of Rs 440-450 thus confirming bullish stance in the counter.
From indicator perspective, daily RSI (relative strength index) has made bullish divergence along impulsive structure near oversold level of 30.
One can buy in the range of Rs 470-480 and target would be Rs 535 with a stop-loss of Rs 445 on daily close basis.

Indiabulls Housing Finance: Buy | LTP: Rs 113 | Stop-Loss: Rs 104 | Target: Rs 130 | Return: 15 percent
The relentless fall which started from December 30, 2022 resulted in 33 percent cut in price. At current juncture, the said counter has formed Bullish Engulfing pattern exactly around 0.618 retracement of its previous rally which started from September 2022.
In addition, buying volume is also picking up from lower levels thus confirming bullish stance in the counter. From indicator perspective, daily RSI has made bullish divergence along impulsive structure near oversold level of 30.
One can buy in the range of Rs 111-114 and target would be Rs 130 with a stop-loss of Rs 104 on daily close basis.

Gujarat Gas: Buy | LTP: Rs 485 | Stop-Loss: Rs 455 | Target: Rs 530 | Return: 9 percent
Since the last couple of months, the said counter has corrected almost 18 percent and currently, it has made nice near Rs 450-455. Buying volume is gradually increasing from lower levels thus indicating bullish momentum in the coming few sessions.
From the indicator perspective, on a daily scale of MACD (moving average convergence divergence) histogram and RSI bullish divergence was seen thus confirming the bullish stance in the counter.
One can buy in the range of Rs 480-486 with a target of Rs 530 and a stop-loss of Rs 455 on a daily close basis.

Expert: Ruchit Jain, Lead Research at 5paisa.com
ONGC: Buy | LTP: Rs 156.6 | Stop-Loss: Rs 148 | Target: Rs 170 | Return: 9 percent
The stock has been forming a ‘Higher Top Higher Bottom’ on the daily and weekly chart and is thus in an uptrend. The ’89 DEMA’ (day exponential moving average) has acted as a support in the recent corrective phase and prices witnessed a positive momentum during last week and have given a breakout above its resistances.
The RSI oscillator is in ‘buy mode’ indicating a positive momentum. Hence, short term traders can look for buying opportunities around current market price of Rs 156 for near term targets of Rs 165 and Rs 170. The stop-loss for long positions should be placed below Rs 148.

Bosch: Buy | LTP: Rs 18,014 | Stop-Loss: Rs 17,600 | Target: Rs 19,300 | Return: 7 percent
The stock has consolidated within a range in last few weeks and has formed an ‘Inverted Head and Shoulders’ pattern on the weekly chart. Prices are on the verge of a breakout from the pattern and the momentum readings on the daily and the weekly chart are indicating a positive momentum.
During last week, we witnessed a gradual rise in volumes and hence we expect a positive move soon in the stock.
Hence, traders can look to buy the stock around above Rs 18,250 for potential targets around Rs 18,900 and Rs 19,300. The stop-loss for long positions should be placed below Rs 17,600.

Expert: Mitesh Karwa, Research Analyst at Bonanza Portfolio
Mirza International: Buy | LTP: Rs 273 | Stop-Loss: Rs 244 | Target: Rs 314 | Return: 15 percent
Mirza International seems to be breaking out of a consolidation after nine weeks with a big bullish candle and above average volumes on the weekly timeframe after taking support from a support trendline. The supertrend indicator is also indicating a bullish reversal which can be used as a confluence towards the bullish view.
On the indicator front, The 200-day EMA is at Rs 252 on the daily timeframe and the stock is comfortably sustaining above it. The ichimoku cloud is also suggesting a bullish move as the price is trading above the conversion and base line on the daily timeframe.
Momentum oscillator RSI (14) is at around 65 on the daily time frame indicating strength by sustaining above 50.
Observation of the above factors indicates that a bullish move in Mirza International is possible for targets upto Rs 314. One can initiate a buy trade in between the range of Rs 271-273 with a stop-loss of Rs 244 on daily closing basis.

Indian Hotels: Buy | LTP: Rs 318 | Stop-Loss: Rs 298 | Target: Rs 350 | Return: 10 percent
Indian Hotels seems to be taking support from a strong upwards sloping support trendline on the weekly timeframe from the last 22 months and the stock has broken out of a downwards sloping parallel channel pattern on the daily timeframe which can be used as a confluence towards the bullish view.
Momentum oscillator RSI (14) is at around 54 on the daily time frame indicating strength by sustaining above 50 and at the same time the ichimoku cloud is also suggesting a bullish move as the price is trading above the conversion and base line on the daily timeframe.
Observation of the above factors indicates that a bullish move in Indian Hotels is possible for targets upto Rs 350. One can initiate a buy trade in between the range of Rs 315-318 with a stop-loss of Rs 298 on daily closing basis.

Disclaimer: The views and investment tips expressed by investment experts on Moneycontrol.com are their own and not those of the website or its management. Moneycontrol.com advises users to check with certified experts before taking any investment decisions.
Discover the latest Business News, Sensex, and Nifty updates. Obtain Personal Finance insights, tax queries, and expert opinions on Moneycontrol or download the Moneycontrol App to stay updated!
Find the best of Al News in one place, specially curated for you every weekend.
Stay on top of the latest tech trends and biggest startup news.


