The Nifty snapped a two-day rise and closed in the negative after witnessing a sharp rebound from the afternoon lows on March 20. Broader market indices fell more than the benchmark, reflecting higher panic among non-institutional players. The Nifty has formed a bullish hammer on daily charts after forming two Dojis, hinting at possibility of an upward reversal.
As any bear market could have a pullback rally, the same can be expected from Indian indices too. The Nifty has witnessed a fall of almost 11 percent from the all-time high of 18,887 of December 2022.
The indices have been making lower top and lower bottom formation on the charts, which indicates bearish trend for a longer time frame. However, the possibility of a pullback in the short term cannot be ruled out. For the last few trading sessions, a tug-of-war is on between the bulls and the bears.
FIIs have been heavily short in last couple of months and their long-to-short ratio in index future has reached as low as 0.12, which is extremely oversold. A band of 16,800-16,850 has been a good demand zone and the same can act as a short-term support for the Nifty.
We believe that the Nifty could show a move towards the 17,500-17,600 band in the short term and the same should be utilised to lighten long positions. A level below 16,800 would negate the chances of a pullback in the Nifty.
Here are three buy calls for next 2-3 weeks:
Manappuram Finance: Buy | LTP: Rs 113 | Stop-Loss: Rs 107 | Targets: Rs 123-135 | Return: 19 percent
The stock price is in formation of bullish Inverted Head and Shoulder pattern on the daily charts. The stock is trading above its 50, 100 and 200-DMA (days moving average), indicating bullish trend on all time frame.
Indicators like RSI (relative strength index) and DMI (directional movement index) have turned bullish on short to medium term charts.
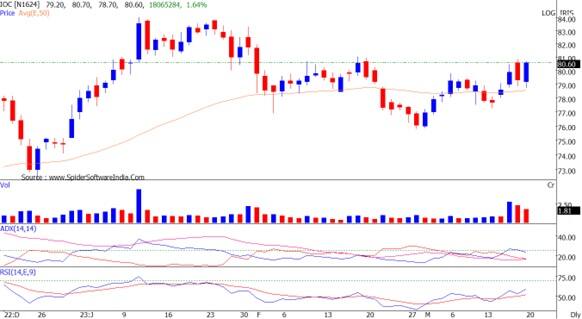
Indian Oil Corporation: Buy | LTP: 80.60 | Stop-Loss: Rs 77 | Targets: Rs 85-89 | Return: 10 percent
The stock price has confirmed higher top and higher bottom formation on the daily chart. In the recent downtrend of the market, oil marketing companies have shown resilient performance.
The stock is trading above its 50, 100 and 200-DMA, indicating bullish trend on all time frame. Volumes have gone up along with the price rise recently. Indicators and oscillators have turned bullish daily time frame.
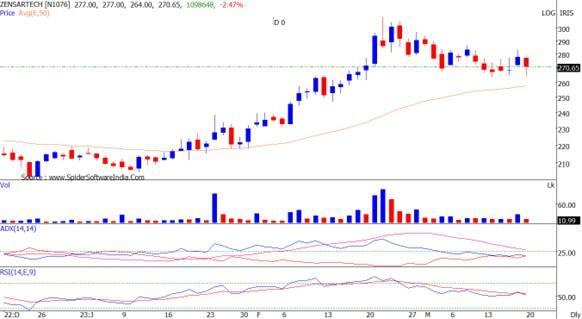
Zensar Technologies: Buy | LTP: Rs 270 | Stop-Loss: Rs 255 | Target: Rs 302 | Return: 12 percent
Flag Pattern Breakout is expected on the daily chart. The stock price has witnessed healthy correction after sharp upswing. IT Sector has also reached oversold zone on short term charts.
DMI indicator has turned bullish on the short term charts. RSI (relative strength index) has given positive crossover on the daily chart. The stock is placed above its 50, 100 and 200 DMA, which indicates bullish trend positionally.
Disclaimer: The views and investment tips expressed by investment experts on Moneycontrol.com are their own and not those of the website or its management. Moneycontrol.com advises users to check with certified experts before taking any investment decisions.

Discover the latest Business News, Sensex, and Nifty updates. Obtain Personal Finance insights, tax queries, and expert opinions on Moneycontrol or download the Moneycontrol App to stay updated!
Find the best of Al News in one place, specially curated for you every weekend.
Stay on top of the latest tech trends and biggest startup news.