By Vinay Rajani, CMT, senior technical & derivative analyst at HDFC Securities
On May 3, 2024, the Nifty formed triple top resistance near 22,800 and reversed south. On the week ended May 3, Nifty formed long “Doji” candlestick pattern on weekly chart, which indicates the indecision of a trend for the short term. Therefore, recent swing high of 22,800 becomes strong hurdle for the Nifty, and unless that is taken out, aggressive longs should be avoided.
On the downside, supports for the Nifty are seen at 22,286 and 22,166, which happens to be 50 percent and 61.8 percent Fibonacci retracement levels of the entire rally seen from 21,777 (bottom of April 19, 2024) to 22,794 (all-time high registered on May 3).
At 48,677, BankNifty retraced 38.2 percent of the entire rally seen from 46,579 to 49,974. Supports for the BankNifty are seen at 48,276 and 47,876. Positional bullish trend of BankNifty is Intact as it has been forming higher tops and higher bottoms on weekly line chart.
The Nifty Smallcap 100 and Microcap 250 indices have violated the crucial supports of upward sloping trendline, adjoining previous swing lows on the daily chart.
Considering the technical evidence, we see benchmark indices like Nifty and BankNifty oscillating in the range. For Nifty, the range should be 22,200-22,800, while in BankNifty, range should remain 48,300-49,500 for next couple of weeks. However, looking at the close of Smallcap and microcap indices, traders should remain cautious in those segments.
Here are three buy calls for short term:
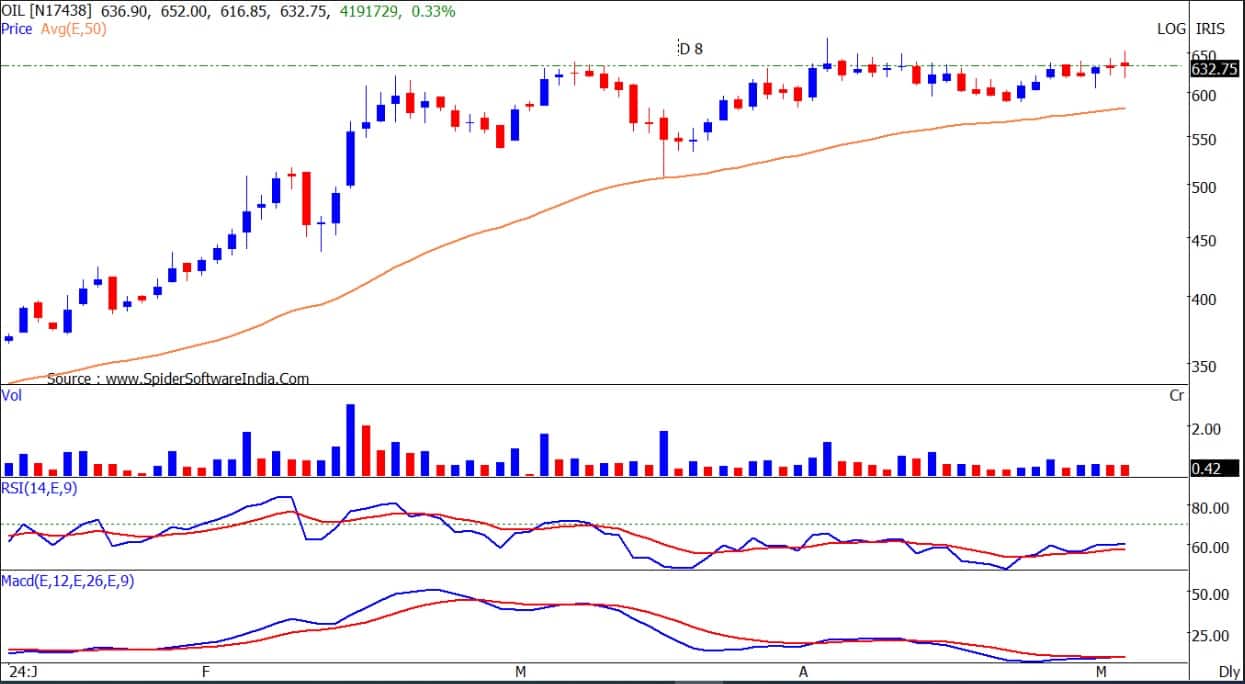
Oil India: Buy | LTP: Rs 633 | Stop-Loss: Rs 590 | Target: Rs 725 | Return: 14.5 percent
The stock has been consolidating in the narrow range for last 6 sessions. Primary trend of the stock has been bullish as it has been forming higher tops and higher bottoms.
The stock is placed above all important moving averages, indicating bullish trend on all time frames. Indicators and oscillators have been showing strength in the current uptrend.
Tamil Nadu Newsprint & Papers (TNPL): Buy | LTP: Rs 285 | Stop-Loss: Rs 269 | Target: Rs 315 | Return: 10.5 percent
The stock price has witnessed some running correction in the last two trading sessions. However, on May 2, 2024, the stock broke out from Bullish Inverted Head and Shoulder pattern on the daily chart.
Price rise was accompanied by rise in volumes. Primary trend of the stock has been bullish with higher tops and higher bottoms on the daily chart. Stock price has surpassed the resistance of 50 DEMA.

Tata Steel: Buy | LTP: Rs 167.6 | Stop-Loss: Rs 157 | Target: Rs 181 | Return: 8 percent
The stock has been consolidating in the narrow range for last 6 sessions. Primary trend of the stock has been bullish as it has been forming higher tops and higher bottoms. Metal sector has been outperforming for last couple of months and that is expected to continue.
The stock is placed above all important moving averages, indicating bullish trend on all time frames.

Disclaimer: The views and investment tips expressed by investment experts on Moneycontrol.com are their own and not those of the website or its management. Moneycontrol.com advises users to check with certified experts before taking any investment decisions.

Discover the latest Business News, Sensex, and Nifty updates. Obtain Personal Finance insights, tax queries, and expert opinions on Moneycontrol or download the Moneycontrol App to stay updated!
Find the best of Al News in one place, specially curated for you every weekend.
Stay on top of the latest tech trends and biggest startup news.