


The market continued its upward journey for yet another week, and closed with moderate gains amid rangebound movement and consolidation. Volatility index India VIX traded more than one-month low, down by 6.47 percent to 11.13 levels, during the week ended June 2.
The Nifty50 settled above 18,500 and formed a bearish candlestick pattern with the upper and lower shadows on the weekly scale, but continued making higher highs for the tenth week in a row, which is a positive sign.
This week, 18,650-18,700 is expected to be a crucial hurdle and, if the index decisively surpasses this area, then 18,800-19,000 levels can't be ruled out, but still that won't be easy, whereas the 18,400-18,200 is expected to be critical support are for the index, experts said.
"Going ahead, if global markets support, we can construe last week’s price development as a pullback and from here on, we may see the Nifty resuming its upwards trajectory in the current week," Sameet Chavan, Head Research, Technical and Derivatives at Angel One said.
This view remains valid as long as cluster of support around 18,460 – 18,400 – 18,330 is not violated on a closing basis in the next couple of sessions.
On the flipside, Chavan feels the sturdy wall is visible around 18,600 – 18,670 and the moment it’s surpassed, the Nifty may see all-time high getting challenged soon. "This seems possible considering the buoyancy in the broader market. The Mid and Small cap baskets remained active throughout last week, indicating improved sentiments in the market," he said.
Mitesh Karwa, Research Analyst at Bonanza Portfolio, said it would be interesting to see how the Nifty50 behaves in the current week as the current week is of extreme importance and will decide the trend for the next leg.
Highest open interest is at 18,600 on the Call side and 18,500 on the Put side, which indicates sideways momentum.
On the indicator front, the momentum indicator Relative Strength Index RSI (14) is showing a reading of 63 and Nifty is trading above its 200-EMA (exponential moving average) at 17,714 which indicates strength, Karwa said.
Let's take a look at the top 10 trading ideas by experts for the next three-four weeks. Returns are based on the June 2 closing prices:
Expert: Nagaraj Shetti, Technical Research Analyst at HDFC Securities
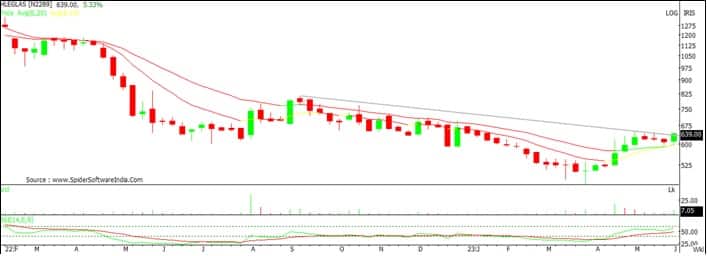
HLE Glascoat: Buy | LTP: Rs 638 | Stop-Loss: Rs 595 | Target: Rs 695-750 | Return: 18 percent
After showing minor weakness with rangebound action in the last few weeks, the stock price has witnessed a sustainable upside bounce in this week amidst a rangebound broader market. The stock price has moved above the crucial resistance of downsloping trend line at Rs 635 levels marginally and closed higher. Hence, there is a higher possibility of further extension of upside momentum in the coming week.
Volume has started to expand during upside breakout in the stock price and weekly 14 period RSI (relative strength index) shows positive indication. Hence, one may expect further strengthening of upside momentum in the stock price ahead.
Buying can be initiated in HLE Glascoat at CMP (Rs 638), add more on dips down to Rs 615, wait for the upside targets of Rs 695 and next Rs 750 in 3-5 weeks, with a stop-loss of Rs 595.
Thyrocare Technologies: Buy | LTP: Rs 483.75 | Stop-Loss: Rs 450 | Target: Rs 530-575 | Return: 19 percent
After showing a narrow range movement in the last one month, the stock price showed an attempt of upside breakout of range at Rs 475 levels and closed higher on last Friday. One may also observe an attempt of upside breakout of descending trend line at Rs 480 levels. Hence, further upside could be considered as a decisive upside breakout of the hurdles.
Volume has started to expand during the upside breakout and the weekly 14 period RSI shows positive indication.
Buying can be initiated in Thyrocare at CMP (Rs 483.75), add more on dips down to Rs 468, wait for the upside targets of Rs 530 and the next Rs 575 in 3-5 weeks. One can place a stop-loss of Rs 450.

Expert: Shrikant Chouhan, Head of Equity Research (Retail) at Kotak Securities
Mphasis: Buy | LTP: Rs 2,017.65 | Stop-Loss: Rs 1,900 | Target: Rs 2,175-2,400 | Return: 19 percent
Mphasis declined sharply from highs of Rs 3,660 to Rs 1,660 during the technical selloff. It has halved from the highest level in an 18-month period. However, after hitting the low of Rs 1,660, the stock is now showing signs of upside.
It is forming a falling wedge pattern, which signals the end of the decline and the resumption of the upward momentum. Based on this, the stock can go further up to Rs 2,175 and Rs 2,400. Buying is advisable with a final stop-loss of Rs 1,900.

HEG: Buy | LTP: Rs 1,303.4 | Stop-Loss: Rs 1,100 | Target: Rs 1,500-1,700 | Return: 30 percent
The stock indicated a bottom-out formation on last Friday. It is a price and volume-based breakout for it. From March 2020, the stock was consolidating and though it rallied to Rs 2600 in the year 2021, it came back to Rs 900 in the year 2022, which was a higher bottom for the stock. Such patterns indicate a bottom-out formation.
It is advisable to buy in two parts. Buy 50 percent at the current price and the rest at Rs 1,200. Keep the final stop-loss at Rs 1,100. On the upside, the stock may move towards Rs 1,500 and Rs 1,700 in the medium term.

JSW Steel: Buy | LTP: Rs 706.60 | Stop-Loss: Rs 680 | Target: Rs 790-850 | Return: 20 percent
It is outperforming stocks in the metals sector. That's down 13 percent from the previous peak, while other stocks in the same basket are down 30 to 40 percent from the previous peak.
Technically, it is forming a bullish continuation on the weekly and monthly charts, which will propel the stock towards Rs 790 and Rs 850 in the medium term.
The Nifty Metal index has been consolidating since February 2023 and has indicated an upside breakout in the last week. We think it has started a pullback rally towards the previous peak. Buy JSW Steel with an ultimate stop-loss of Rs 680.

Expert: Ruchit Jain, Lead Research at 5paisa.com
Apollo Hospitals Enterprises: Buy | LTP: Rs 4,967.30 | Stop-Loss: Rs 4,790 | Target: Rs 5,140-5,250 | Return: 6 percent
The stock rallied higher during the week gone by and gave a breakout from its long consolidation phase on the weekly charts. The volumes along with the breakout were much better than its average which is a positive sign.
The RSI oscillator also hints at positive momentum and hence, we expect a continuation of the uptrend in the short term.
Traders can buy this stock around current market price of Rs 4.967 and look to add on any dips towards Rs 4,650. The potential short term targets are expected around Rs 5,140 and Rs 5,250. The stop-loss for long positions should be placed below Rs 4,790.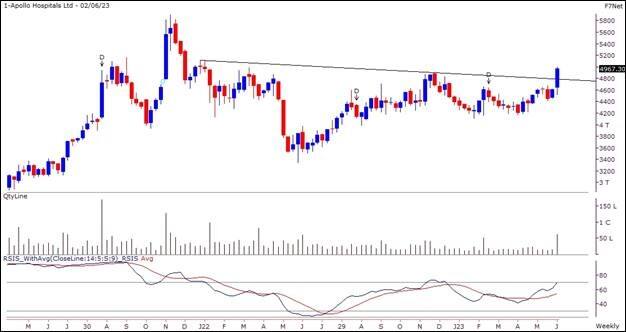
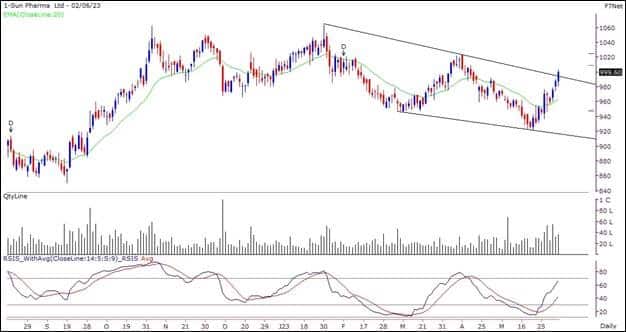
Sun Pharmaceutical Industries: Buy | LTP: Rs 999.6 | Stop-Loss: Rs 967 | Target: Rs 1,034-1,054 | Return: 5.4 percent
The pharma stocks have been showing a positive momentum and this heavyweight has given a breakout from a channel.
The volumes have been increasing gradually and the RSI is hinting at a positive momentum.
Hence, short term traders can look to buy the stock in the range of Rs 1,000-990 for potential targets of Rs 1,034 and Rs 1,054. The stop-loss for long positions should be placed below Rs 967.
Expert: Mitesh Karwa, Research Analyst at Bonanza Portfolio
Home First Finance Company: Buy | LTP: Rs 761.95 | Stop-Loss: Rs 720 | Target: Rs 840 | Return: 10 percent
The stock has broken out of a downward sloping trendline with a big bullish candlestick after taking support at a very important support zone on the weekly timeframe and closed above the highs of last thirteen weeks, whereas the supertrend indicator is also indicating a bullish continuation trend which can be used as a confluence towards the bullish view.
On the indicator front, the Ichimoku Cloud is also suggesting a bullish move as the price is trading above the conversion line, base line and cloud. Momentum oscillator RSI (14) is at around 72 on the daily time frame indicating strength by sustaining above 50.
Observation of the above factors indicates that a bullish move in Home First is possible for target upto Rs 840. One can initiate a buy trade in between the range of Rs 757-761, with a stop-loss of Rs 720 on daily closing basis.

Radico Khaitan: Buy | LTP: Rs 1,197.60 | Stop-Loss: Rs 1,145 | Target: Rs 1,300 | Return: 8.5 percent
Radico has taken support at the support trendline of an upward sloping parallel channel pattern and closing with a bullish candlestick pattern on the weekly timeframe above the highs of last seven weeks. The stock is also trading above important EMAs (exponential moving average) of 20/50/100/200 which indicates strength.
On the indicator front, the supertrend indicator is indicating a bullish reversal, and momentum oscillator RSI (14) is at around 72 on the daily time frame indicating strength by sustaining above 50. The Ichimoku Cloud is also suggesting a bullish move as the price is trading above the conversion line, base line and cloud on the daily timeframe.
Observation of the above factors indicates that a bullish move in Radico is possible for target upto Rs 1,300. One can initiate a buy trade in the range of Rs 1,194-1,197 with stop-loss of Rs 1,145 on daily closing basis.

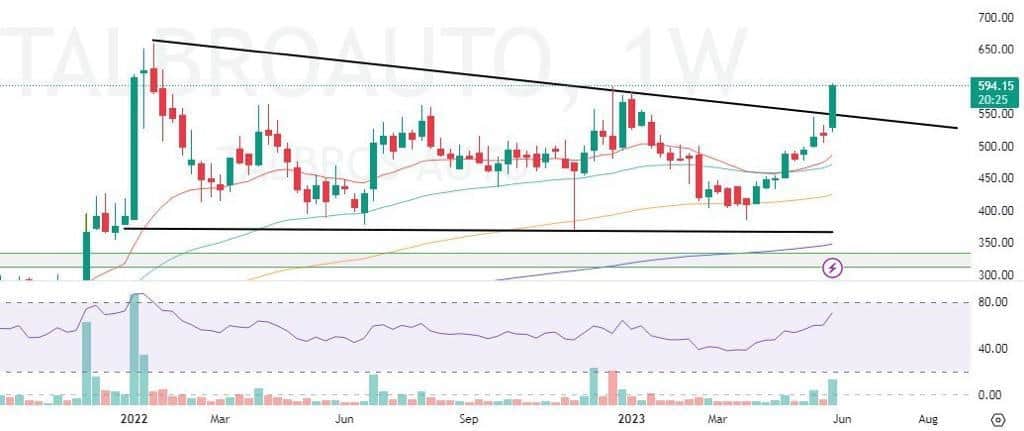
Talbros Automotive Components: Buy | LTP: Rs 592.2 | Stop-Loss: Rs 545 | Target: Rs 670 | Return: 13 percent
Talbros Automotive has broken and sustained above the breakout of a descending triangle pattern on the weekly timeframe with a bullish candlestick and is trading above all its important EMAs on the daily timeframe which indicates bullish strength.
The supertrend indicator is also indicating a bullish continuation which supports the bullish view. Momentum oscillator RSI (14) is at around 81 on the daily timeframe indicating strength by sustaining above 50 and the Ichimoku Cloud is also suggesting a bullish move as the price is trading above the conversion line, base line and cloud.
Observation of the above factors indicates that a bullish move in Talbros is possible for target upto Rs 670. One can initiate a buy trade in between the range of Rs 588-592, with a stop-loss of Rs 545 on daily closing basis.
Disclaimer: The views and investment tips expressed by investment experts on Moneycontrol.com are their own and not those of the website or its management. Moneycontrol.com advises users to check with certified experts before taking any investment decisions.
Discover the latest Business News, Sensex, and Nifty updates. Obtain Personal Finance insights, tax queries, and expert opinions on Moneycontrol or download the Moneycontrol App to stay updated!
Find the best of Al News in one place, specially curated for you every weekend.
Stay on top of the latest tech trends and biggest startup news.


