
Lok Sabha elections in 2019 saw a voter turnout of 67.40%, the highest-ever in India's history. This means that roughly 61.5 crore voters cast their ballot in the previous elections out of the 91.2 crore who were eligible to vote.
The gigantic number is of course greater than the population of every country in the world except China.
This year too, nearly 97 crore voters are eligible to cast their vote in the elections.
The voting trends often vary from state to state due to various factors like urbanisation, literacy, issues dominating the elections, among others.
The graph below shows the state-wise breakdown of voter turnout figures.
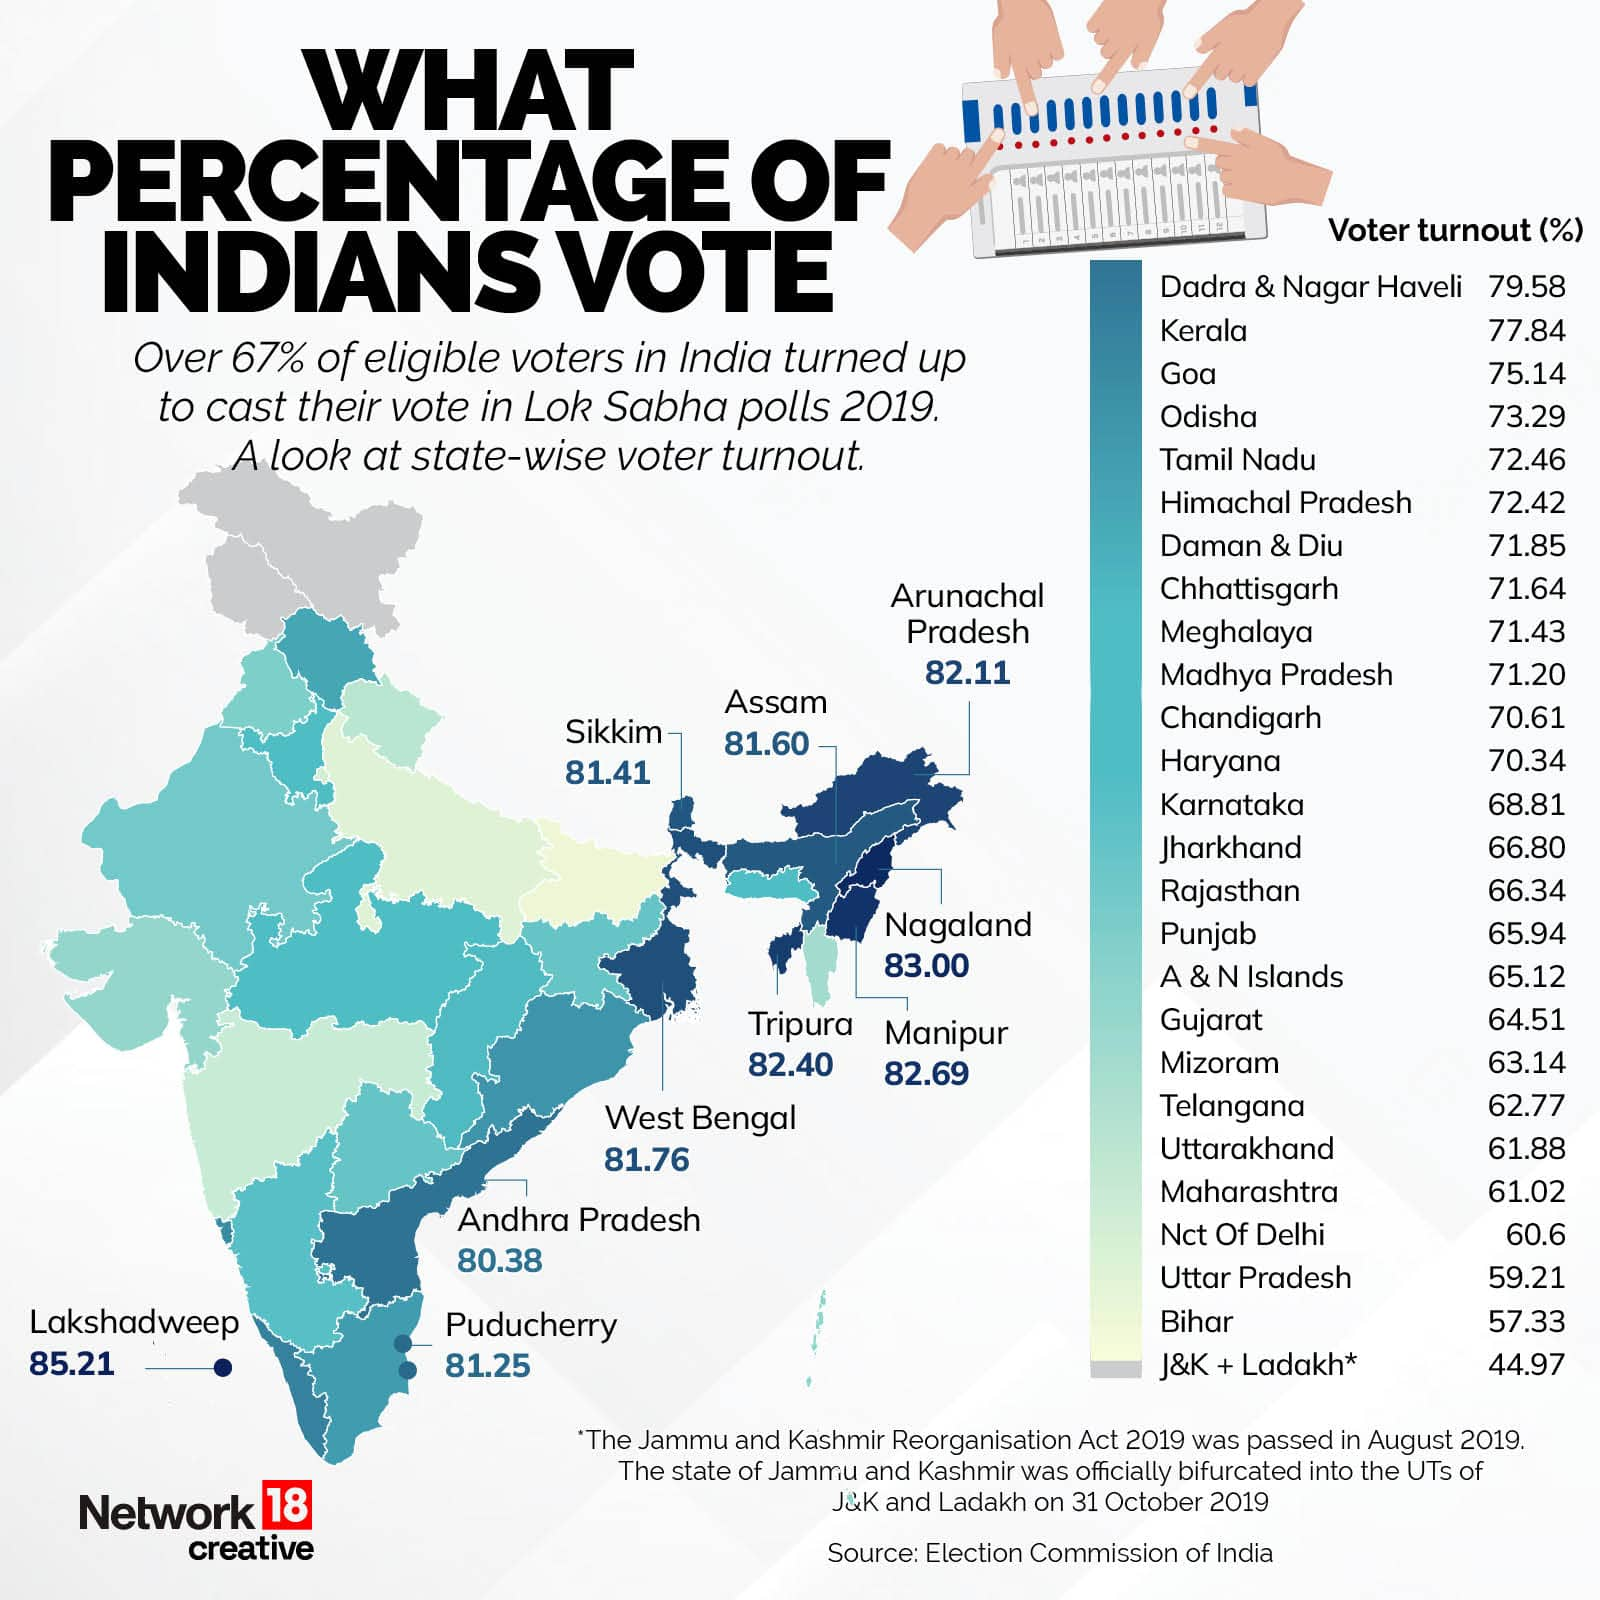 How India voted in 2019 Lok Sabha polls: A state-wise breakdown
The data shows that among the states, Nagaland logged the highest turnout at 83% while J&K saw the lowest at 44.9%.
States like Bihar and Uttar Pradesh also recorded a low voter turnout at 59.21% and 57.33% respectively.
Among the southern states, Telangana saw the worst turnout at 62.7% while neighbour Andhra Pradesh saw an above-average turnout at 80.3%.
The map clearly shows that most northeastern states recorded a high turnout while their western counterparts like Gujarat, Rajasthan and Maharashtra saw a below-average turnout.
As many as 13 states/UTs recorded a poorer turnout than the national average.
Overall, the Union Territory of Lakshadweep saw the best turnout with 85% of the population casting their vote.
Discover the latest Business News, Sensex, and Nifty updates. Obtain Personal Finance insights, tax queries, and expert opinions on Moneycontrol or download the Moneycontrol App to stay updated!


