
The benchmark indices saw another rangebound and volatile session, closing moderately higher on September 5, with the market breadth slightly in favour of the bulls. About 1,411 shares advanced compared to 1,365 declining shares on the NSE. The market is expected to see consolidation until it sees a breakout over the previous week's high. Below are some short-term trading ideas to consider:
Rajesh Palviya, Senior Vice President Research (Head Technical Derivatives) at Axis Securities
Tega Industries | CMP: Rs 2,064.2
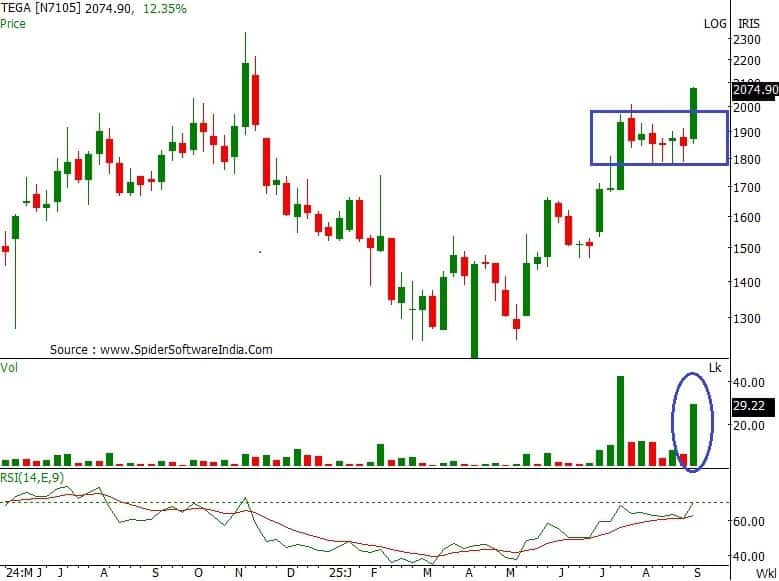
On the daily and weekly charts, Tega Industries is trending higher, forming a series of higher tops and bottoms, indicating a sustained uptrend. On the weekly chart, the stock has confirmed a "multiple resistance zone" breakout at Rs 1,990 levels on a closing basis, which shows a resumption of the prior uptrend. This breakout is accompanied by huge volumes, indicating increased participation.
The daily, weekly, and monthly strength indicator RSI indicates rising strength. The stock is well placed above its 20, 50, 100, and 200-day SMAs, which reconfirms a bullish trend, and these averages are also inching up along with the price rise, further confirming a bullish trend. The daily Bollinger Bands buy signal indicates increased momentum.
Strategy: Buy
Target: Rs 2,380, Rs 2,460
Stop-Loss: Rs 1,980
Eternal | CMP: Rs 329.15
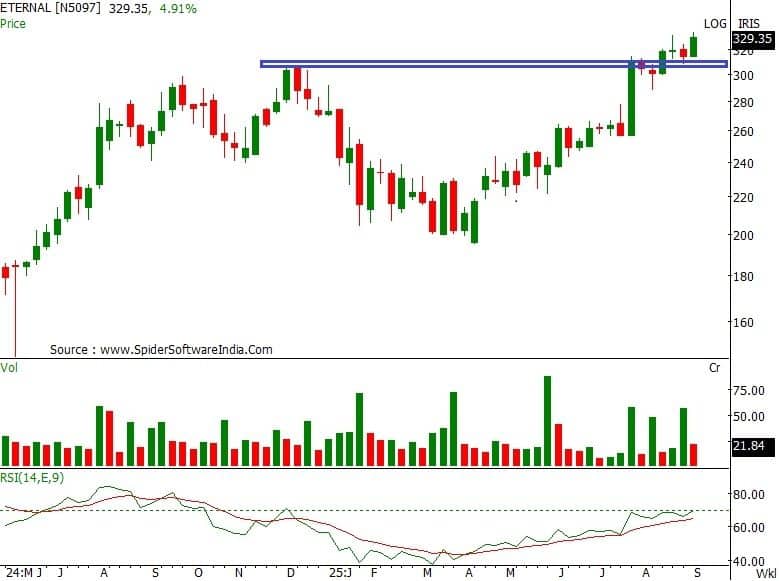
Eternal is in a strong uptrend, forming a series of higher tops and bottoms, representing a strong uptrend. It has also registered an all-time high at Rs 334, which reconfirms bullish sentiments. The stock is well placed above its 20, 50, 100, and 200-day SMAs, which reconfirms a bullish trend, and these averages are also inching up along with the price rise, further confirming a bullish trend. The daily, weekly, and monthly strength indicator RSI indicates rising strength.
Strategy: Buy
Target: Rs 346, Rs 360
Stop-Loss: Rs 320
Exide Industries | CMP: Rs 412.75

On the weekly chart, Exide Industries has confirmed a trend reversal around Rs 410 levels, forming higher tops and bottoms. This shows a positive bias on the short- and medium-term charts. The stock is well placed above its "multiple resistance" zone of Rs 400 levels on a weekly closing basis. This breakout is accompanied by high volumes, which shows increased participation.
The stock is well placed above its 20, 50, 100, and 200-day SMAs, which reconfirms a bullish trend, and these averages are also inching up along with the price rise, further confirming a bullish trend. The daily, weekly, and monthly strength indicator RSI indicates rising strength. The daily and weekly Bollinger Bands buy signal indicates increased momentum.
Strategy: Buy
Target: Rs 450, Rs 470
Stop-Loss: Rs 405
Rajesh Bhosale, Technical Analyst at Angel One
Ashok Leyland | CMP: Rs 130.77
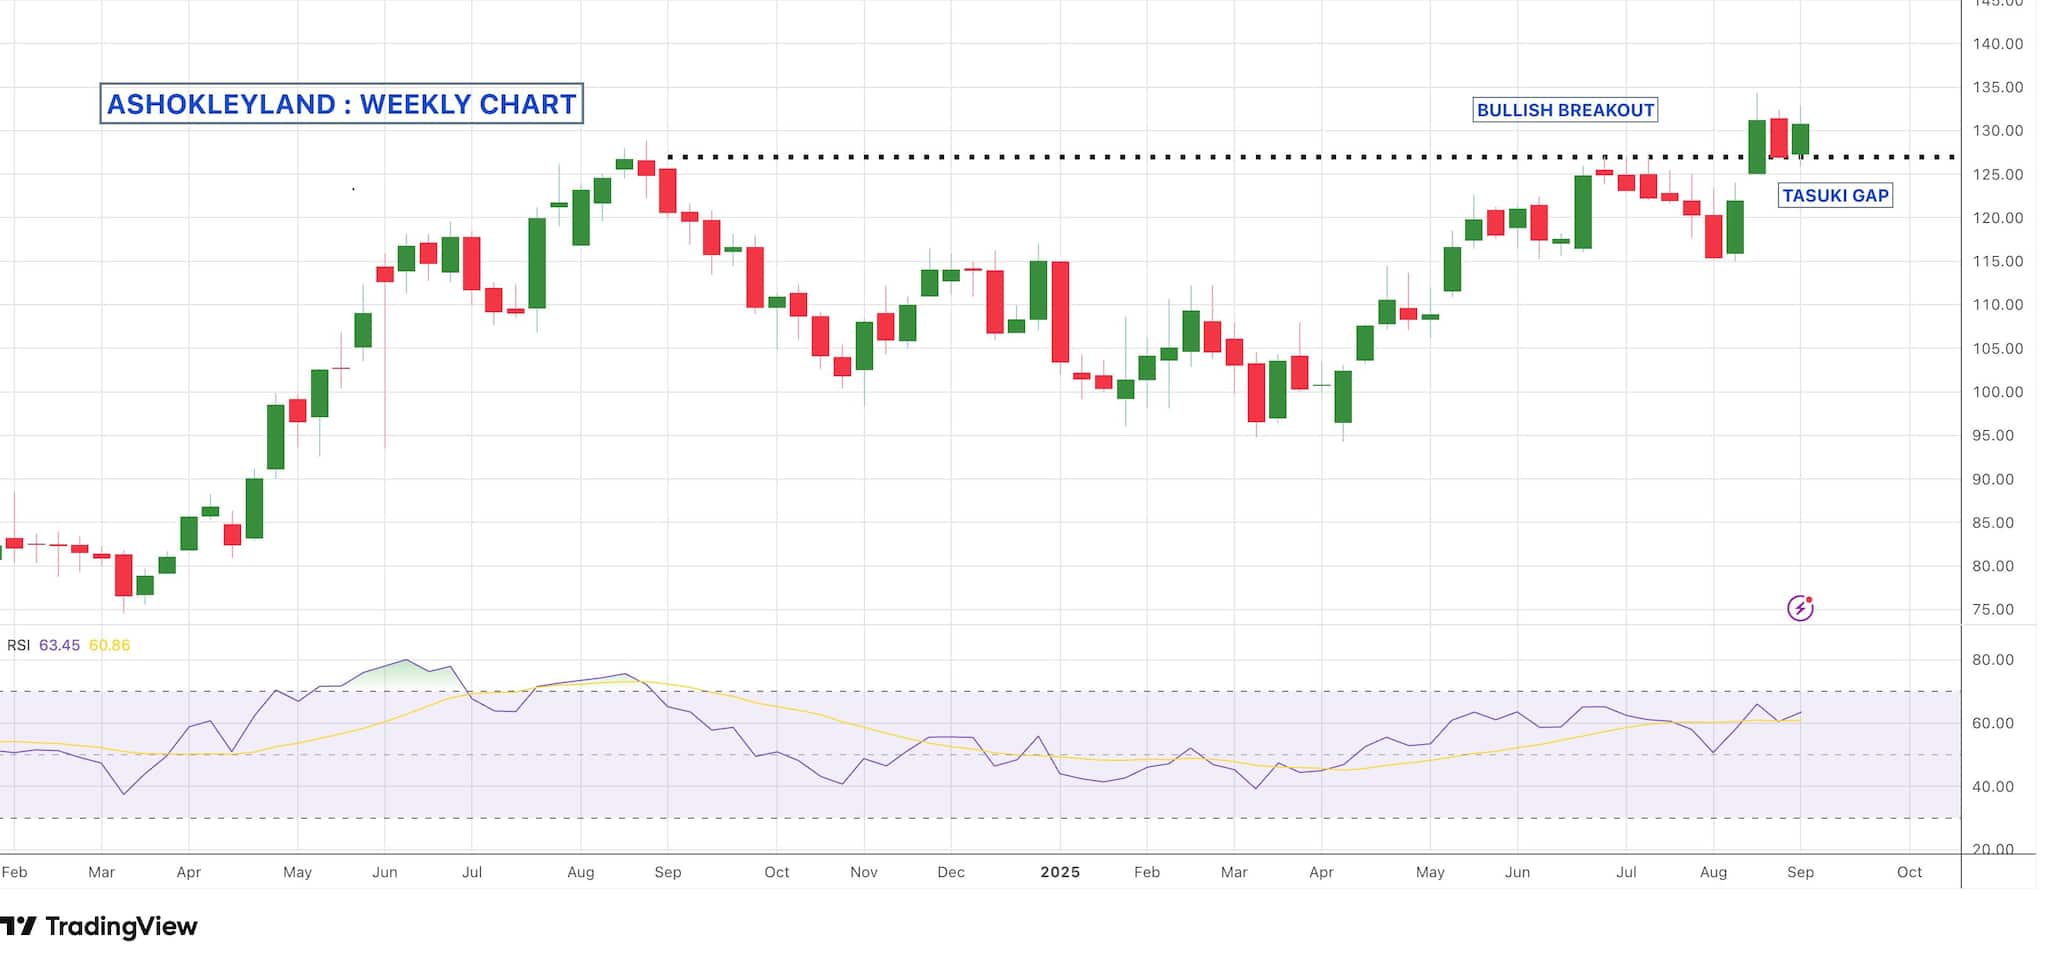
Ashok Leyland prices continue to trend higher in a steady higher-top, higher-bottom formation, recently breaking past a key resistance level and confirming a bullish continuation setup. The breakout occurred with a Bullish Tasuki Gap, which not only highlights strong trend momentum but is also acting as a solid support zone on declines. Adding to the positive structure, the RSI across all major time frames has crossed above 60, reinforcing the strength of the uptrend and supporting a constructive outlook.
Strategy: Buy
Target: Rs 145
Stop-Loss: Rs 124
Dixon Technologies | CMP: Rs 17,855
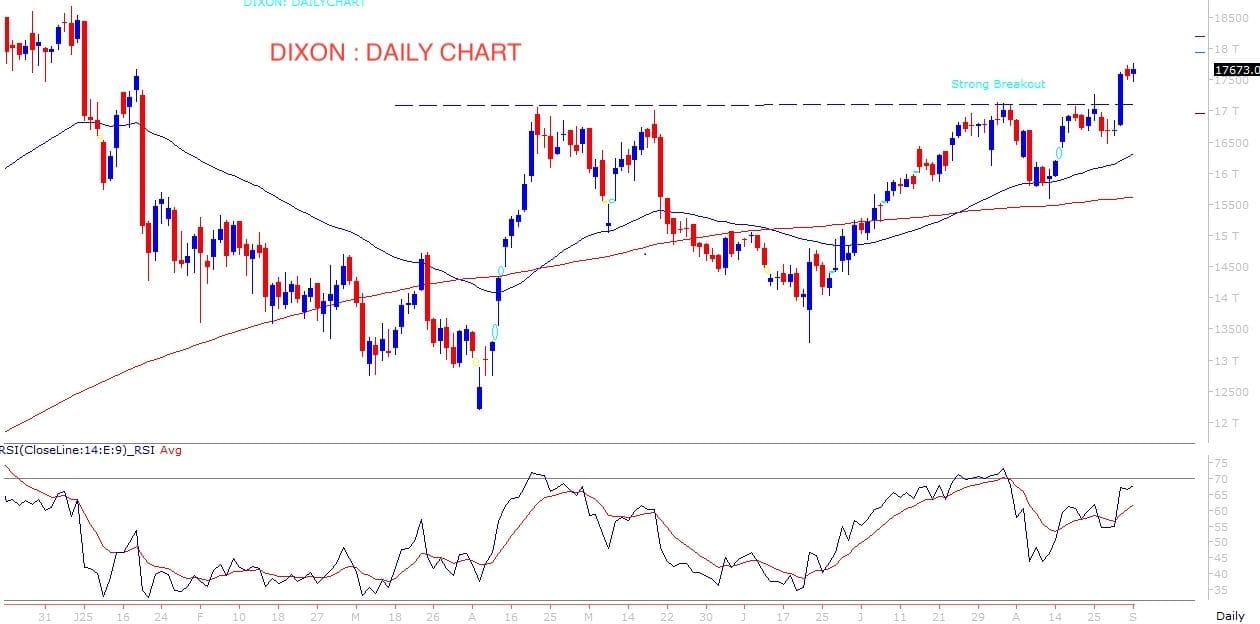
Dixon Technologies has broken out of a multi-month resistance with strong volumes and a bullish candlestick, confirming underlying strength. A golden crossover of the 50-EMA above the 200-SMA adds positive long-term implications, while prices moving above the 61.8% retracement of the decline from all-time highs signals a likely resumption of the primary uptrend. Importantly, volumes are aligning with the trend — rising during up moves and easing during dips — which validates the sustainability of the ongoing bullish structure.
Strategy: Buy
Target: Rs 19,900
Stop-Loss: Rs 16,770
NMDC | CMP: Rs 74.5

After consolidating in a range for the past few months, NMDC has broken out last week, confirming a symmetrical triangle bullish pattern. Such breakouts typically pave the way for strong trending moves, and this one is reinforced by a bullish candlestick with high volumes. Adding to the conviction, prices are trading well above key moving averages, underscoring the strength of the overall positive structure.
Strategy: Buy
Target: Rs 81
Stop-Loss: Rs 71
Disclaimer: The views and investment tips expressed by investment experts on Moneycontrol.com are their own and not those of the website or its management. Moneycontrol.com advises users to check with certified experts before taking any investment decisions.
Discover the latest Business News, Sensex, and Nifty updates. Obtain Personal Finance insights, tax queries, and expert opinions on Moneycontrol or download the Moneycontrol App to stay updated!


