


Benchmark indices bounced back after a day of correction, with the Nifty 50 rising more than half a percent on October 9, with almost equal market breadth. About 1,418 shares advanced against 1,392 declining shares on the NSE. The market may see rangebound trading until it decisively surpasses and sustains Tuesday's high. Below are some short-term trading ideas to consider:
Jay Mehta, Technical Research at JM Financial Services
Gujarat Fluorochemicals | CMP: Rs 3,791.1

Gujarat Fluorochemicals broke out above a long-term descending triangle resistance trendline in early September, supported by robust volume. The stock is currently retesting the breakout zone, establishing a short-term base between Rs 3,600–3,700. Recent sessions show a breakout above a tight range, with the hourly chart displaying a double bottom pattern and positive momentum divergence.
Daily and weekly momentum indicators reflect bullish strength, with RSI holding above 50 on both timeframes, signalling a healthy trend. The price trades above all key EMAs, providing support during potential dips.
Strategy: Buy
Target: Rs 4,000, Rs 4,100
Stop-Loss: Rs 3,500
Mahindra and Mahindra Financial Services | CMP: Rs 281.35
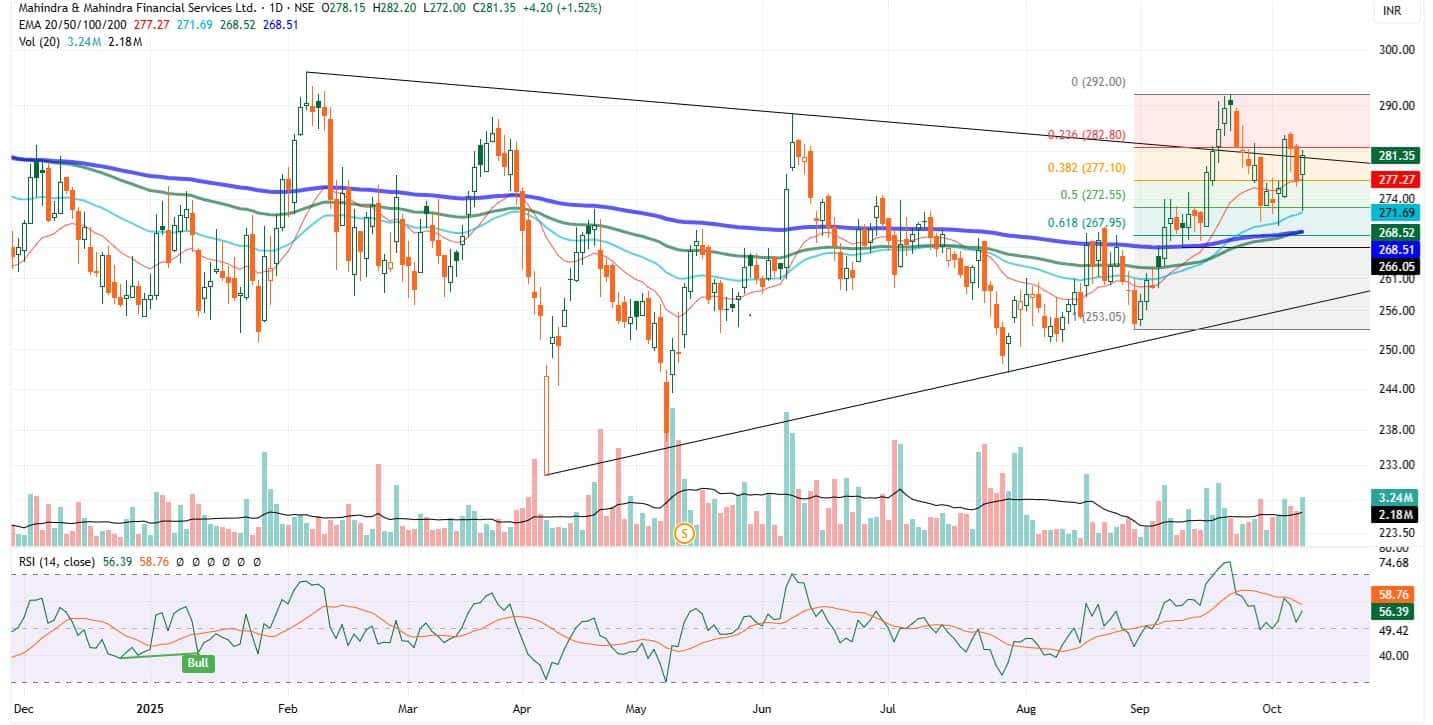
M&M Financial Services broke out above a long-term symmetrical triangle in early September, backed by strong volume, indicating significant accumulation. The stock recently pulled back to the 50% Fibonacci retracement of its rally, finding support at the 50-day EMA, and is now gaining upward traction.
Daily and weekly momentum indicators signal bullish strength, with RSI maintaining support above 50, a positive sign. The price is above all key EMAs, which should act as support on dips. Recent sessions show a strong recovery post-50-day EMA test, with above-average volume surges.
Strategy: Buy
Target: Rs 300, Rs 322
Stop-Loss: Rs 266
IDFC First Bank | CMP: Rs 73.45
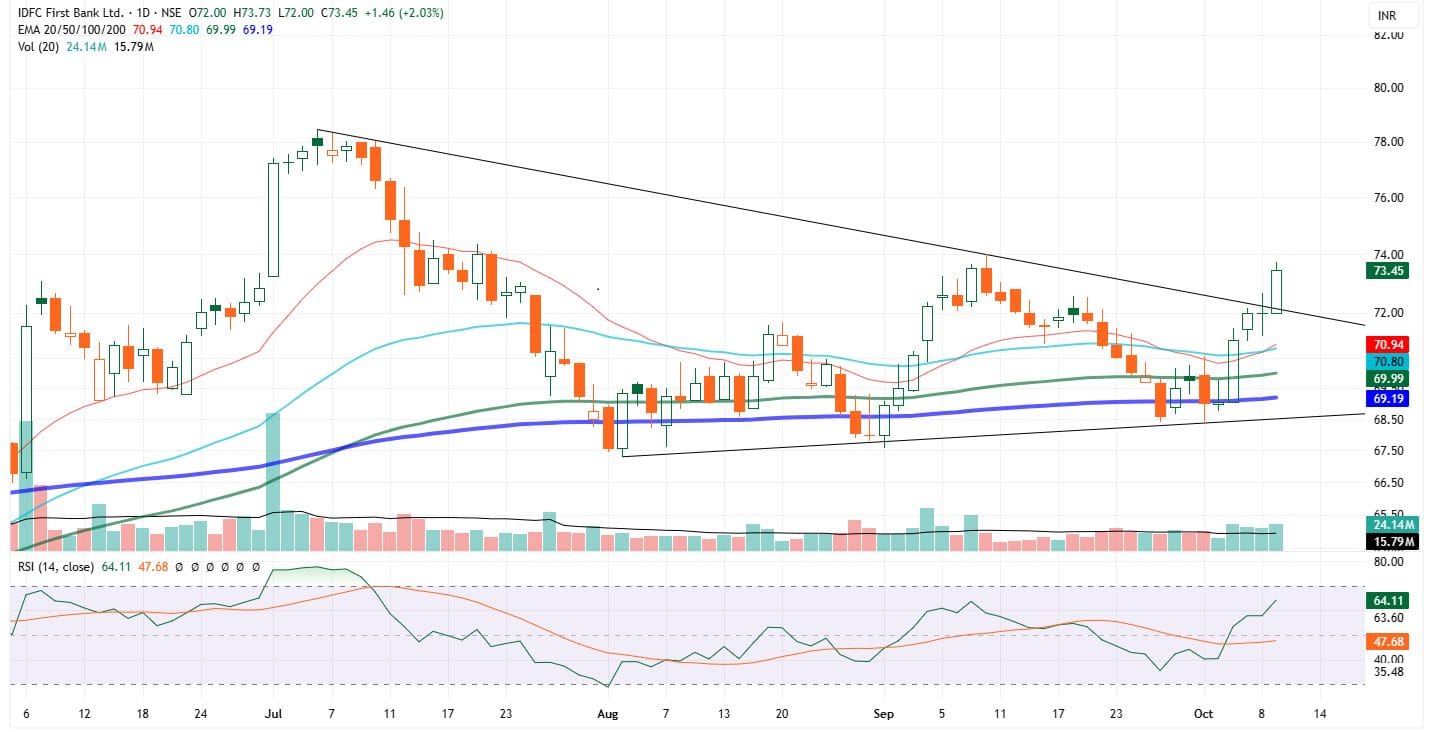
IDFC First Bank recently broke out above a three-month triangular consolidation, supported by positive volume buildup over the past four sessions. Above-average trading volumes indicate strong participation.
Daily and weekly momentum indicators show bullish strength, with the weekly RSI forming a double bottom pattern and holding above 50, reinforcing the positive trend. The price trades above all key EMAs, which will support any dips.
A pullback to the Rs 71–71.8 retest zone offers a buying opportunity, with resistance at Rs 74; a breakout above this could intensify bullish momentum.
Strategy: Buy
Target: Rs 77, Rs 82
Stop-Loss: Rs 68
Amruta Shinde, Technical & Derivative Analyst at Choice Broking
Tata Steel | CMP: Rs 176.42

Tata Steel has given a breakout from a narrow consolidation range of Rs 166–175, forming a strong bullish candle that indicates renewed buying momentum and a potential continuation of the uptrend. The stock is also shaping a long-term rounding bottom pattern with a series of higher highs and higher lows, suggesting a sustained structural reversal and strengthening bullish sentiment.
A decisive breakout above Rs 180 on strong volumes could trigger a near-term rally toward Rs 185–200.
Technical indicators remain constructive, with the RSI at 64.64, reflecting strengthening momentum without being overbought. The stock’s position above all key moving averages (20/50/100/200-day EMAs) underscores robust short- and medium-term trends.
On the downside, immediate support lies at Rs 166, followed by a secondary cushion at Rs 160, providing potential buying opportunities on pullbacks. Overall, the near-term bias remains positive, and a sustained close above Rs 180 could trigger a fresh leg of the rally, reinforcing the bullish outlook for Tata Steel.
Strategy: Buy
Target: Rs 185, Rs 200
Stop-Loss: Rs 166
BSE | CMP: Rs 2,330

BSE has rebounded from lower levels, indicating renewed buying interest. On the daily charts, the stock has broken a falling trendline with the formation of a strong bullish candle, reflecting robust upward momentum.
It has also surpassed its major resistance zone around Rs 2,300 on increased volume, signalling strong investor participation and the likelihood of trend continuation.
Technically, the RSI stands at 61.45, suggesting healthy bullish momentum without being overbought. The stock is trading above its 20-, 50-, and 200-day EMAs, reflecting strength across short-, medium-, and long-term trends.
Immediate resistance is seen at Rs 2,400, and a decisive close above this level could confirm a trend reversal and open the path toward Rs 2,550–2,828. On the downside, key support levels are placed at Rs 2,200 and Rs 2,107 (20-day EMA), with a breakdown below these levels warranting caution.
Strategy: Buy
Target: Rs 2,400, Rs 2,550, Rs 2,828
Stop-Loss: Rs 2,200
Fortis Healthcare | CMP: Rs 1,068.85

Fortis Healthcare is displaying strong bullish momentum with a consistent pattern of higher highs and higher lows. The stock recently touched an all-time high of Rs 1,072, supported by rising volumes that confirm strong investor participation and sustained upward momentum.
It is approaching a key resistance level at Rs 1,100, and a decisive breakout above this could drive a swift rally toward Rs 1,150–Rs 1,200.
Technically, Fortis trades above all major EMAs (20, 50, 100, and 200-day) — all trending upward — reaffirming strength across short-, medium-, and long-term timeframes. The RSI at 73.18 indicates strong momentum, though nearing overbought territory, suggesting a possible brief consolidation.
On the downside, immediate support is at Rs 1,034, with Rs 1,000 serving as a key stop-loss for risk management.
Strategy: Buy
Target: Rs 1,100, Rs 1,150, Rs 1,200
Stop-Loss: Rs 1,034
Om Mehra, Technical Research Analyst at Samco Securities
National Aluminium Company | CMP: Rs 229.55
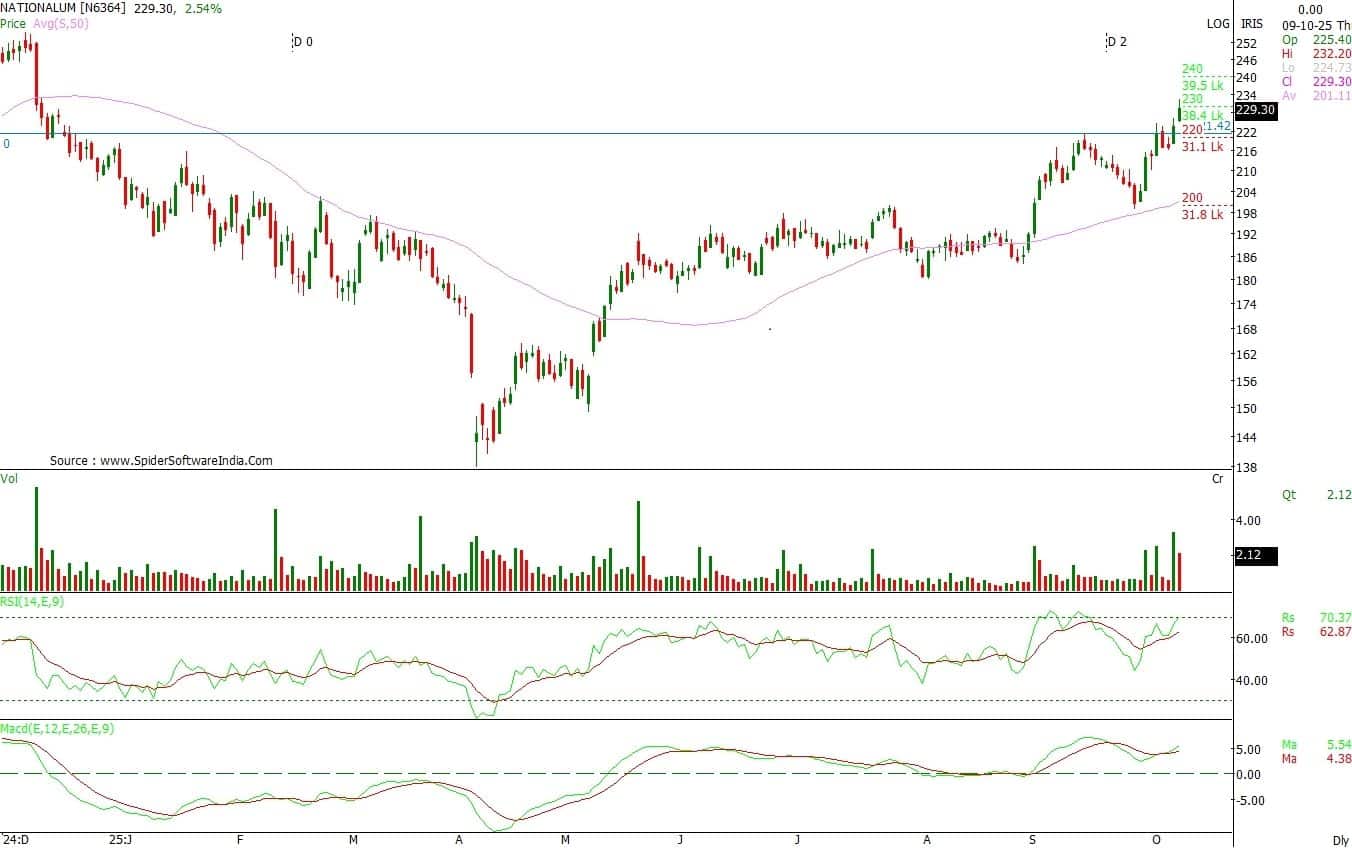
National Aluminium Company has witnessed a strong breakout above the Rs 220–222 zone, accompanied by a steady rise in volumes. The stock is sustaining well above all major moving averages and continues to form a higher-high, higher-low pattern, confirming trend strength.
The volume expansion aligns with the price rise, indicating a sustained trend.
The RSI has surged to 70, maintaining a positive slope, while the MACD holds a bullish crossover with supportive histogram bars. The overall setup points to sustained momentum with potential for further upside.
Strategy: Buy
Target: Rs 245
Stop-Loss: Rs 221
Swiggy | CMP: Rs 436.9

Swiggy has formed a strong bullish candle after undergoing a short-term consolidation phase. The stock maintains a higher-high formation and holds comfortably above all key moving averages, indicating a stable trend.
A strong base has formed near the Rs 422 zone, providing firm support for the ongoing move.
The RSI has recovered to 56, reflecting an improvement in strength, while the MACD has turned positive, confirming a pickup in momentum. The surge in volumes alongside the price rise adds further confirmation to the positive setup.
Strategy: Buy
Target: Rs 460
Stop-Loss: Rs 418
CESC | CMP: Rs 170.25
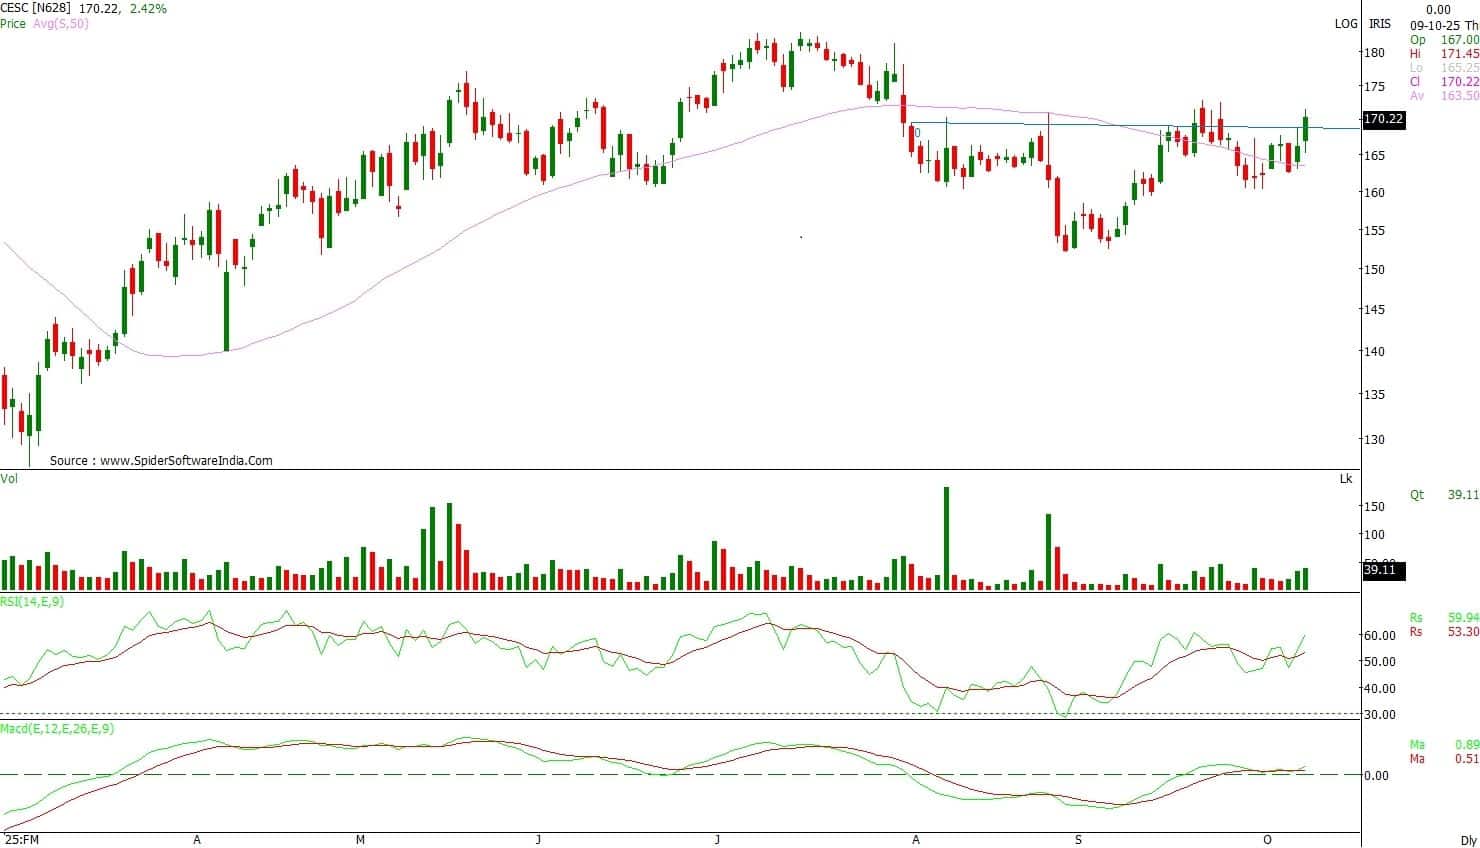
CESC has shown a strong recovery and is on the verge of a breakout above the neckline of an inverted head and shoulders pattern. The stock is sustaining above key moving averages, with the 20-EMA crossing above the 50-EMA.
The RSI has moved up to 60, maintaining an upward slope, while the MACD holds a positive crossover, both validating the emerging bullish setup.
The recent surge in volumes adds further confirmation, while the weekly chart also remains positive.
Strategy: Buy
Target: Rs 184
Stop-Loss: Rs 164
Disclaimer: The views and investment tips expressed by experts on Moneycontrol are their own and not those of the website or its management. Moneycontrol advises users to check with certified experts before taking any investment decisions.
Discover the latest Business News, Sensex, and Nifty updates. Obtain Personal Finance insights, tax queries, and expert opinions on Moneycontrol or download the Moneycontrol App to stay updated!
Find the best of Al News in one place, specially curated for you every weekend.
Stay on top of the latest tech trends and biggest startup news.


