


The Nifty is likely to face an immediate hurdle at 22,500 in the coming session, given its sustained upward sloping resistance trendline adjoining previous record highs and continuation of higher-highs, higher-lows, but with some volatility and consolidation considering the formation of a Doji candlestick pattern at the top in the previous session. Immediate support is placed at the 22,200 level, experts said.
On March 4, the benchmark indices continued southward journey for fourth consecutive session and ended at new closing high. The Nifty 50 was up 27 points at 22,406, and the BSE Sensex rose 66 points to 73,872, while the Nifty Midcap 100 index gained 0.2 percent and Smallcap 100 index fell half a percent.
Stocks that reported better performance than broader markets included Piramal Enterprises, BHEL, and KEI Industries. Piramal Enterprises has seen a breakout of downward sloping resistance trendline adjoining highs of September 11 last year and February 21 this year on March 4. The stock rallied 3.4 percent to Rs 966.85 and formed bullish candlestick pattern on the daily charts with above average volumes, while it started trading above all key moving averages.
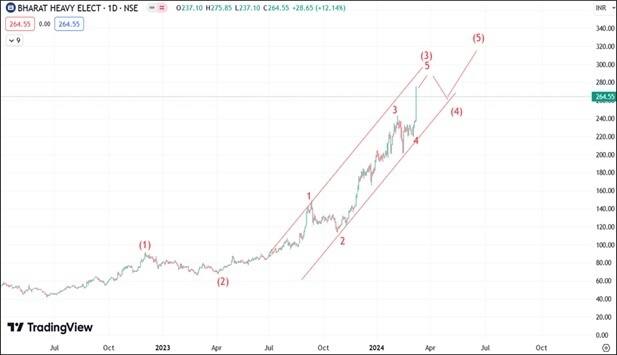
BHEL has decisively surpassed its previous swing high (of February 5 which was in fact the highest level since 2011) and rose 12 percent to Rs 264.55, the highest closing level since July 25, 2011. The stock has formed long bullish candlestick pattern on the daily charts, with robust volumes, and traded above all key moving averages.
KEI Industries jumped 6.4 percent to end at record closing high of Rs 3420 and formed strong bullish candlestick pattern on the daily charts with healthy volumes. The stock has seen a breakout of downward sloping resistance trendline adjoining highs of January 5 and February 16, and traded above all key moving averages.

Here's what Ashish Kyal of Waves Strategy Advisors recommends investors should do with these stocks when the market resumes trading today:
BHEL has rallied by more than 300 percent over a year. The overall outlook for stock still remains bullish as long as prices sustains above Rs 240 levels.
Currently the stock is moving higher in the form of wave 5 of (3) and there is more room on upside. For better risk reward it is best to use dips as buying opportunity for the target of Rs 290 - 300 levels.
In a nutshell, outlook for BHEL is positive over short term as long as Rs 240 is intact on closing basis.
On the daily chart, we can see that price is moving in a rectangular range over the last few months indicating accumulation in the stock. Price has failed to give a close outside the range yet which is much awaited. Also, volumes are picking up. KST (know sure thing) is suggesting that good momentum is expected in this stock.
After giving a breakout of the Ichimoku cloud, prices moved up sharply which is a good sign. Overall signs are suggesting that breakout of the consolidated range is expected in this stock.
In short, view for Piramal Enterprises is bullish. If it gives a daily close above Rs 975 levels then further upward movement can be seen with the targets of Rs 1,010 as long as Rs 939 holds on the downside.
The stock is consolidating within an Ascending Triangle Pattern. In the previous session, prices have just given a close on the horizontal line. But it will be too soon to conclude anything as long as we do not see a follow up buying with a daily close above Rs 3,421 levels.
We have also used Bollinger bands indicator. The bands have just started expanding which is suggesting that good momentum can be seen in coming sessions in this stock.
In short, the view for KEI Industries is bullish. A daily close above Rs 3,421 can confirm breakout of the Triangle pattern which can take price higher towards Rs 3,500-3,530 levels, while on the downside Rs 3,315 can act as a crucial support.

Follow Ashish Kyal on Twitter - @kyalashish
Disclaimer: The views and investment tips expressed by investment experts on Moneycontrol.com are their own and not those of the website or its management. Moneycontrol.com advises users to check with certified experts before taking any investment decisions.
Discover the latest Business News, Sensex, and Nifty updates. Obtain Personal Finance insights, tax queries, and expert opinions on Moneycontrol or download the Moneycontrol App to stay updated!
Find the best of Al News in one place, specially curated for you every weekend.
Stay on top of the latest tech trends and biggest startup news.


