


The benchmark indices fell sharply by 1.5 percent after a three-day consolidation and rangebound trade on November 28, but the breadth remained positive. About 1,331 shares advanced, while 1,143 shares declined on the NSE. The market may try to rebound on the first day of the December series, but sustainability is the key factor to watch. Below are some trading ideas for the near term:
Amol Athawale, VP-Technical Research at Kotak Securities
Punjab National Bank | CMP: Rs 106.3

After a decline from higher levels, Punjab National Bank rebounded from its support zone and witnessed a steady recovery from the lower levels. Additionally, on the weekly charts, the stock has given a breakout from its sloping channel formation. The upward moves suggest a new leg of a bullish trend from the current levels.
Strategy: Buy
Target: Rs 115
Stop-Loss: Rs 102
LIC Housing Finance | CMP: Rs 634.7
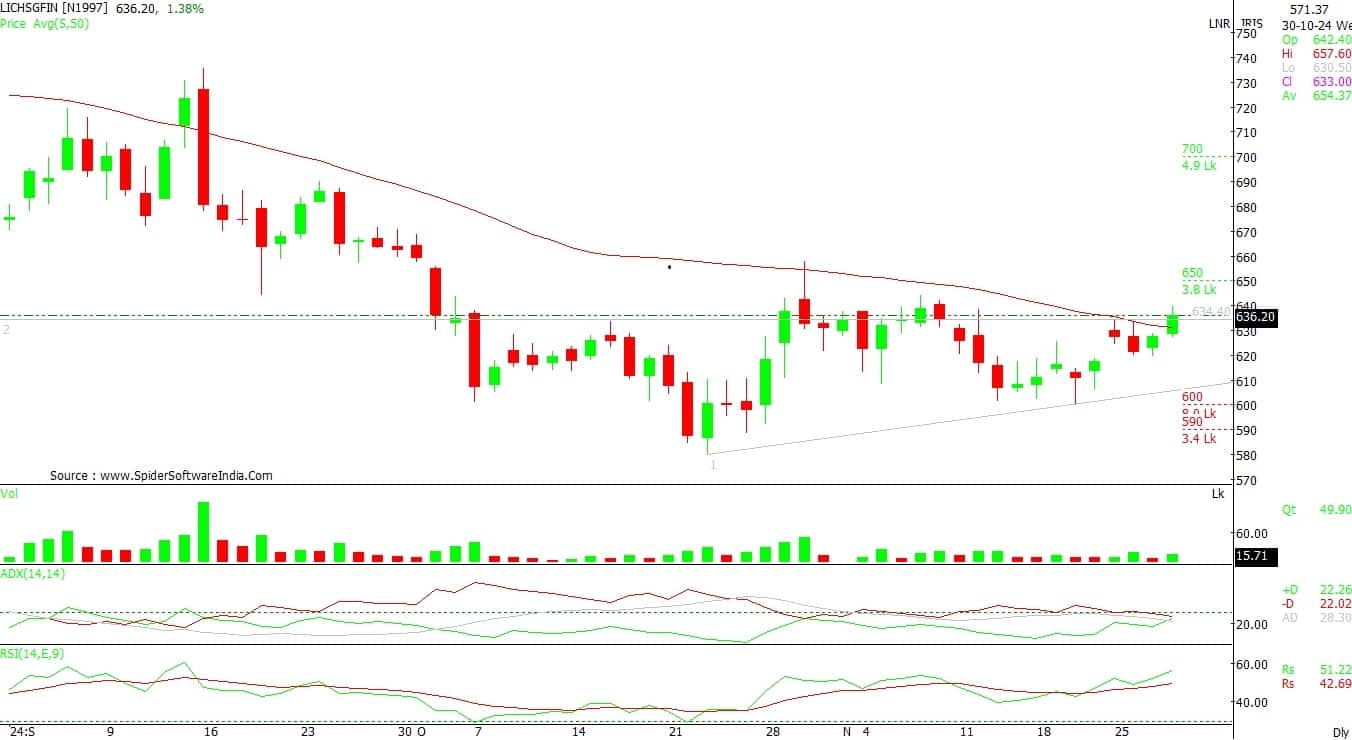
LIC Housing Finance is in the accumulation zone, trading in a rangebound mode for several sessions. The chart formation and technical indicator RSI (Relative Strength Index) suggest that the stock is likely to break out from the rectangle formation, initiating a new leg of the upward move in the near term.
Strategy: Buy
Target: Rs 680
Stop-Loss: Rs 610
Tata Motors | CMP: Rs 779.5
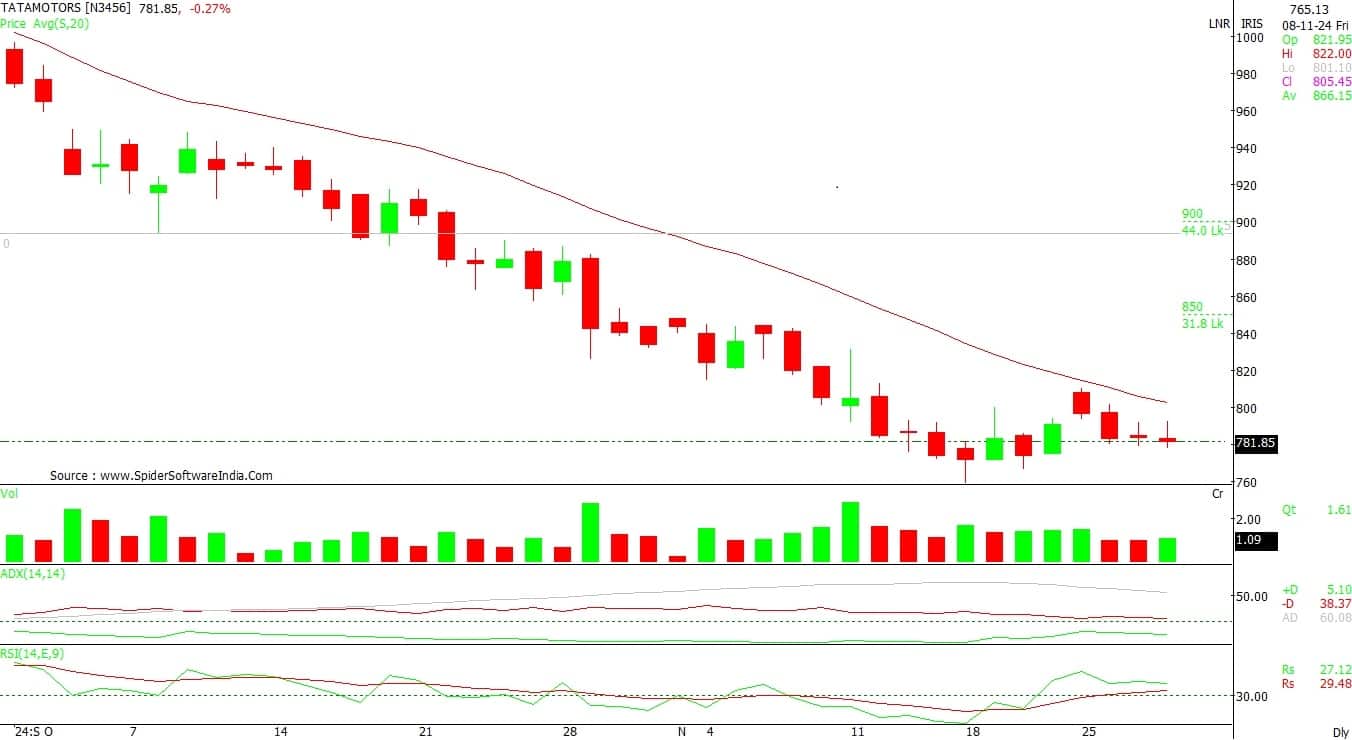
On a daily time frame, Tata Motors has been in a downtrend. However, it is currently in an oversold territory and is near its demand area. The chart formation and the RSI indicate that the stock is likely to rebound for a new leg of the upward move from its demand zone.
Strategy: Buy
Target: Rs 840
Stop-Loss: Rs 750
Ameya Ranadive, CMT CFTe, Senior Technical Analyst at StoxBox
TARC | CMP: Rs 220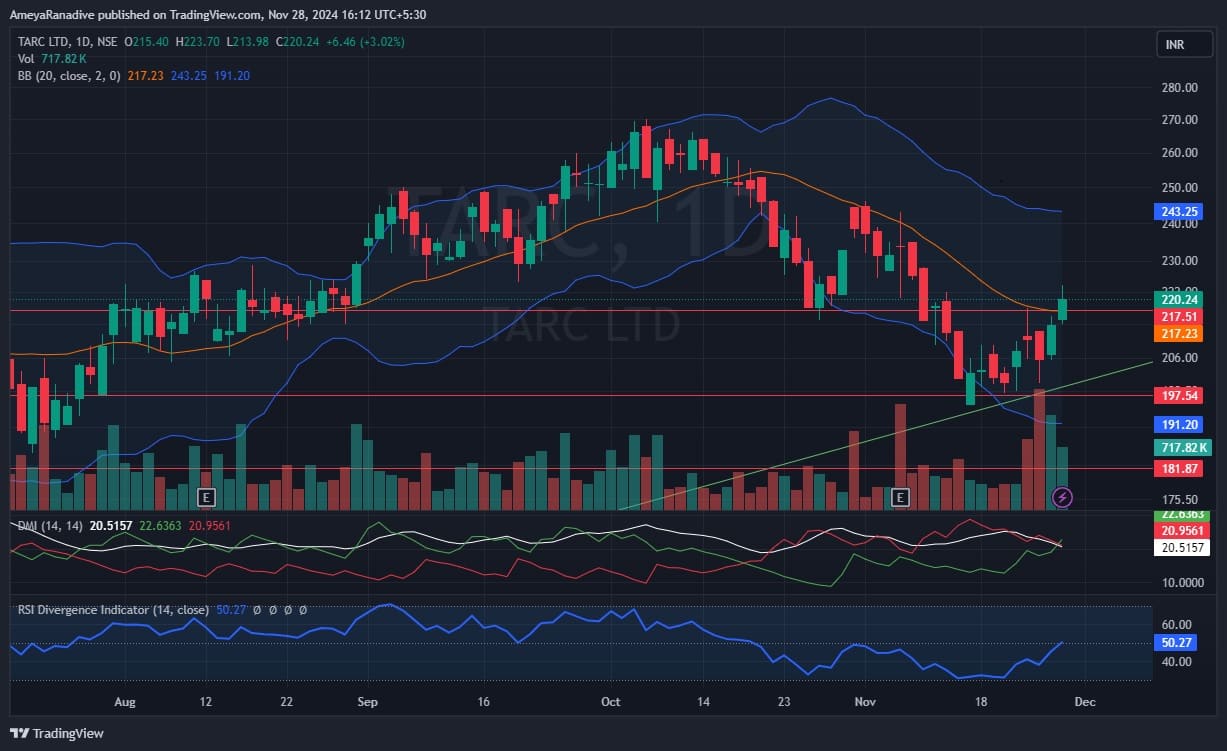
TARC has shown strong upward momentum over the past week, rebounding sharply from the Rs 195–Rs 200 zone. It recently broke through a critical resistance level of Rs 215, which had acted as a cap for a prolonged period. This breakout was accompanied by strong volumes, further validating the move. The Bollinger Bands have expanded, signaling heightened volatility and potential continuation of the uptrend. The stock is trading above its 20-day, 100-day, and 200-day EMAs, with a minor resistance at the 50-day EMA around Rs 225. A decisive break above Rs 225 could pave the way for a significant upside. The ADX at 21 shows strengthening trend momentum, supported by a positive crossover. Considering these factors, TARC is a good buy.
Strategy: Buy
Target: Rs 244, Rs 262
Stop-Loss: Rs 195
Solar Industries India | CMP: Rs 10,893.4

Solar Industries has broken out of a critical resistance zone at Rs 10,250, supported by robust volumes. The stock has also seen a Bollinger Bands expansion, indicating a strong trend and increased buying interest. It is trading well above its key moving averages (20-day, 50-day, 100-day, and 200-day EMAs), highlighting a solid uptrend. The ADX at 24 confirms the strength of the trend, while the RSI at 57 indicates improving momentum. Additionally, the broader sector in which Solar Industries operates is gaining traction, further boosting its prospects. Based on these technical factors, Solar Industries is a good buy at Rs 10,800.
Strategy: Buy
Target: Rs 11,500, Rs 12,250
Stop-Loss: Rs 10,000
Drumil Vithlani, Technical Research Analyst at Bonanza
Aegis Logistics | CMP: Rs 872
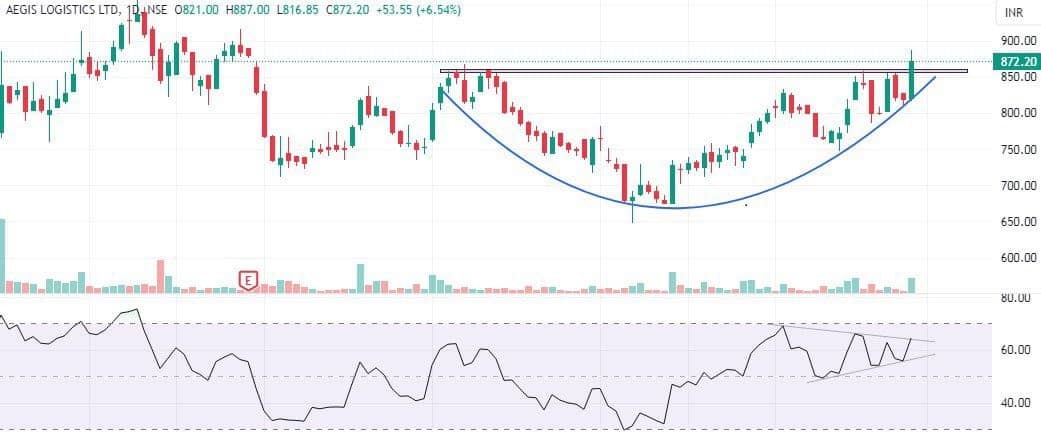
Aegis Logistics has recently experienced a breakout from a rounding pattern on the daily chart, indicating a potential uptrend. This pattern is widely recognized as a bullish signal, suggesting a likely increase in the stock's price. The surge in volume during the last trading session reflects heightened buying interest, reinforcing the stock's positive outlook. Additionally, the momentum indicator RSI is positioned above the key moving average (14-period SMA), supporting the price action.
Strategy: Buy
Target: Rs 925
Stop-Loss: Rs 850
Karur Vysya Bank | CMP: Rs 238.4

On the daily timeframe, Karur Vysya Bank has formed a reversal pattern called the Inverted Head & Shoulders, signaling a potential reversal. The breakout is confirmed above the Rs 232 level, and in the last two trading sessions, the stock has seen above-average volume, indicating rising investor interest and confidence. The closing above all major EMAs is a classic bullish signal, suggesting strengthening upward momentum. The momentum indicator RSI is placed above 60, reflecting strong buying interest, which could drive the stock’s price higher in the near term.
Strategy: Buy
Target: Rs 255
Stop-Loss: Rs 230
Pitti Engineering | CMP: Rs 1,418.90

The weekly chart of Pitti Engineering reveals a Flag and Pole Pattern, confirming a breakout with a gradual increase in volume, signaling buyer dominance. The strong closing near the high reflects positive sentiment and price action. Support from the Fast (21) and Slow (50) EMAs suggests a stable foundation for the upcoming days. Trading above the EMAs indicates a positive trend, supported by the upward trajectory of the Slow EMA. The RSI is gradually moving upwards, supporting the current uptrend.
Strategy: Buy
Target: Rs 1,480
Stop-Loss: Rs 1,379
Chandan Taparia, Head Derivatives & Technicals, Wealth Management at Motilal Oswal Financial Services
Exide Industries | CMP: Rs 457

Exide Industries has bounced back from major support levels, negating its lower lows-lower highs pattern on the daily chart. The momentum indicator RSI has turned upward, which suggests bullish sentiment.
Strategy: Buy
Target: Rs 485
Stop-Loss: Rs 444
Laurus Labs | CMP: Rs 551.7
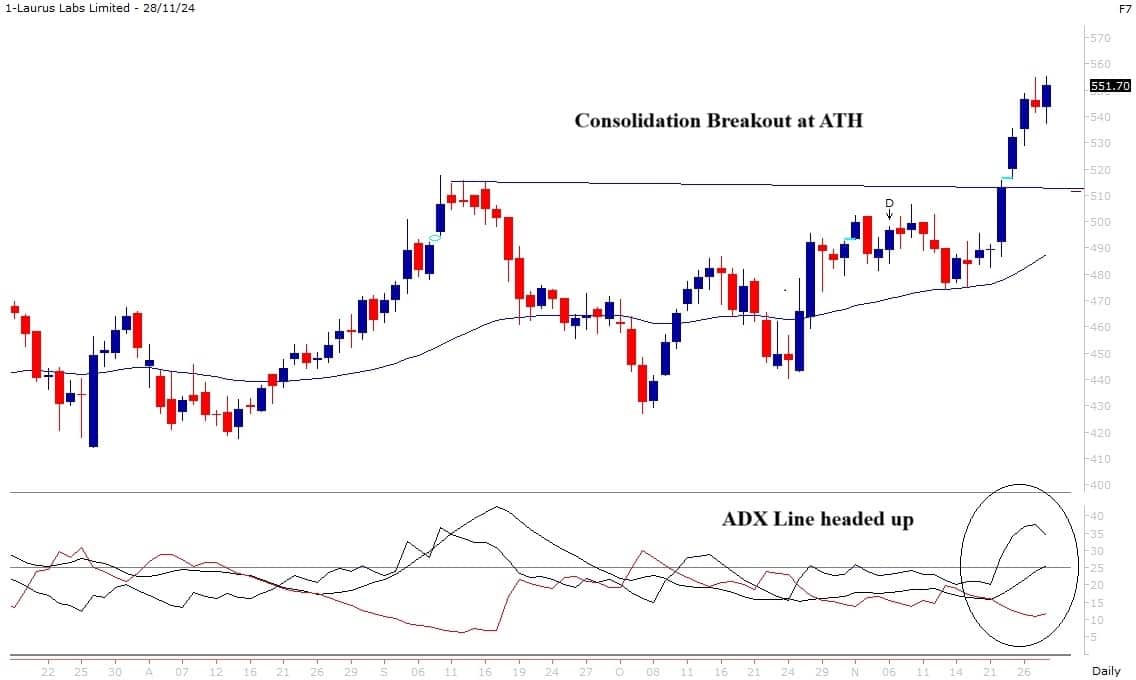
Laurus Labs is moving upward after giving a breakout from a consolidation. It is respecting the 50-week EMA, with slight dips being bought into. The ADX line is heading up, which implies that the uptrend has the strength to support it.
Strategy: Buy
Target: Rs 580
Stop-Loss: Rs 537
Max Financial Services Futures | CMP: Rs 1,145

Max Financial Services has broken down from major support levels, and a bearish engulfing pattern is forming on the monthly chart. The MACD (Moving Average Convergence Divergence) indicator is in a steep downtrend, confirming the selling momentum.
Strategy: Sell
Target: Rs 1,070
Stop-Loss: Rs 1,170
Mandar Bhojane, Equity Research Analyst at Choice Broking
Container Corporation of India | CMP: Rs 821

Container Corporation has recently broken out from a falling trendline on the daily chart. This breakout, coupled with a significant increase in trading volume, indicates robust bullish momentum. Additionally, the RSI shows a bullish divergence, further supporting the positive outlook. A decisive close above Rs 840 could pave the way for short-term targets of Rs 950 and Rs 960. On the downside, immediate support is located at Rs 795, presenting a favourable opportunity for buying on dips.
Strategy: Buy
Target: Rs 950, Rs 960
Stop-Loss: Rs 760
Sundaram Clayton | CMP: Rs 2,363.55
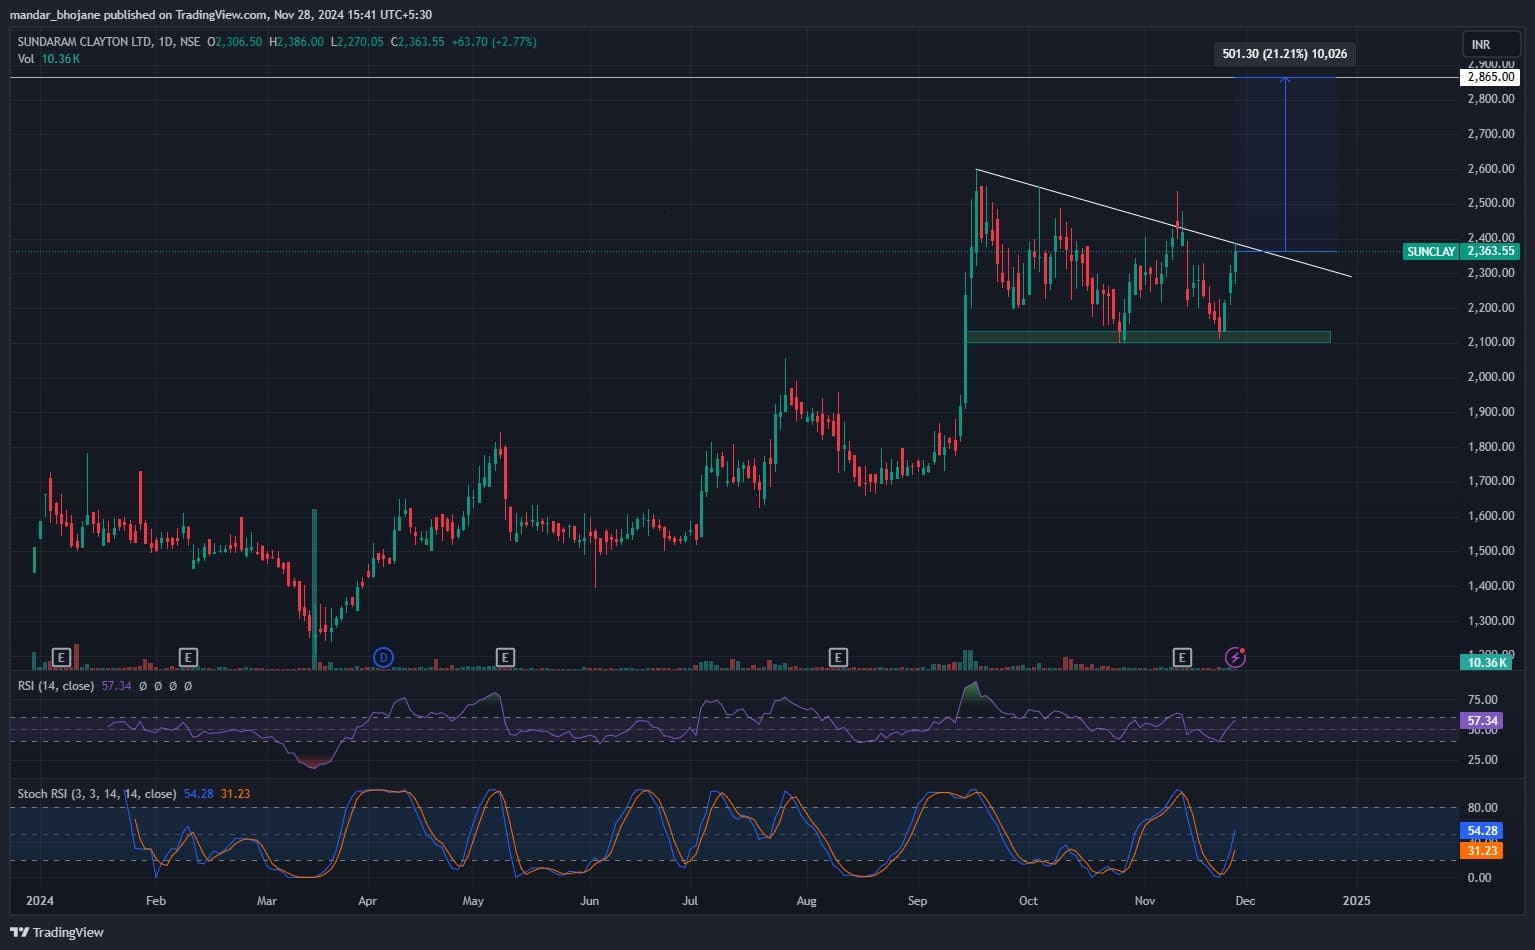
Sundaram Clayton is on the verge of breaking out from an ascending triangle pattern on the daily chart. This pattern is supported by a notable increase in trading volume, reflecting strong buying interest and potential upward momentum. Additionally, the RSI at 57 is trending upward, while the Stochastic RSI shows a positive crossover, further reinforcing the bullish outlook. A decisive close above Rs 2,400 could open the door to short-term targets of Rs 2,800 and Rs 2,900. On the downside, immediate support is placed at Rs 2,300, providing an attractive buying opportunity on dips.
Strategy: Buy
Target: Rs 2,800, Rs 2,900
Stop-Loss: Rs 2,200
Va Tech Wabag | CMP: Rs 1,748.4

Va Tech Wabag is on the verge of a breakout from a Bullish Pennant pattern on the daily chart. The price has been consolidating near its support level, suggesting accumulation by buyers. Moreover, the surge in trading volumes indicates strong buying interest and the potential for continued bullish momentum. The RSI at 57.56 is trending upward, while the Stochastic RSI shows a positive crossover. The price trading above all key EMAs reinforces the bullish sentiment. A sustained close above Rs 1,790 could serve as a trigger for short-term targets of Rs 2,100 and Rs 2,200. On the downside, key support is seen at Rs 1,700, offering an attractive buying opportunity on dips.
Strategy: Buy
Target: Rs 2,100, Rs 2,200
Stop-Loss: Rs 1,655
Disclaimer: The views and investment tips expressed by investment experts on Moneycontrol.com are their own and not those of the website or its management. Moneycontrol.com advises users to check with certified experts before taking any investment decisions.
Discover the latest Business News, Sensex, and Nifty updates. Obtain Personal Finance insights, tax queries, and expert opinions on Moneycontrol or download the Moneycontrol App to stay updated!
Find the best of Al News in one place, specially curated for you every weekend.
Stay on top of the latest tech trends and biggest startup news.


