


The benchmark indices were under severe pressure on April 1, falling 1.5 percent on the Nifty 50, extending losses for the second consecutive session. However, the breadth was in favour of the bulls, with 1,773 shares gaining compared to 845 shares that corrected on the NSE. The market is expected to be range-bound in the upcoming session. Below are some trading ideas for the near term:
Amol Athawale, VP-Technical Research, Kotak Securities
Canara Bank | CMP: Rs 90
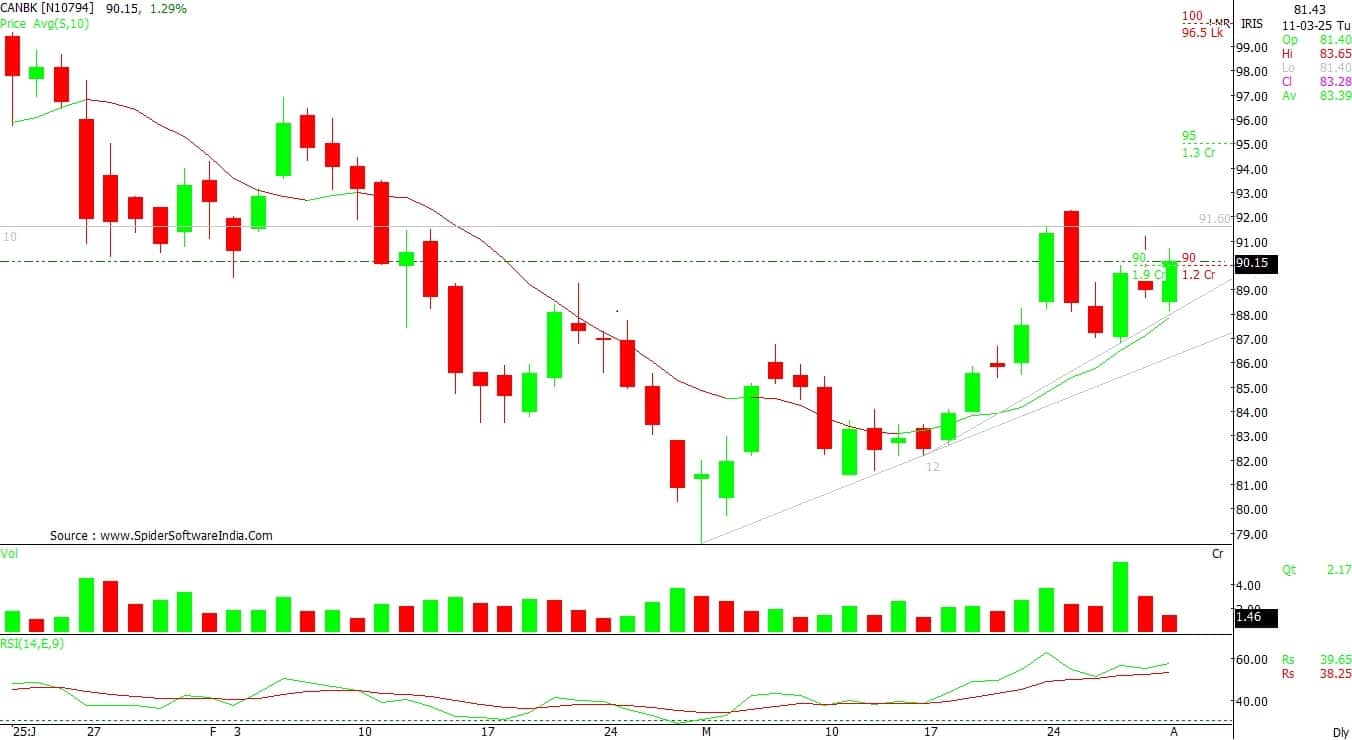
After the remarkable up move, Canara Bank is taking a breather in the last few sessions. The consolidation within a rangebound structure suggests a bullish continuation chart formation. Moreover, the stock comfortably closed above its short-term moving average. Therefore, the stock is likely to resume its uptrend from the current levels.
Strategy: Buy
Target: Rs 97
Stop-Loss: Rs 87
ICICI Prudential Life Insurance | CMP: Rs 569
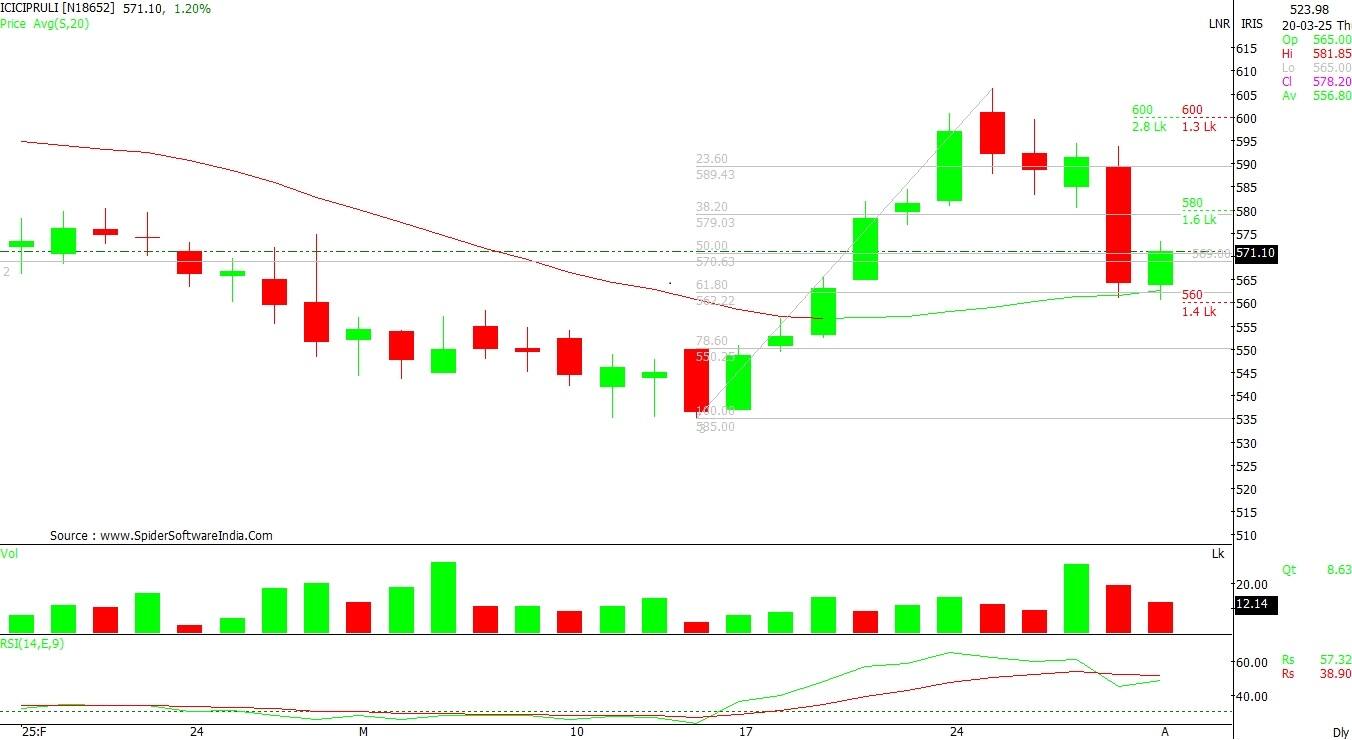
After the recent selloff from the higher levels, the downward momentum has halted. On daily charts, ICICI Prudential Life Insurance has found support and reversed its trend from an important retracement zone, accompanied by decent volume activity. This formation suggests further bullish movement from the current levels in the coming horizon.
Strategy: Buy
Target: Rs 610
Stop-Loss: Rs 550
Bikaji Foods International | CMP: Rs 692
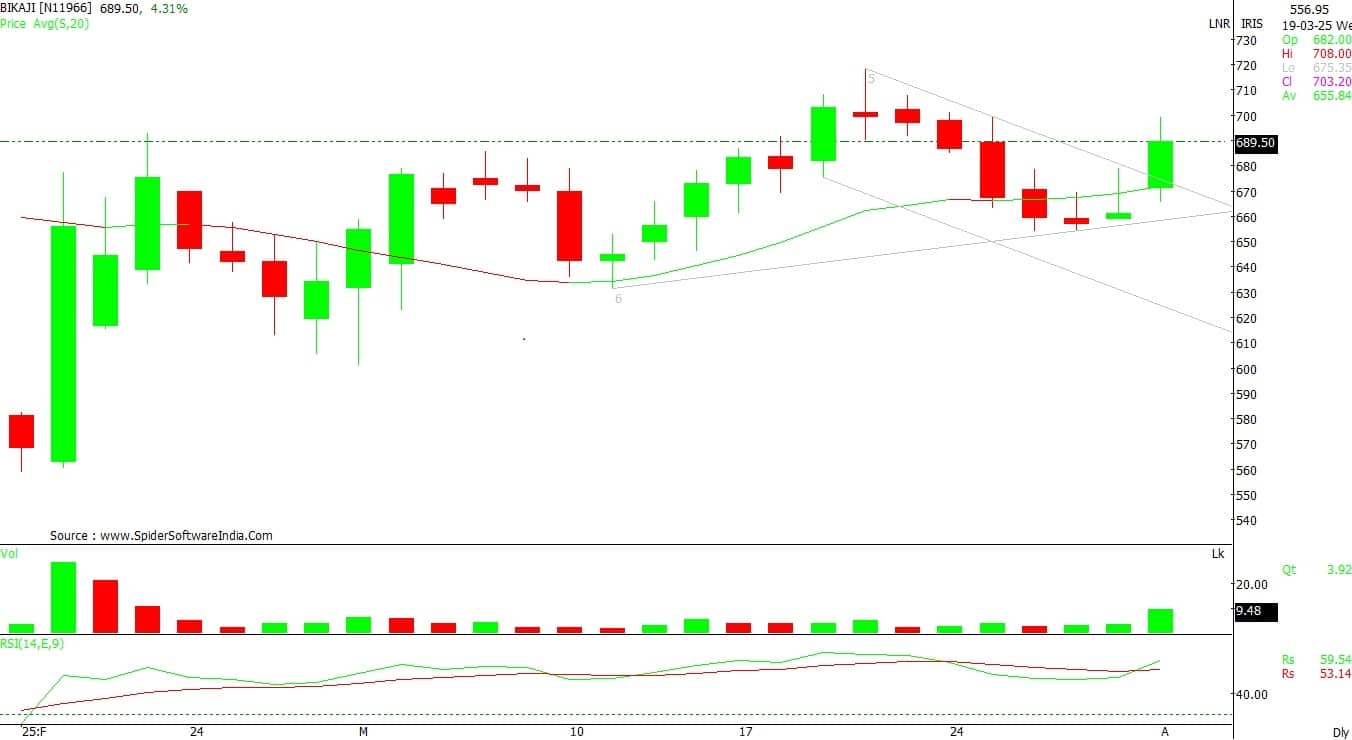
Following a decline from the higher levels, Bikaji Foods International rebounded from its demand zone and witnessed a steady recovery from lower levels. Additionally, on the daily charts, the stock has given a breakout from its sloping channel formation. The gradual upward moves suggest the start of a new bullish trend from the current levels.
Strategy: Buy
Target: Rs 740
Stop-Loss: Rs 665
Vinay Rajani, Senior Technical & Derivative Analyst at HDFC Securities
Karur Vysya Bank | CMP: Rs 214.09

Karur Vysya Bank has reclaimed its level above both the 50-day and 200-day EMAs. During the week ended March 21, 2025, the stock formed a bullish "Engulfing" candlestick pattern on the weekly charts. The stock price has been rising along with healthy volumes.
Strategy: Buy
Target: Rs 249
Stop-Loss: Rs 183
Godawari Power & Ispat | CMP: Rs 189.45

The price of Godawari Power & Ispat has broken out from a bullish Inverted Head and Shoulders pattern on the daily chart. The stock price has been rising with an increase in volumes and is positioned above all important moving averages, indicating a bullish trend across all time frames. RSI (Relative Strength Index) and MACD (Moving Average Convergence Divergence) have turned bullish on the daily charts. The metal sector has regained its bullish momentum, which is likely to continue.
Strategy: Buy
Target: Rs 215
Stop-Loss: Rs 176
Torrent Power | CMP: Rs 1,500.3

Torrent Power has been forming a bullish "Flag" pattern on the daily chart and is on the verge of breaking out from it. The primary trend has been bullish, with higher tops and higher bottoms on the daily chart. The stock has been bullish, being placed above short to medium-term moving averages. The power sector has been in a bullish momentum phase on short to medium-term charts.
Strategy: Buy
Target: Rs 1,650
Stop-Loss: Rs 1,391
Ashish Kyal, CMT, Founder and CEO of Waves Strategy Advisors
JK Cement | CMP: Rs 4,932.4

JK Cement has been trading between its upward sloping trendline for more than two years. Recently, prices found support at this trendline and reversed to the upside. Prices have gained more than 20% since March 17, which indicates strength in the ongoing trend. Additionally, for the past three consecutive trading sessions, prices have managed to protect their prior day’s low, suggesting that bulls are still in control of the trend.
Moreover, prices have closed above its swing high near Rs 5,000, and with follow-up buying, we can expect prices to reach new fresh highs. The ADX (Average Directional Index) reading of 29 suggests positive momentum to continue in the asset. In summary, the current trend for JK Cement is positive. A break above the Rs 5,000 level can lead to a trending move towards Rs 5,180, followed by Rs 5,410. On the downside, Rs 4,830 is the nearest support to watch out for.
Strategy: Buy
Target: Rs 5,180, Rs 5,410
Stop-Loss: Rs 4,830
Trent | CMP: Rs 5,576.75

In the previous session, Trent managed to gain 4.7% despite major indices falling, which is a strong bullish sign. Moreover, the price has completed its journey towards the upper Bollinger Bands after reversing from the lower bands and is now breaking above the upper bands, giving strong positive confirmation that the daily trend is in favour of the bulls.
The RSI at 61 levels gives prices the space to trend further. In summary, the current trend for Trent is bullish. A break above Rs 5,620 can lead to a trading move towards Rs 5,850 or higher. On the downside, Rs 5,400 is the nearest support.
Strategy: Buy
Target: Rs 5,850
Stop-Loss: Rs 5,400
Authum Investment & Infrastucture | CMP: Rs 1,778.5

Over the past three sessions, Authum Investment prices have protected their prior day’s low on a closing basis, which suggests that the daily bias is likely to remain on the side of the bulls. Currently, prices are witnessing a rounding bottom pattern on the daily chart. A break above Rs 1,800 can lead to a trending move towards the neckline at Rs 1,860 and higher. Additionally, the MACD has recently witnessed a bullish crossover and has breached above its zero line, further supporting the bullish stance.
In summary, the current trend for Authum Investment is bullish. A break above Rs 1,800 can lead to a trending move towards Rs 1,860, followed by Rs 1,950. On the downside, Rs 1,740 is the nearest support.
Strategy: Buy
Target: Rs 1,860, Rs 1,950
Stop-Loss: Rs 1,740
Disclaimer: The views and investment tips expressed by investment experts on Moneycontrol.com are their own and not those of the website or its management. Moneycontrol.com advises users to check with certified experts before taking any investment decisions.Discover the latest Business News, Sensex, and Nifty updates. Obtain Personal Finance insights, tax queries, and expert opinions on Moneycontrol or download the Moneycontrol App to stay updated!
Find the best of Al News in one place, specially curated for you every weekend.
Stay on top of the latest tech trends and biggest startup news.


