


The benchmark indices started the week on a strong note, closing 0.8 percent higher on August 26, with 1,244 shares advancing and 1,167 shares declining on the NSE. The market is likely to consolidate, but the overall trend remains in favour of the bulls. Here are some trading ideas for the near term:
Jay Thakkar, Vice President & Head of Derivatives and Quant Research at ICICI Securities
Hindustan Unilever | CMP: Rs 2,821
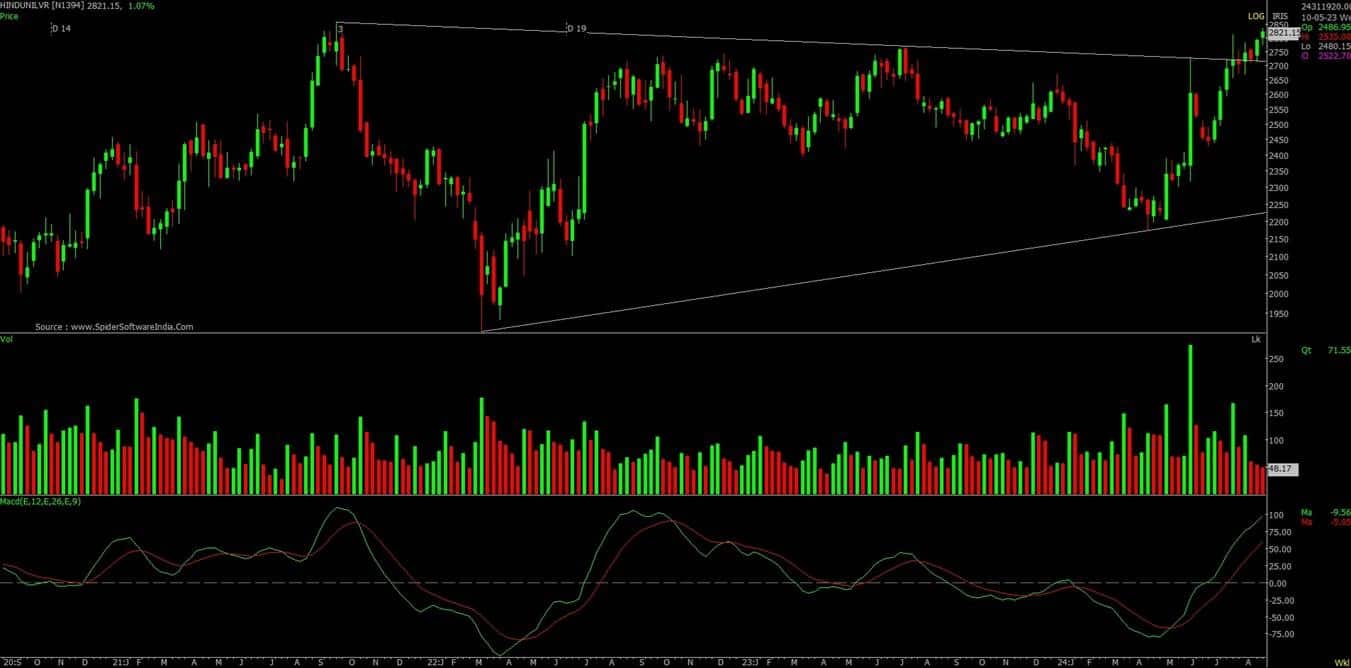
HUL has provided a breakout from a significant sideways consolidation, forming a classical symmetrical triangular pattern. The momentum indicator MACD (Moving Average Convergence Divergence) has returned to buy mode on both daily and monthly charts, which is quite positive in the short to medium term. From a derivatives perspective, the stock has seen a good long buildup since the July series. Regarding options data, the stock has surpassed its crucial hurdle of Rs 2,800 and closed above it, where it has the highest open interest on the Call option front. It has also seen significant buildup on the Put side, and the PCR (Put Call Ratio) is still oversold at 0.56, suggesting there could be a sharp upmove from here.


Strategy: Buy
Target: Rs 2,920, Rs 2,960
Stop-Loss: Rs 2,759
Alkem Laboratories September Futures | CMP: Rs 5,829
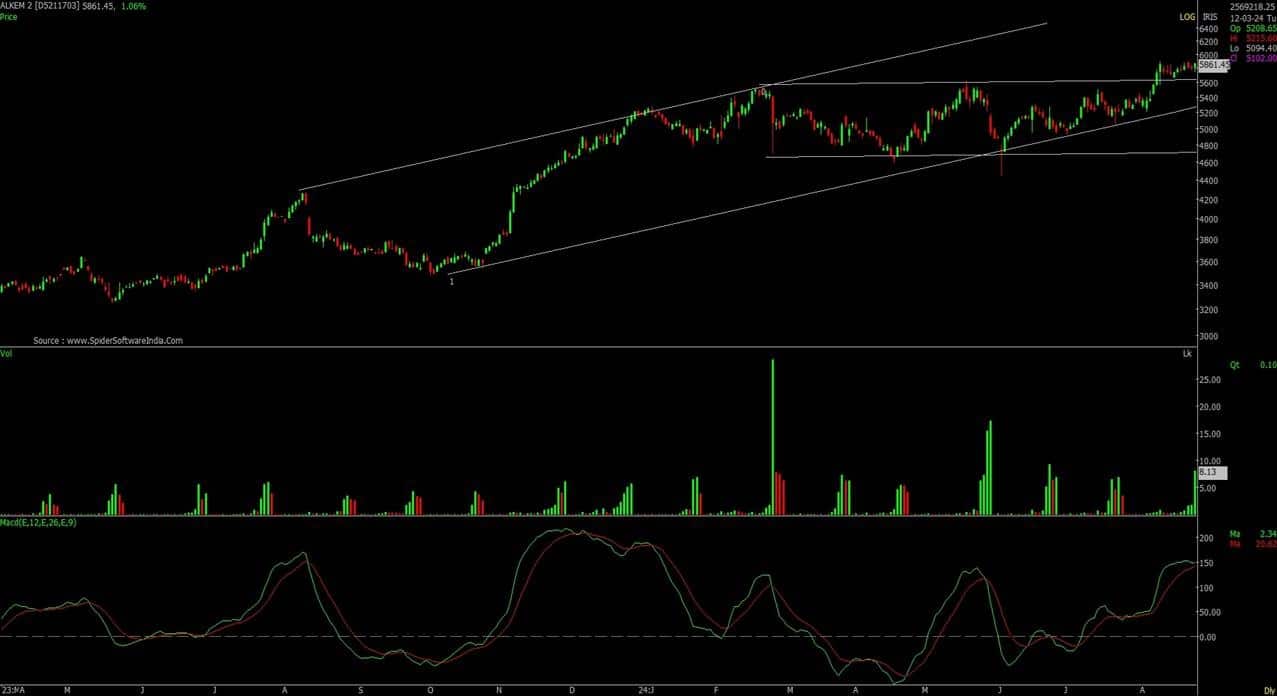
Alkem has provided a breakout from sideways consolidation with a bullish crossover in its MACD on daily, weekly, and monthly charts. The breakout has occurred, and the retest seems to be complete. The breakout was accompanied by an increase in volumes, indicating a price-volume breakout. Since the July series, the stock has seen a good long buildup, which is positive. Although there were shorts seen last week, the increase in volumes during the last trading session increases the probability of an upside.
Strategy: Buy
Target: Rs 6,000, Rs 6,100
Stop-Loss: Rs 5,739
Tata Steel September Futures | CMP: Rs 156.2
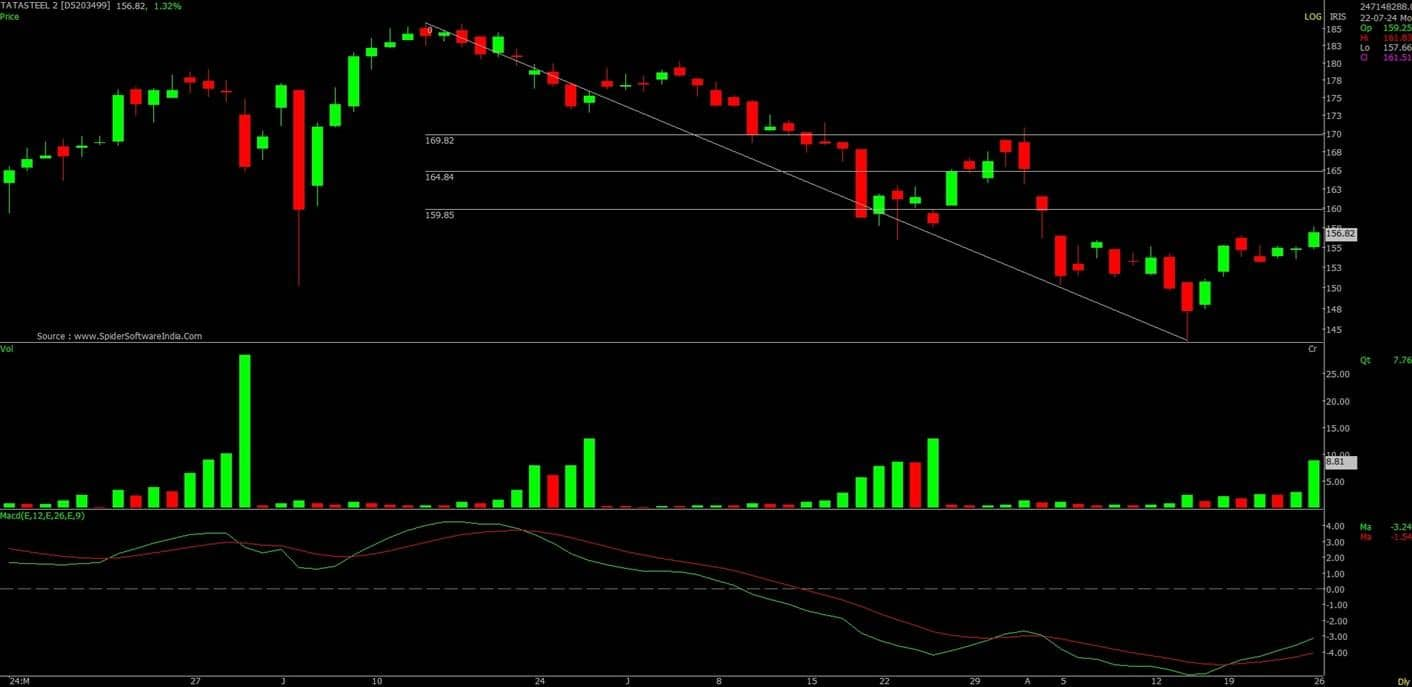
Tata Steel is expected to retrace its overall 3-wave corrective zigzag pattern formed on the daily charts. The momentum indicator MACD has entered buy mode on the daily charts, which is quite positive in the short term. A minimum of 38.2 percent Fibonacci retracement is expected, which comes to Rs 161.51, and above that, the 50 percent retracement level comes to Rs 165. The stock has witnessed short buildup since almost the June series and now appears oversold, hence a bounce back in terms of short covering is expected.
Strategy: Buy
Target: Rs 161.51, Rs 165
Stop-Loss: Rs 153.21
Pravesh Gour, Senior Technical Analyst at Swastika Investmart
Titan Company | CMP: Rs 3,630
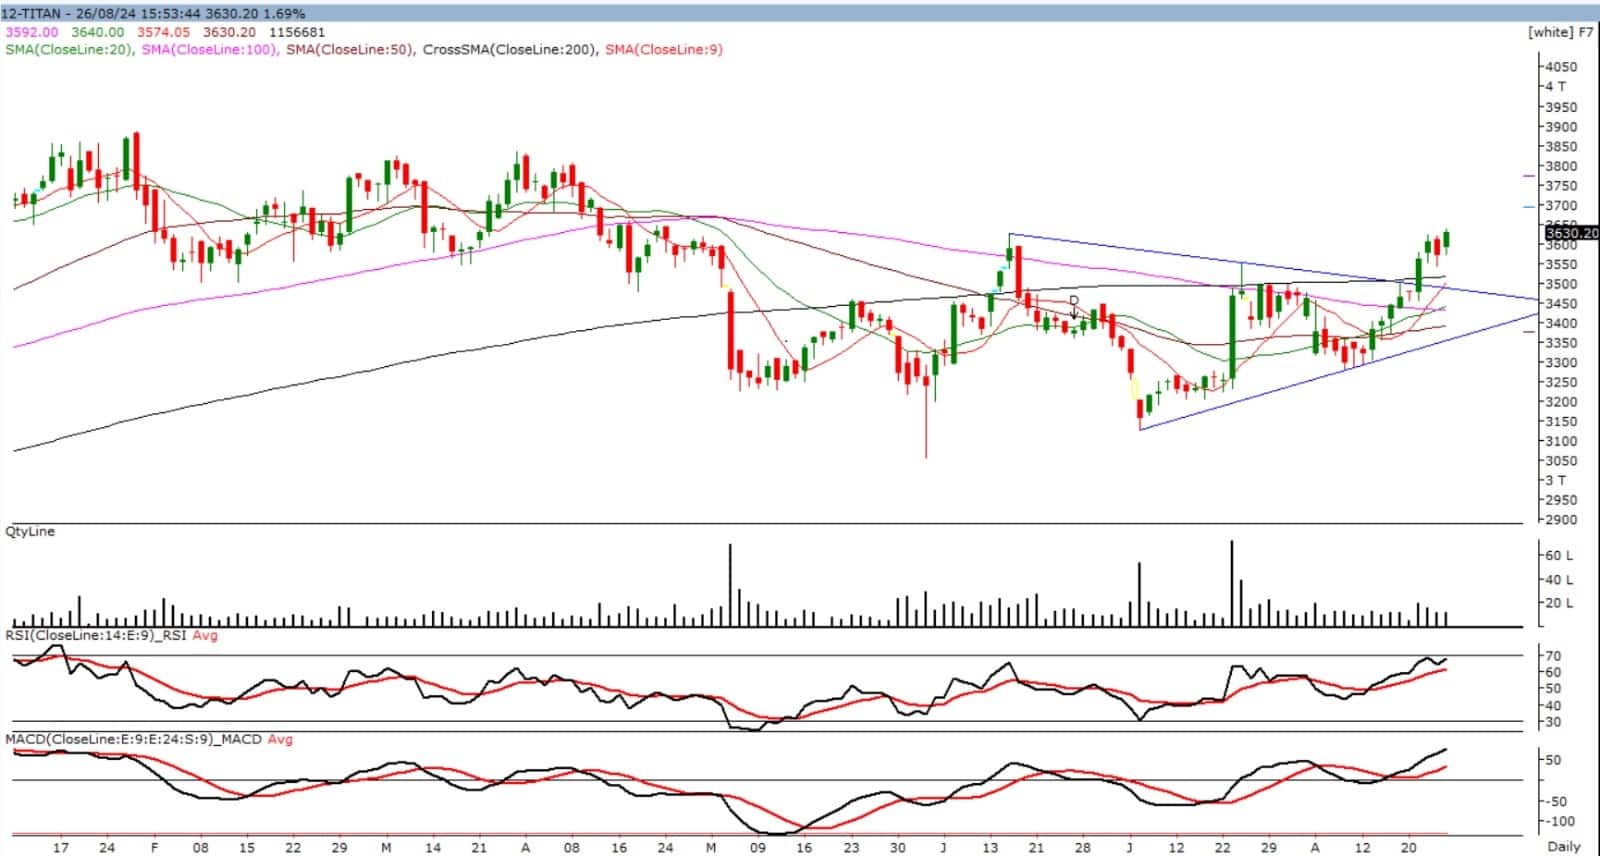
Titan Company is witnessing multiple bullish setups, including a breakout of a symmetrical triangle formation. It is also forming higher highs and higher lows, making it attractive for long-term investors as it has closed above the 200-DMA (Days Moving Average) on the longer timeframe. It is building a strong base in a cluster of 20, 50, and 100-DMA at around Rs 3,400. On an immediate basis, Rs 3,800 is the horizontal resistance line; above this, we can expect a rally towards the Rs 4,000 level. On the downside, Rs 3,400 is immediate and strong support. Momentum indicators are positively poised to support the current trend strength.
Strategy: Buy
Target: Rs 3,800, Rs 4,000
Stop-Loss: Rs 3,400
Prakash Industries | CMP: Rs 230.88
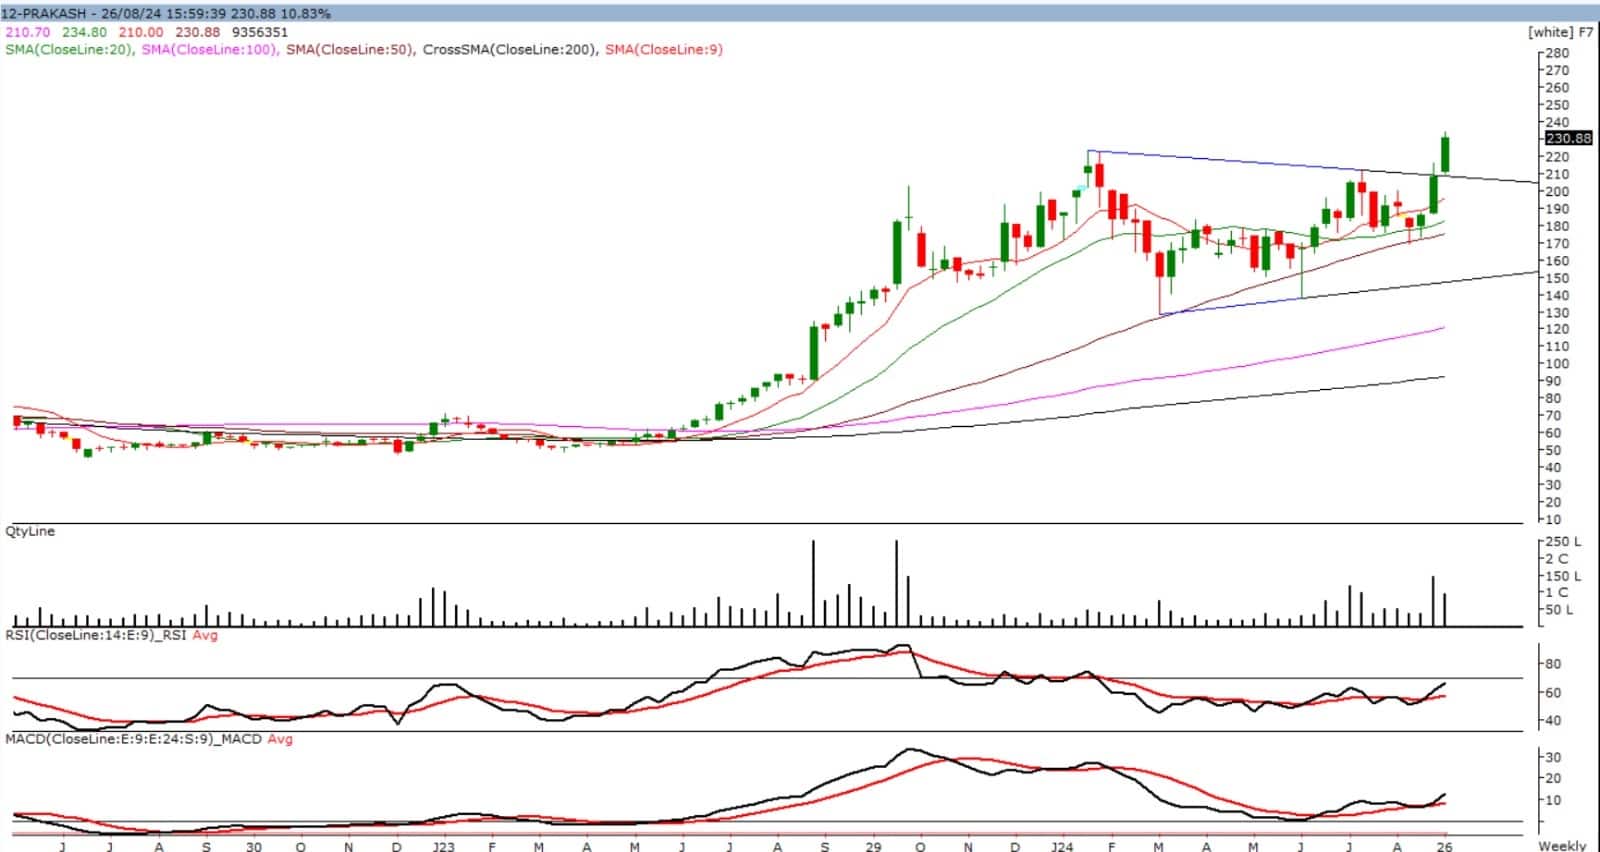
Prakash Industries is in a classical uptrend and is now breaking out of a triangle formation to resume its uptrend. The breakout coincides with rising volume, and it has managed to sustain above the breakout level. The structure of the counter is very attractive, as it is trading above all of its moving averages. MACD supports the current strength, while the momentum indicator RSI (Relative Strength Index) is also positively poised. On the higher side, Rs 250 acts as a crucial level, and above this, we can expect a long move towards Rs 280+ in the shorter to longer timeframe, while on the lower side, Rs 200 serves as important support during any correction.
Strategy: Buy
Target: Rs 250, Rs 280
Stop-Loss: Rs 200
ITC | CMP: Rs 505.70
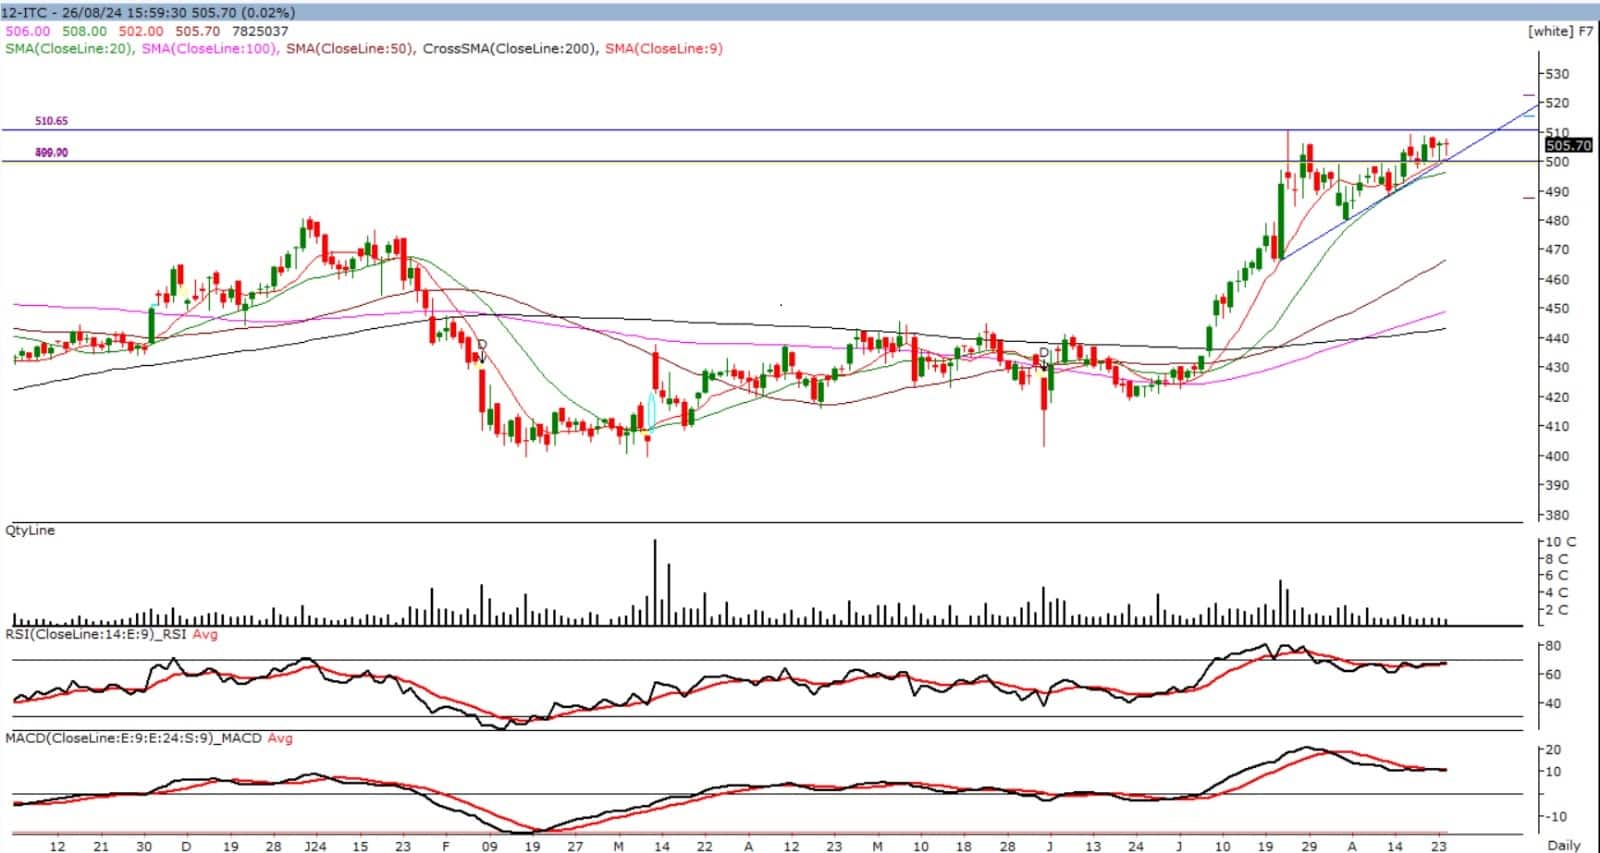
ITC has experienced a breakout from a multi-year resistance on the longer timeframe and has closed above the Rs 500 level. It is currently forming an ascending triangle pattern on the daily chart, suggesting potential continued upward momentum. The immediate resistance is at the previous swing high around Rs 510, and a break above this level could lead to a near-term target of Rs 540. On the downside, the immediate support is at the recent breakout level of Rs 500, with a strong demand zone around Rs 490. Momentum indicators are showing positive signals, indicating that the current trend's strength is likely to continue.
Strategy: Buy
Target: Rs 540
Stop-Loss: Rs 500
Mehul Kothari, DVP – Technical Research at Anand Rathi
Shriram Pistons & Rings | CMP: Rs 2,104

Shriram Pistons is trading in a strong uptrend. During Friday’s session, a range breakout above the Rs 2,100 mark was witnessed, followed by a retracement during Monday’s session. The weekly and long-term charts depict a buy-on-dips trend. Thus, traders are advised to buy the stock between Rs 2,100 and Rs 2,000 for a target of Rs 2,300 in the coming weeks.
Strategy: Buy
Target: Rs 2,300
Stop-Loss: Rs 1,900
Kokuyo Camlin | CMP: Rs 199.7

In Monday’s session, a fresh range breakout was witnessed in Kokuyo Camlin above the Rs 195 mark, and it was achieved at an all-time high. The price action was supported by exceptional volumes of over 15 lakh, compared to the usual volume of just 3–4 lakh in the stock. The daily ADX (Average Directional Index) has crossed 25 and is now near 29, indicating more strength. Thus, traders are advised to accumulate the stock in the range of Rs 198–190 for a target of Rs 224.
Strategy: Buy
Target: Rs 224
Stop-Loss: Rs 179
Tatva Chintan Pharma Chem | CMP: Rs 1,000
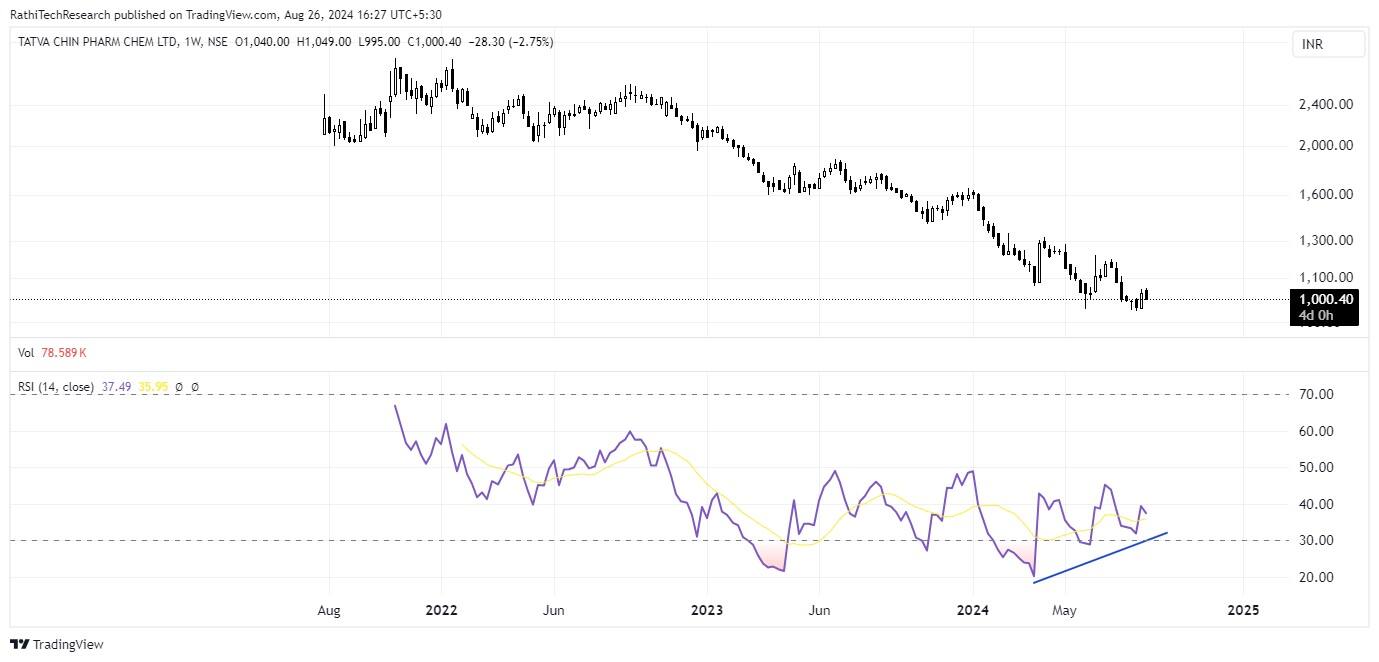
Tatva Chintan Pharma Chem has been in a corrective mode for the past two years, coming down from the peak of Rs 2,600. On the daily scale, after the fall was arrested, a double bottom formation was witnessed. Along with that, there is also a positive divergence on the weekly RSI. Thus, traders are advised to buy the stock above Rs 1,020 for a target of Rs 1,120 in the coming weeks.
Strategy: Buy
Target: Rs 1,120
Stop-Loss: Rs 970
Disclaimer: The views and investment tips expressed by investment experts on Moneycontrol.com are their own and not those of the website or its management. Moneycontrol.com advises users to check with certified experts before taking any investment decisions.
Discover the latest Business News, Sensex, and Nifty updates. Obtain Personal Finance insights, tax queries, and expert opinions on Moneycontrol or download the Moneycontrol App to stay updated!
Find the best of Al News in one place, specially curated for you every weekend.
Stay on top of the latest tech trends and biggest startup news.


