


The market maintained its southward journey for the sixth straight session amid volatility, but there was a strong recovery from the day's low, resulting in a moderately lower close on February 12. The market breadth remains weak, with about 1,613 shares declining against 974 shares advancing on the NSE. The benchmark index is expected to be rangebound, with support at Wednesday's low. Below are some trading ideas for the near term:
Jatin Gedia, Technical Research Analyst at Mirae Asset Sharekhan
Indian Energy Exchange | CMP: Rs 171.81
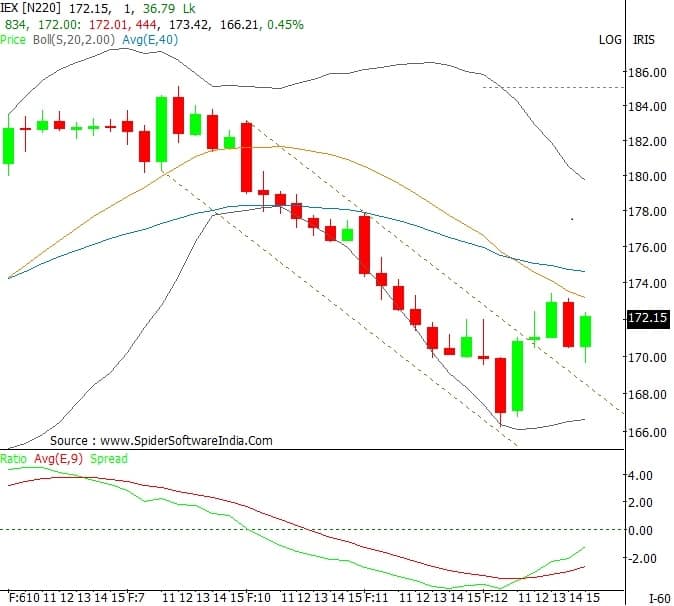
Indian Energy Exchange (IEX) has completed a five-wave decline on the hourly charts and is now poised for a pullback of the fall. It has broken out of a falling channel on the hourly charts, suggesting a trend reversal. The hourly momentum indicator has a positive crossover, which is a buy signal. Thus, both price and momentum indicators are suggesting that the positive price action will continue over the next few trading sessions.
Strategy: Buy
Target: Rs 178, Rs 183
Stop-Loss: Rs 166
SBI Cards and Payment Services | CMP: Rs 816.4
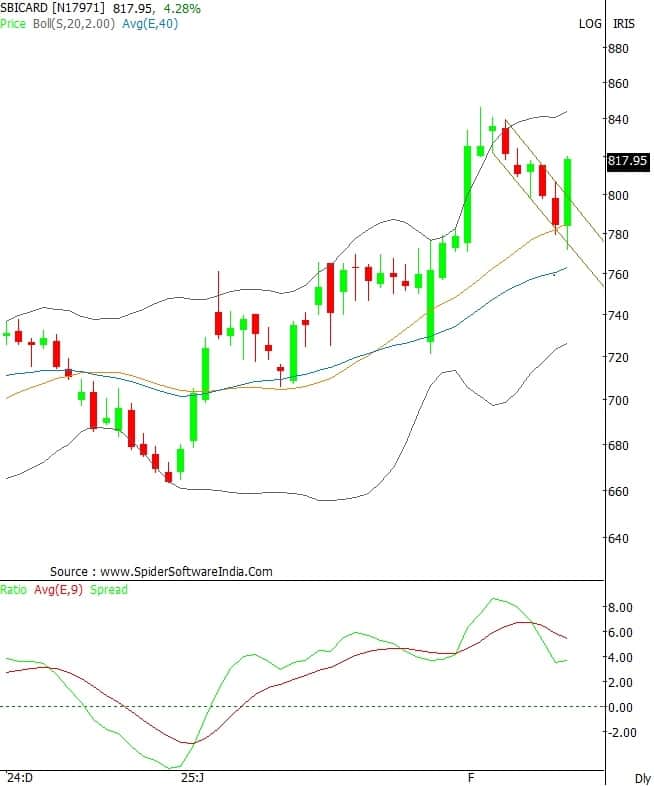
SBI Card has been in a short-term uptrend. It has broken out of a Bullish Flag pattern on the upside. It has taken support at the 20-day moving average (Rs 785) and resumed its upward move. The stock is likely to continue its uptrend towards Rs 865 from a short-term perspective.
Strategy: Buy
Target: Rs 865
Stop-Loss: Rs 790
Vidnyan S Sawant, the Head of Research at GEPL Capital
Godfrey Phillips India | CMP: Rs 5463
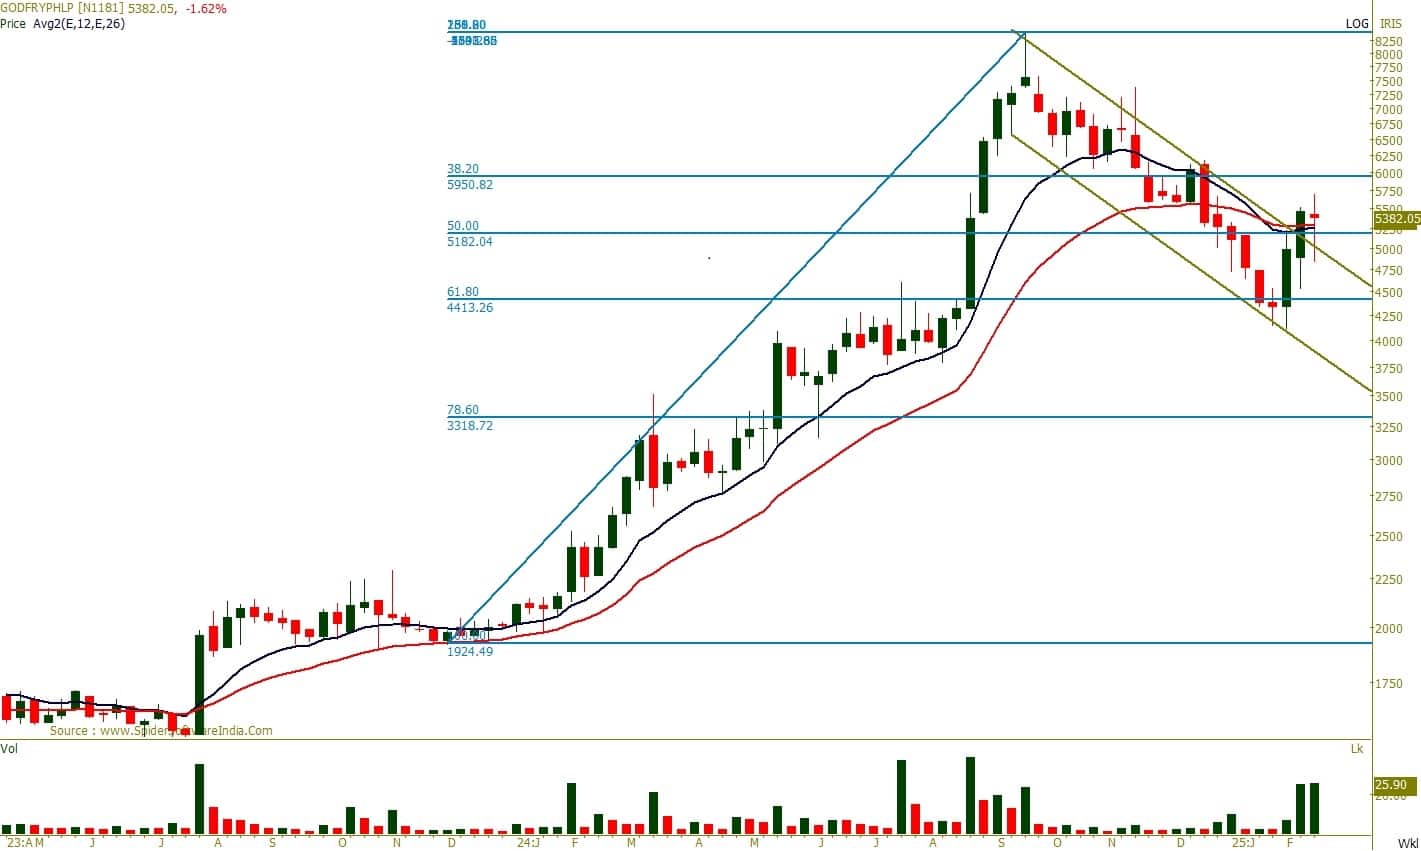
Godfrey Phillips maintains a strong bullish trend on the higher timeframes, forming higher tops and higher bottoms while consistently respecting the 12-month EMA (Exponential Moving Average). On the weekly scale, the stock has rebounded from the 61.80% Fibonacci retracement level of the prior uptrend from Rs 1,916 to Rs 8,480. On the daily timeframe, it has successfully retested the breakout level of a falling channel, reinforcing bullish price action. The alignment across multiple timeframes suggests a high probability of the stock resuming its upward trajectory.
Strategy: Buy
Target: Rs 6,297
Stop-Loss: Rs 5,000
Blue Star | CMP: Rs 1,995
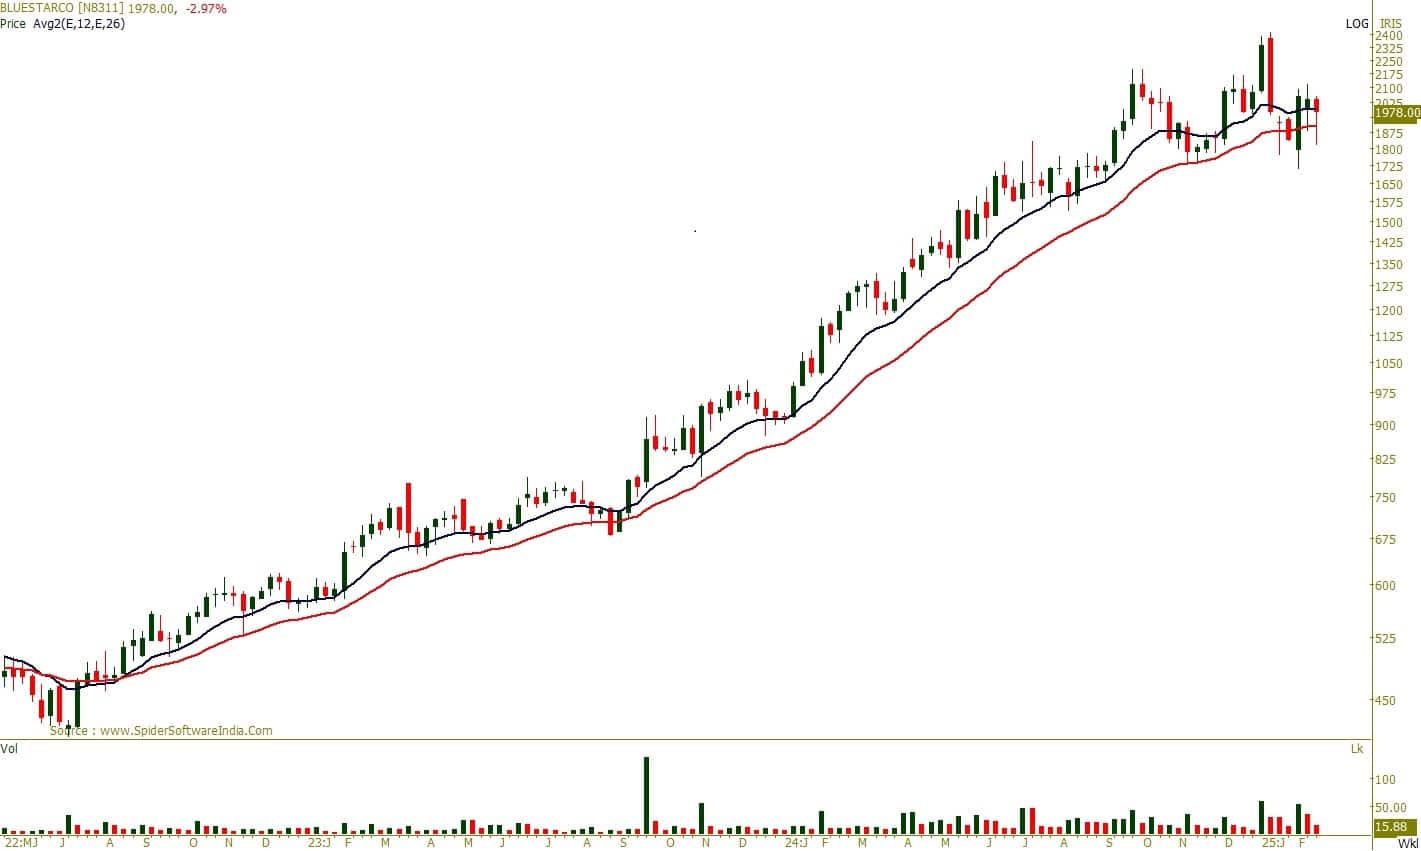
Blue Star remains in a strong uptrend, with dips finding buying interest near key moving averages. On the monthly scale, the stock has been rangebound, indicating high relative strength compared to the broader market. The weekly chart highlights a rebound from the 12-week and 26-week EMAs, forming a double-bottom pattern, reinforcing bullish momentum.
Strategy: Buy
Target: Rs 2,235
Stop-Loss: Rs 1,839
HDFC Life Insurance Company | CMP: Rs 629.15
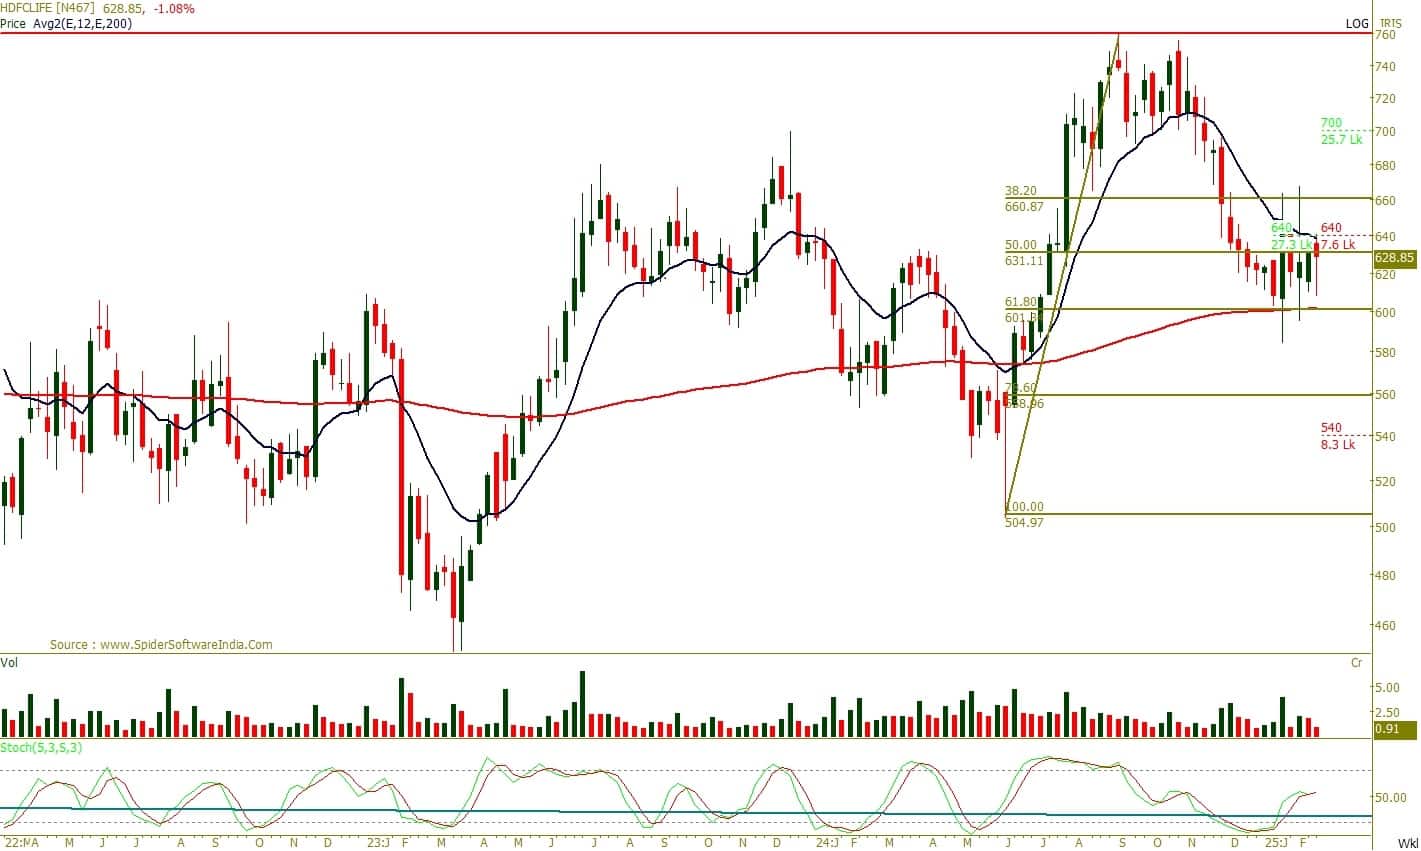
HDFC Life Insurance has been forming higher bottoms on the weekly scale since March 2023. In recent weeks, the stock has found support at the 200-week EMA, aligning with the 61.80% Fibonacci retracement level, indicating a pause in the downward phase. A breakout above Rs 650 would confirm a positive structure. Additionally, the stochastic indicator’s %K sustaining above 50 suggests improving bullish momentum.
Strategy: Buy
Target: Rs 697
Stop-Loss: Rs 584
Sudeep Shah, the Deputy Vice President and Head of Technical and Derivative Research at SBI Securities
Bharti Airtel | CMP: Rs 1,711.55
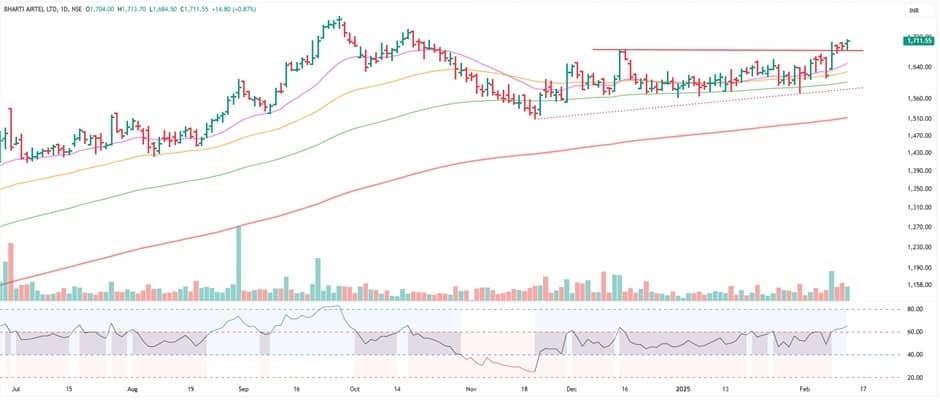
Bharti Airtel has been strongly outperforming the frontline indices. The ratio chart of the stock compared to the Nifty index is at a 161-month high. The Mansfield Relative Strength indicator has been above the zero line for the last 277 trading sessions, reinforcing the stock’s consistent strength. Currently, the stock is trading just a stone’s throw away from its all-time high. All the moving averages and momentum-based indicators are suggesting strong bullish momentum in the stock. Hence, we recommend accumulating the stock in the zone of Rs 1,715-1,705, with a stop-loss of Rs 1,650. On the upside, it is likely to test the level of Rs 1,830 in the short term.
Strategy: Buy
Target: Rs 1,830
Stop-Loss: Rs 1,650
Cholamandalam Investment & Finance Company | CMP: Rs 1,351.85
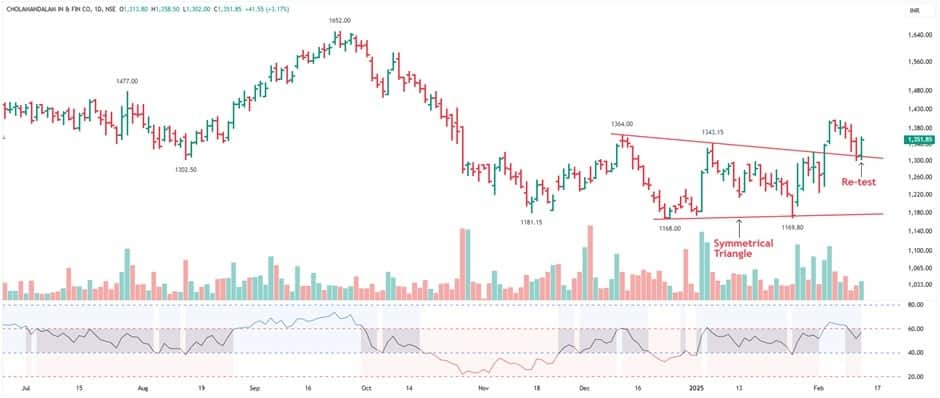
Cholamandalam Investment & Finance Company has recently given a symmetrical triangle pattern breakout on a daily scale. It marked the high of Rs 1,401.45, and thereafter, it witnessed a throwback. Most notably, during the period of throwback, the volume activity was mostly below average. During this period, the stock retested the breakout level and witnessed a smart rebound, accompanied by relatively higher volume. Currently, the stock is trading above its short and long-term moving averages, which is a bullish sign. Hence, we recommend accumulating the stock in the zone of Rs 1,355-1,345, with a stop-loss of Rs 1,290. On the upside, it is likely to test the level of Rs 1,450 in the short term.
Strategy: Buy
Target: Rs 1,450
Stop-Loss: Rs 1,290
DLF | CMP: Rs 680
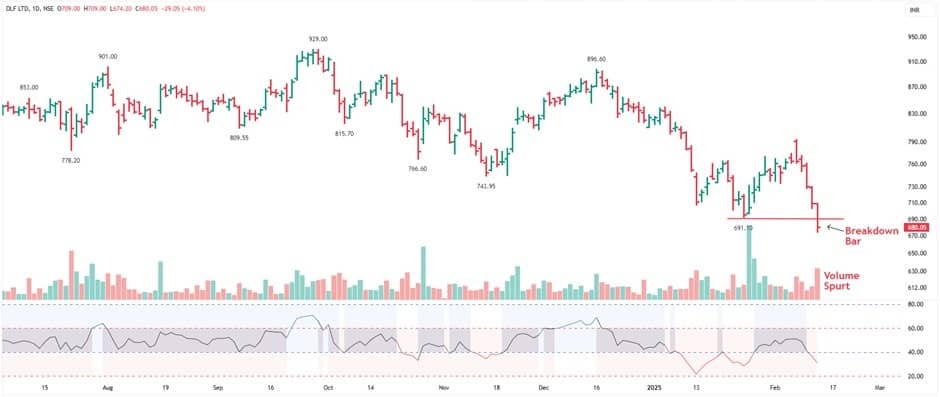
The Nifty Realty index has been strongly underperforming the frontline indices in recent trading sessions. On Wednesday, it gave a horizontal trendline breakdown. The stock of DLF has also given a horizontal trendline breakdown on a daily scale. This breakdown was confirmed by relatively higher volume. In addition, it has formed a sizeable bearish candle on the breakdown day, which adds more bearishness.
Currently, the stock is trading below its short and long-term moving averages. Furthermore, the momentum indicators and oscillators are also suggesting strong bearish momentum in the stock. Hence, we recommend selling the stock in the zone of Rs 678-682, with a stop-loss of Rs 710. On the downside, it is likely to test the level of Rs 620 in the short term.
Strategy: Sell
Target: Rs 620
Stop-Loss: Rs 710
Disclaimer: The views and investment tips expressed by investment experts on Moneycontrol.com are their own and not those of the website or its management. Moneycontrol.com advises users to check with certified experts before taking any investment decisions.Discover the latest Business News, Sensex, and Nifty updates. Obtain Personal Finance insights, tax queries, and expert opinions on Moneycontrol or download the Moneycontrol App to stay updated!
Find the best of Al News in one place, specially curated for you every weekend.
Stay on top of the latest tech trends and biggest startup news.


