


The benchmark indices closed flat with a positive bias after a volatile session on August 14. The market breadth was negative, with about 1,546 shares declining against 804 advancing shares on the NSE. According to experts, the Nifty 50 is likely to march towards the 24,300-24,500 zone if it manages to hold above 24,100 in the coming sessions. However, breaking below 24,100 could drag it down towards the 24,000-23,900 zone. Here are some trading ideas for the near term:
Hardik Matalia, Derivative Analyst at Choice Broking
Bajaj Healthcare | CMP: Rs 418.45

Bajaj Healthcare presents a promising buying opportunity, having experienced a breakout from a consolidation range on the daily chart. The price has been supported by strong trading volumes, indicating strength in the move. If the price holds above Rs 420, it is likely to advance further towards a target of Rs 460. The Relative Strength Index (RSI) is at 66.91 and trending upward, indicating increased buying momentum. Additionally, Bajaj Healthcare has rebounded from key moving averages, including the short-term (20-day) EMA, medium-term (50-day) EMA, and long-term (200-day) EMA levels, signaling a bullish outlook. Based on these technical indicators, a long position in Bajaj Healthcare at Rs 418.45 is recommended.
Strategy: Buy
Target: Rs 460
Stop-Loss: Rs 398
LT Foods | CMP: Rs 313.1
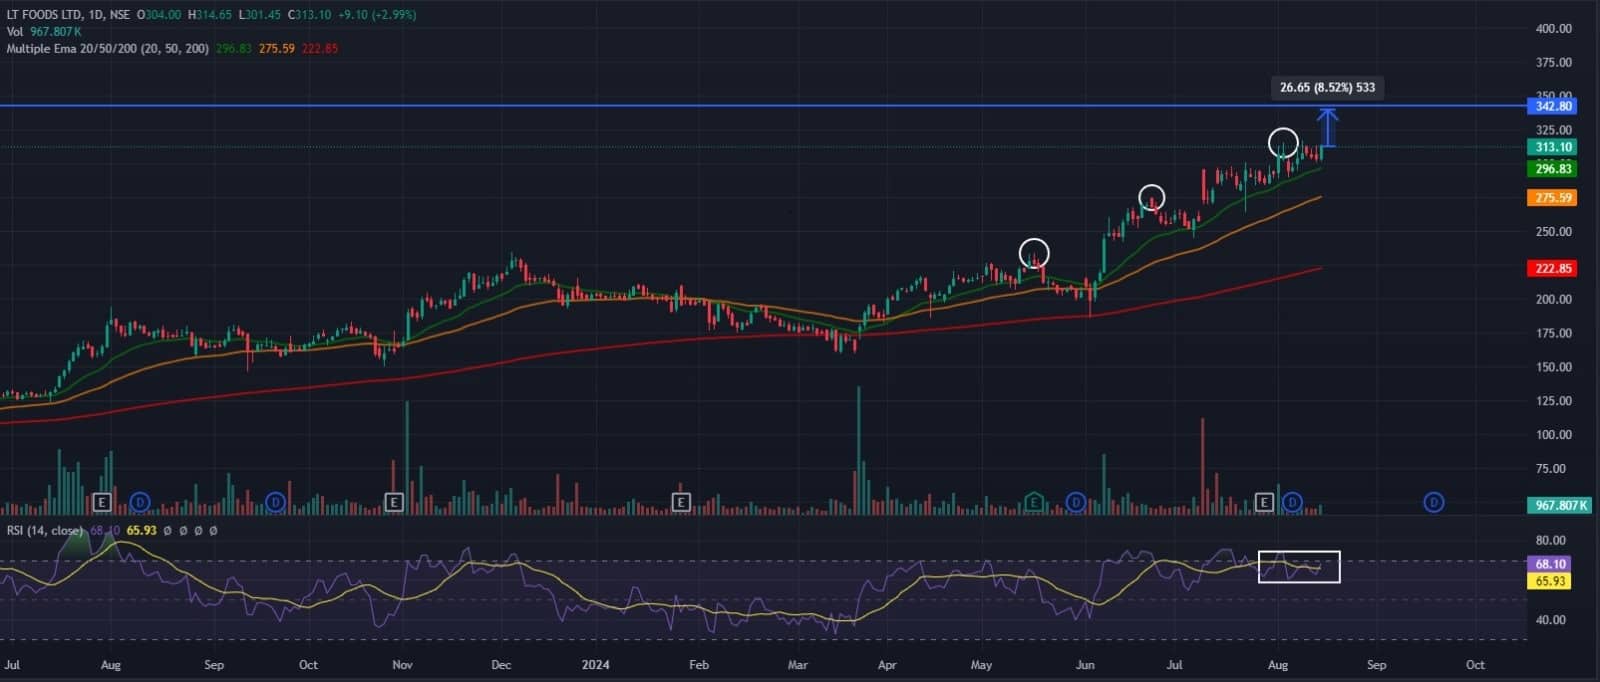
LT Foods is currently trading near its all-time high at Rs 313.1, forming higher highs and higher lows on the daily chart. The stock has created a strong bullish candle supported by high trading volumes, indicating a continuation of the uptrend. LT Foods recently bounced from its support zones, and if it maintains its position above Rs 315, it could move further towards an upside target of Rs 340. The RSI is currently at 68.1, with a positive crossover, indicating increased buying momentum. Moreover, LT Foods is trading above its key moving averages, confirming the strength of the current uptrend. Investors might consider buying on dips, with a stop-loss set at Rs 300 to manage risk. The target price of Rs 340 aligns with resistance levels and offers a favourable risk-reward ratio, making this a promising trading opportunity.
Strategy: Buy
Target: Rs 340
Stop-Loss: Rs 300
Cholamandalam Financial Holdings | CMP: Rs 1,569.5
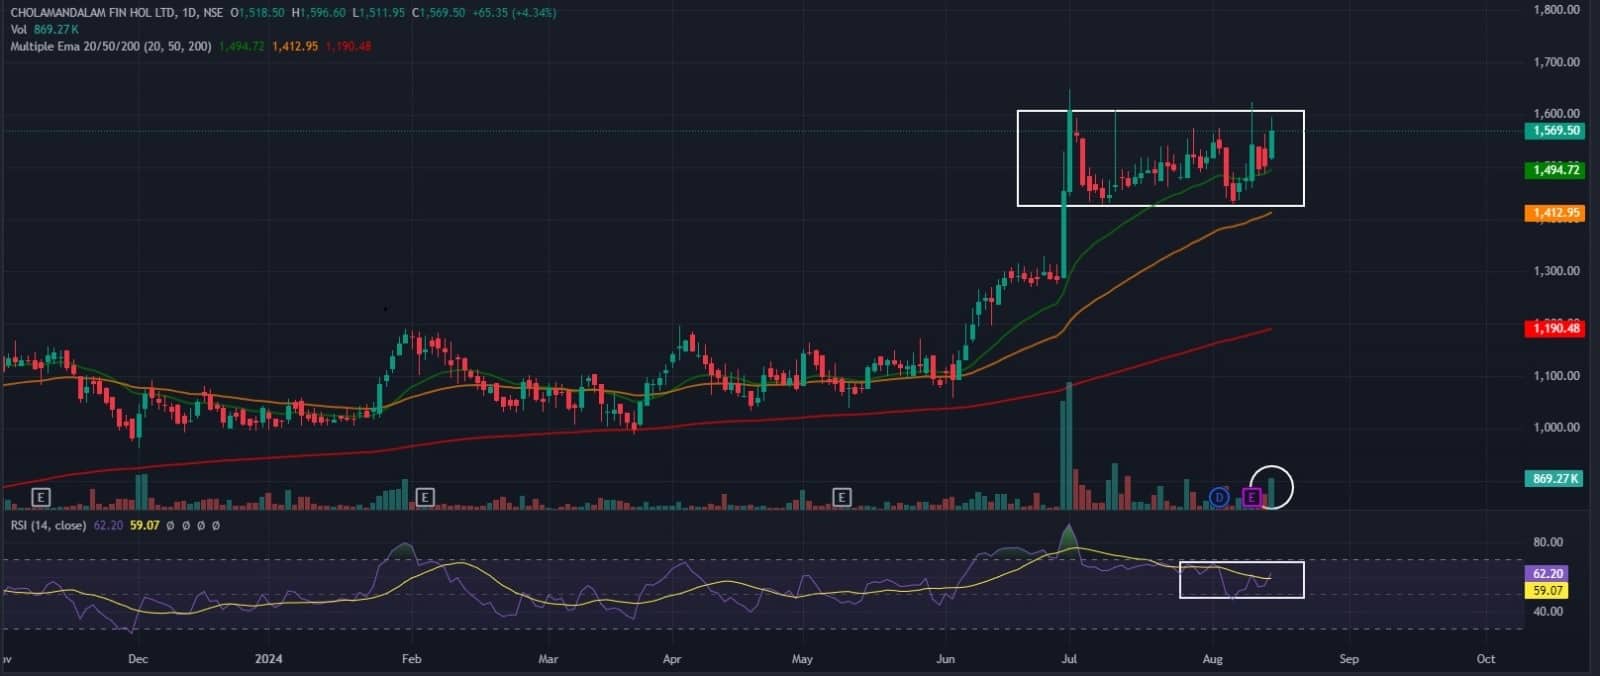
Cholamandalam Financial Holdings is on the verge of breaking out of a consolidation range. This potential breakout is supported by notable trading volumes, indicating strength in the upward move. The stock has formed a strong bullish candle on the daily chart, reinforcing the uptrend. There is potential for further upward movement, with a target of Rs 1,700. On the downside, significant support is observed around the Rs 1,510 level. The RSI is currently at 62.2, with a positive crossover, indicating increased buying momentum. Additionally, Cholamandalam Financial has bounced from its short-term (20-day) EMA levels, signaling strong support at these levels. In summary, based on the technical setup and indicators (RSI and moving averages), buying Cholamandalam Financial at Rs 1,569.5 levels is advisable.
Strategy: Buy
Target: Rs 1,700
Stop-Loss: Rs 1,510
Shitij Gandhi, Senior Technical Research Analyst at SMC Global Securities
AGI Greenpac | CMP: Rs 850.8

In recent times, AGI Greenpac witnessed a smart recovery from Rs 640 levels, surpassing its 200-day EMA with momentum towards Rs 900 within a short span of time. However, due to profit booking, the stock once again saw a pullback towards its 200-day EMA and took support around Rs 750 levels. Currently, it has given a breakout above the Cup & Handle pattern on daily charts. Therefore, one can buy, hold, or accumulate the stock for an expected upside to Rs 1,000-1,020 levels, with a downside support zone of Rs 840-820 levels.
Strategy: Buy
Target: Rs 1,000, Rs 1,020
Stop-Loss: Rs 760
ICICI Securities | CMP: Rs 805.65

ICICI Securities has been consolidating in a broader range of Rs 700-800 for nearly the last four to five months, with prices holding well above its 200-day EMA. This week, a fresh breakout was observed above its key resistance level of Rs 800 after a prolonged consolidation phase. Follow-up buying is expected, as positive divergences on secondary oscillators point towards further upward movement. Therefore, one can buy, hold, or accumulate the stock for an expected upside to Rs 900-905 levels, with a downside support zone of Rs 800-790 levels.
Strategy: Buy
Target: Rs 900, Rs 905
Stop-Loss: Rs 740
Amol Athawale, VP-Technical Research at Kotak Securities
L&T Technology Services | CMP: Rs 4,916.85

Post a short-term correction from higher levels, L&T Technology Services' downward momentum stopped around its support area. On daily charts, the counter has formed a reversal pattern at its important demand zone. The structure suggests a revival of the uptrend from the current levels in the near term.
Strategy: Buy
Target: Rs 5,250
Stop-Loss: Rs 4,740
Sun Pharmaceutical Industries | CMP: Rs 1,741.65
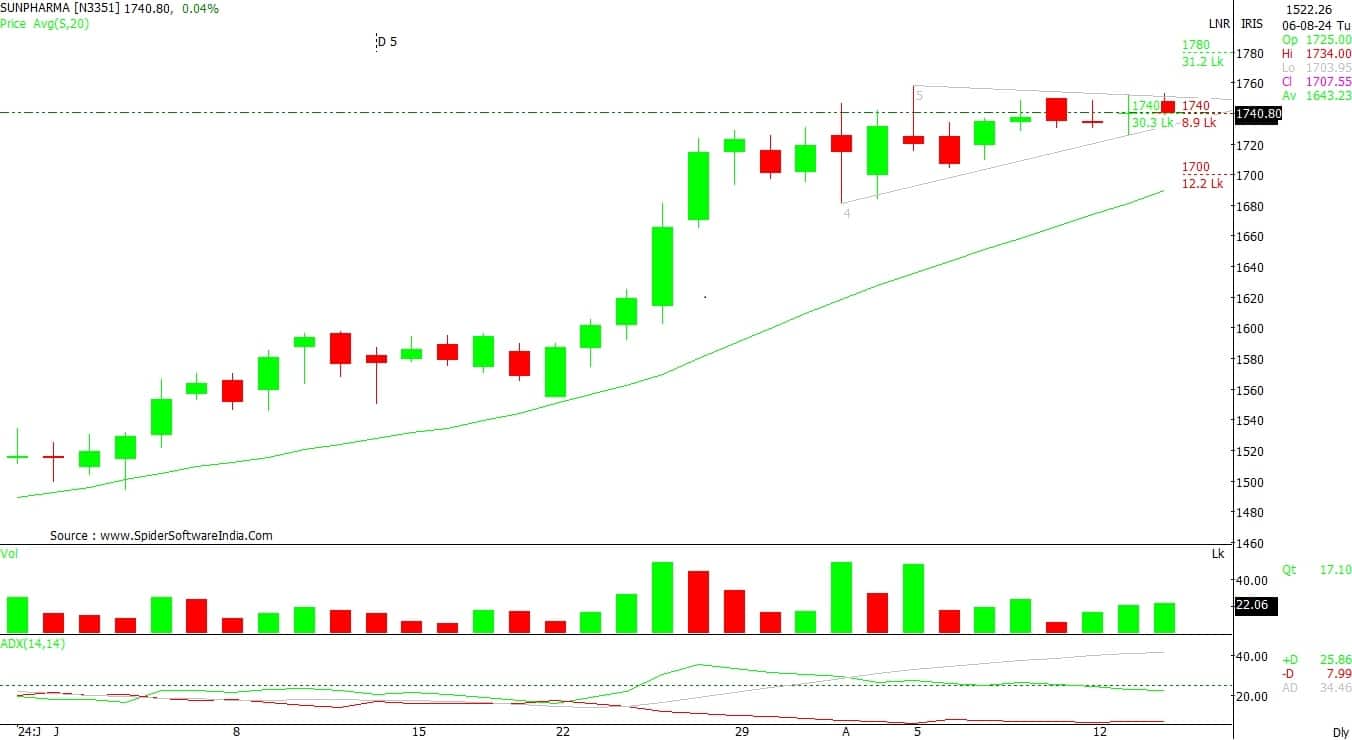
After a remarkable up move, Sun Pharmaceutical Industries has been consolidating for the last few sessions. The range-bound structure suggests a bullish continuation chart formation. Moreover, the stock comfortably closed above its short-term moving average, indicating that the uptrend is likely to resume in the near horizon.
Strategy: Buy
Target: Rs 1,860
Stop-Loss: Rs 1,680
Jindal Steel & Power | CMP: Rs 929.75

After hitting highs of around Rs 1,090, the counter plunged due to supply pressure. However, Jindal Steel & Power has found support near its demand area. Additionally, the formation of a Bullish Engulfing candlestick pattern with rising volume suggests a strong reversal in the counter from the current levels.
Strategy: Buy
Target: Rs 990
Stop-Loss: Rs 898
Kunal Kamble, Senior Technical Research Analyst at Bonanza Portfolio
Infosys | CMP: Rs 1,823.25
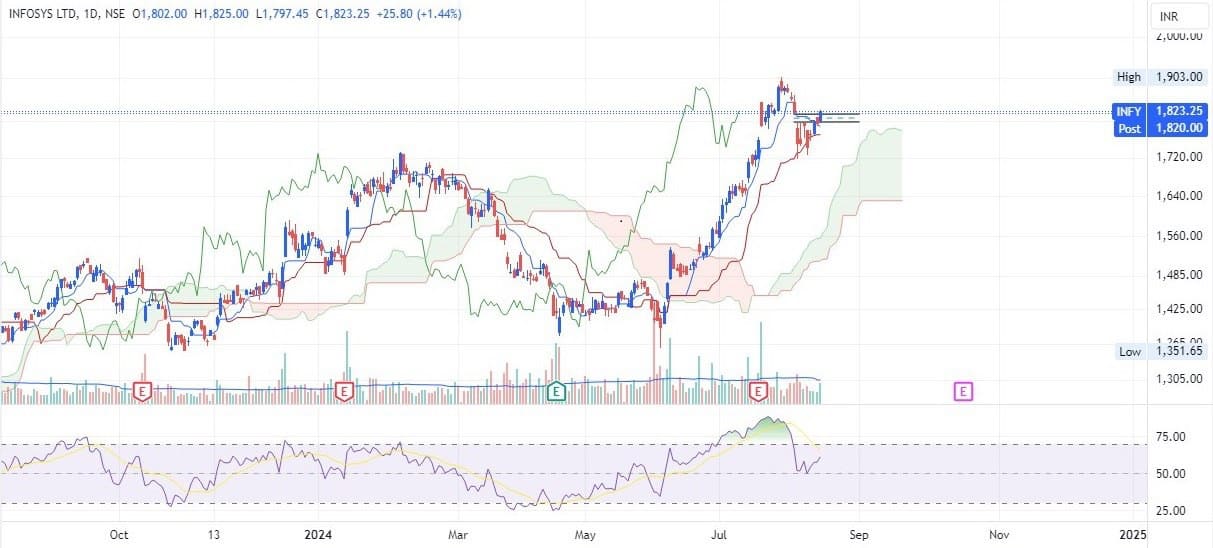
Infosys has completed sub-wave 4, and sub-wave 5 has just begun, indicating a continuation of the impulsive move. The security has closed above the falling window, which also suggests bullishness. The declining volume during the fall indicated a retracement, while higher volume today signifies increased buyer interest. The price is trading above both the 20-day EMA (Fast) and the 50-day EMA (Slow), with the EMAs trending upward, signaling a potential upward move. Additionally, the RSI, after a period of cooling off, is moving in a northern direction, supporting the price action.
Strategy: Buy
Target: Rs 2,020
Stop-Loss: Rs 1,720
Tata Consultancy Services | CMP: Rs 4,295.25

TCS is riding sub-wave 5 of sub-wave 3. The security has managed to close above the falling window that was acting as resistance. The increase in volume on buying days indicates strong buyer interest in the stock. Additionally, the price has taken support from the Base Line and has closed above the Conversion Line, which signals an uptrend. The upward movement of the RSI further supports the positive price action. Based on this technical setup, a long position in TCS can be established.
Strategy: Buy
Target: Rs 4,550, Rs 4,570
Stop-Loss: Rs 4,140
Marksans Pharma | CMP: Rs 214.33

On the daily timeframe, Marksans Pharma has broken out to new all-time highs, signaling a continuation of the uptrend. The security closed near its highs, indicating strong buyer interest. The increase in volume supports this price action, suggesting that buyers are keen on the security at the current market price (CMP). The price is trading above both the base line and the conversion line, reinforcing the uptrend. Additionally, on the directional front, the DI+ (directional indicator) is above the DI-, indicating an uptrend, while the ADX (average directional index) above the DI- shows strength in the upward movement.
Strategy: Buy
Target: Rs 273
Stop-Loss: Rs 185
Rane Madras | CMP: Rs 1,004.85
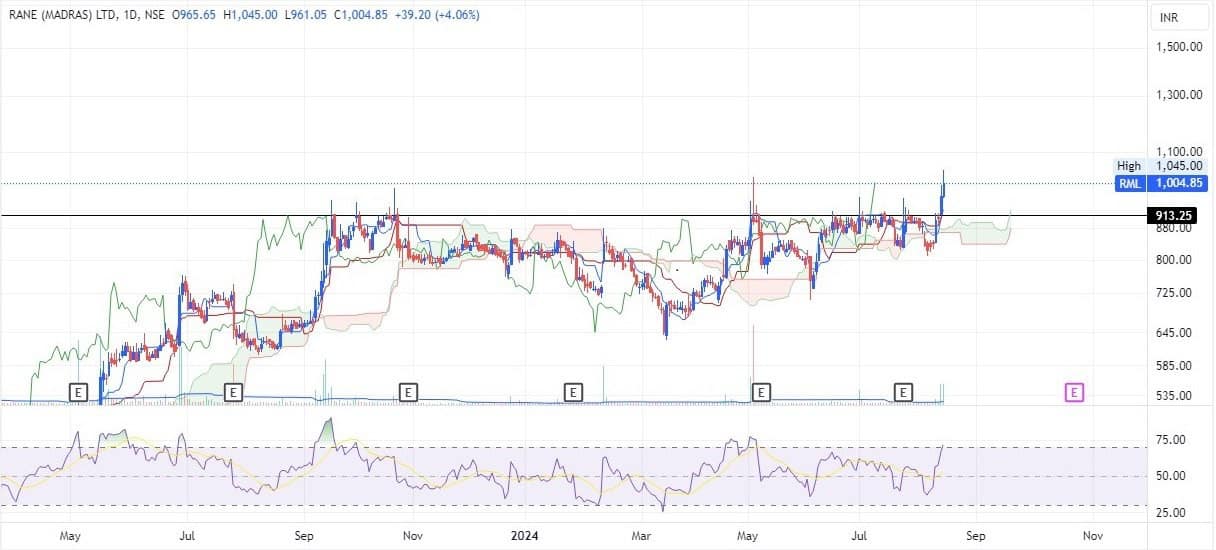
Rane Madras has closed above resistance for two consecutive days, with increasing volume indicating a buying opportunity. The price is trading above both the Base Line and the Conversion Line, signaling an uptrend in the security. Additionally, the RSI moving upward supports the positive price action. The DI+ is above the DI-, indicating an uptrend, and the ADX trading above the DI- suggests strength in the upward movement. Based on this technical setup, a buying opportunity is present.
Strategy: Buy
Target: Rs 1,200
Stop-Loss: Rs 905
Chandan Taparia, Senior Vice President | Analyst-Derivatives at Motilal Oswal Financial Services
ICICI Lombard General Insurance Company | CMP: Rs 1,977.95
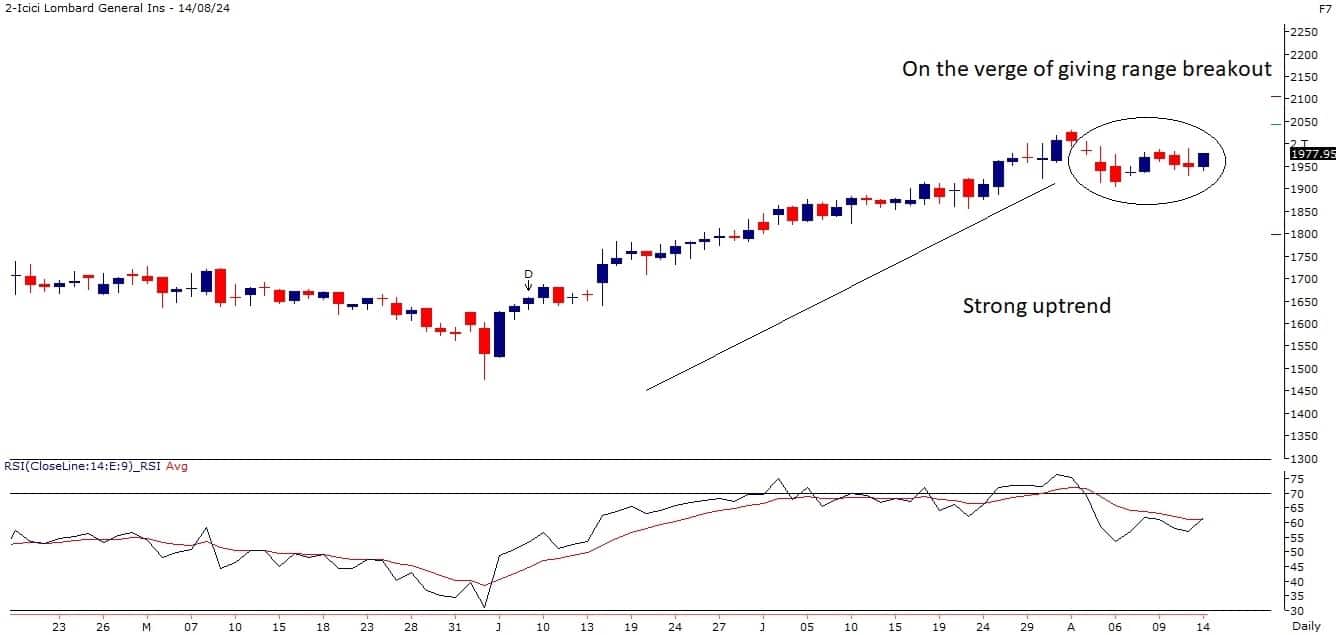
ICICI Lombard has formed a rising three candle pattern on the daily scale, which is a bullish continuation pattern. It is on the verge of giving a breakout on the daily chart. The stock has also bounced back up from its 20-day EMA, indicating bullish sentiment.
Strategy: Buy
Target: Rs 2,100
Stop-Loss: Rs 1,910
Havells India | CMP: Rs 1,845.95
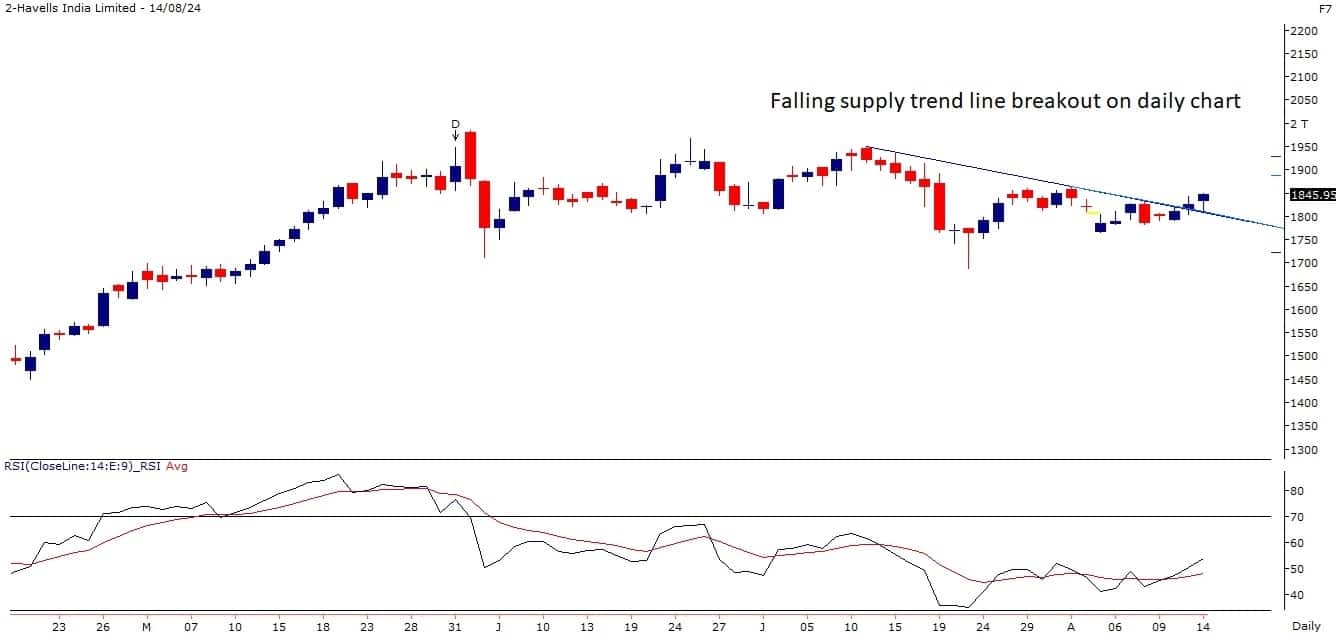
Havells has given a falling supply trendline breakout on the daily chart and is holding well above the same. It is trading above all crucial moving averages, which has bullish implications.
Strategy: Buy
Target: Rs 1,950
Stop-Loss: Rs 1,800
Vidnyan S Sawant, Head of Research at GEPL Capital
HCL Technologies | CMP: Rs 1,626.15

HCL Technologies is forming higher tops and bottoms on the monthly scale, indicating a bullish price structure. On the weekly scale, the stock has shown a robust upward trajectory, with a 15-week correction being retraced in just 8 weeks. Notably, on the daily scale, the stock appears poised to break out of a Cup and Handle bullish chart pattern, further supporting an optimistic outlook. The stock continues to trade above the key 12-week and 26-week EMAs, with the weekly RSI above 60, reinforcing the bullish momentum. Looking ahead, there is potential upside for the stock, with a target of Rs 1,950.
Strategy: Buy
Target: Rs 1,950
Stop-Loss: Rs 1,490
Uno Minda | CMP: Rs 1,107

Uno Minda maintains a bullish trend on the higher timeframe. On the weekly scale, the stock has demonstrated strong resilience, indicating a robust price structure. On the daily scale, it has experienced a bullish mean reversion from the 100-day EMA. The stock continues to hold above key moving averages, including the 12-week and 26-week EMAs. Additionally, the MACD (Moving Average Convergence Divergence) momentum indicator is trending higher, signaling a positive trend supported by sustained bullish momentum. Looking ahead, there is potential upside for the stock, with a target of Rs 1,322.
Strategy: Buy
Target: Rs 1,322
Stop-Loss: Rs 1,013
Jubilant Foodworks | CMP: Rs 637.45
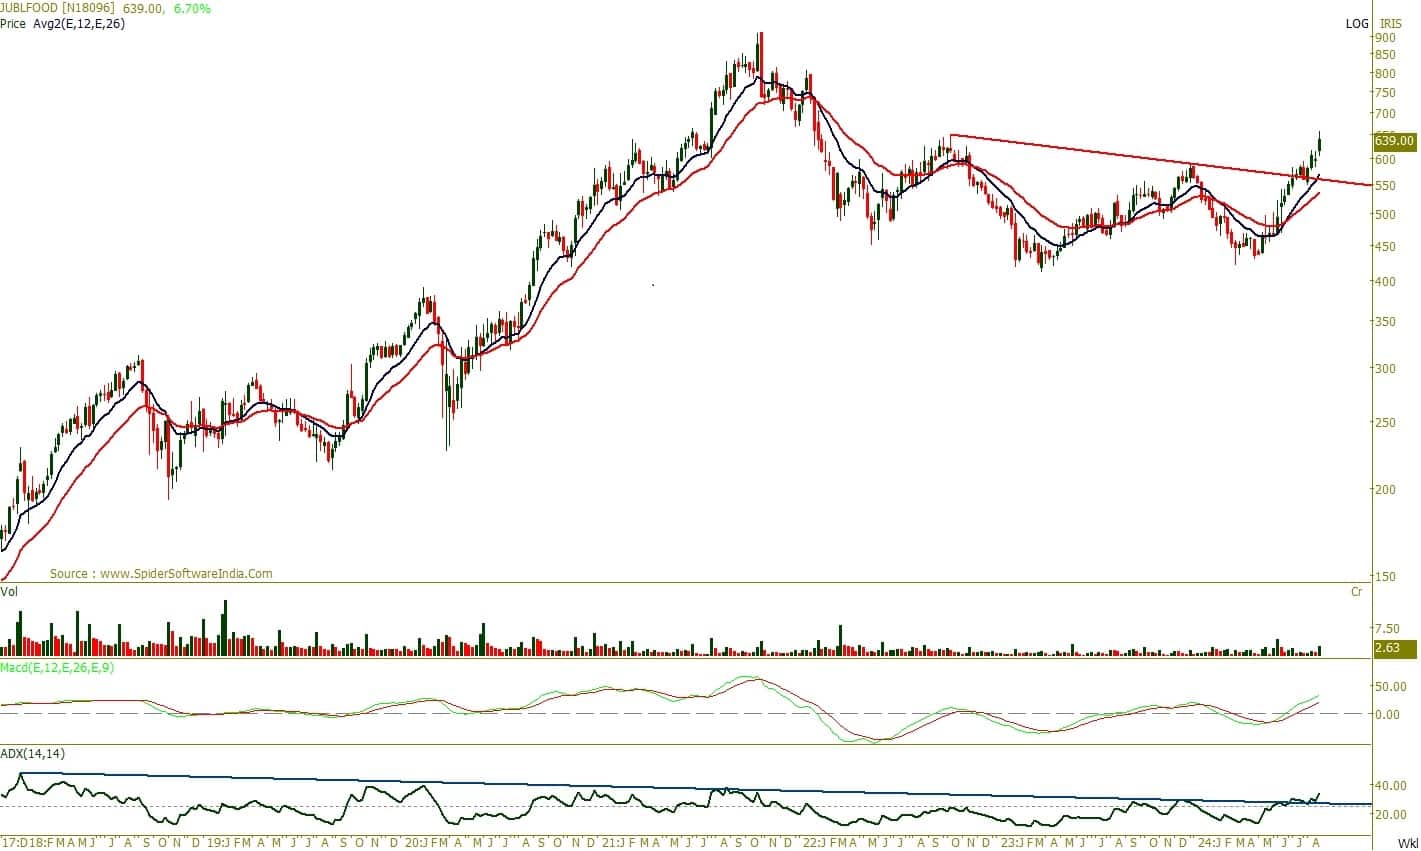
Jubilant Foodworks has demonstrated a strong price structure, forming a large base indicative of an accumulation phase. In July 2024, the stock broke out from a significant level, confirming robust momentum and setting the stage for a potentially strong upward trend. Regarding indicators, the MACD is showing a positive trend with higher bases and remains above the zero line, indicating accelerating momentum. Additionally, the trend indicator has broken out of a sloping trend line extending from 2018, reinforcing the potential for substantial price growth. Looking ahead, the stock appears poised for further gains, with a target set at Rs 780.
Strategy: Buy
Target: Rs 780
Stop-Loss: Rs 587
Federal Bank | CMP: Rs 202.73

Federal Bank from the banking sector has shown robust price stability and bullish momentum across timeframes. On the weekly scale, the stock continues to form higher tops and higher bottoms, confirming a bullish trend. It is comfortably trading above key averages, including the 12, 26, and 50-week EMAs. Additionally, the MACD is trending upward, and the RSI above 70 further reinforces the bullish trend, backed by strong momentum. Looking ahead, there is a potential upside for the stock, with a target of Rs 237.
Strategy: Buy
Target: Rs 237
Stop-Loss: Rs 185
Disclaimer: The views and investment tips expressed by investment experts on Moneycontrol.com are their own and not those of the website or its management. Moneycontrol.com advises users to check with certified experts before taking any investment decisions.
Discover the latest Business News, Sensex, and Nifty updates. Obtain Personal Finance insights, tax queries, and expert opinions on Moneycontrol or download the Moneycontrol App to stay updated!
Find the best of Al News in one place, specially curated for you every weekend.
Stay on top of the latest tech trends and biggest startup news.


