


The market recorded a 2.5 percent rally for the week ending March 31, marking the highest weekly rally since July of last year. This rally tracked the positive mood of global markets and was driven by buying in all key sectors. Friday's sharp upmove helped the indices post a stellar performance for the week.
The Nifty50 settled at its highest closing level in the last three weeks at 17,360 on Friday, decisively breaking the consolidation range of (16,800-17,200) over the past couple of weeks. The index formed a long bullish candlestick pattern on the daily and weekly charts, indicating the strength of the bulls.
The index is likely to extend its uptrend towards the 17,500-17,600 area, which coincides with the 200-day EMA (exponential moving average) and where the maximum Call open interest, as well as Call writing, has taken place. However, some consolidation is expected in the coming sessions, whereas the crucial support is placed at the 17,000 mark, according to experts.
"The broad-based buying has lifted market sentiments and can be seen as a sign of progression as we emerge from the slumber phase," said Osho Krishan, Senior Analyst - Technical & Derivative Research at Angel One.
As far as levels are concerned, he believes the bullish gap of the 17,200-17,130 odd zone is expected to cushion any short-term blip, with the sacrosanct support placed around the psychological mark of 17,000 for the time being.
While on the higher end, a decisive move beyond the bearish gap of 17,450-17,580 would affirm the trend reversal in the market, he says.
Foram Chheda, Technical Research Analyst and Founder of ChartAnalytics.co.in also feels the immediate support for Nifty is at 16,900.
On the flip side, "the immediate resistance is at 17,500-17,650; only a strong bounce above 17,650 or violation of 16,900 levels will help the index take any sustainable directional move," she said.
Meanwhile, Osho expects strong moves in the broader markets, so he advised that one needs to have a stock-centric approach for better trading opportunities. The broader markets also gained strength during the week as the Nifty Midcap 100 and Smallcap 100 indices 1.6 percent and 0.8 percent for last week.
Let's take a look at the top 10 trading ideas by experts for the next three-four weeks. Returns are based on the March 31 closing prices:
Expert: Nagaraj Shetti, Technical Research Analyst at HDFC Securities
Punjab National Bank: Buy | LTP: Rs 46.60 | Stop-Loss: Rs 43.50 | Target: Rs 54 | Return: 16 percent
The sharp downtrend of the last three weeks seems to have completed in this PSU banking stock (PNB). The present chart pattern indicates a formation of new lower bottom around Rs 44.40 in last week. Presently, the stock price is placed to show a decisive upside breakout of the hurdle at Rs 47.50 as per change in polarity.
Rise in volume during up move in the stock price and daily/weekly RSI (relative strength index) shows positive indication.
Buying can be initiated in PNB at CMP (Rs 46.60), add more on dips down to Rs 45, wait for the upside target of Rs 50 and next Rs 54 in the next 4-5 weeks. Place a stop-loss of Rs 43.50.

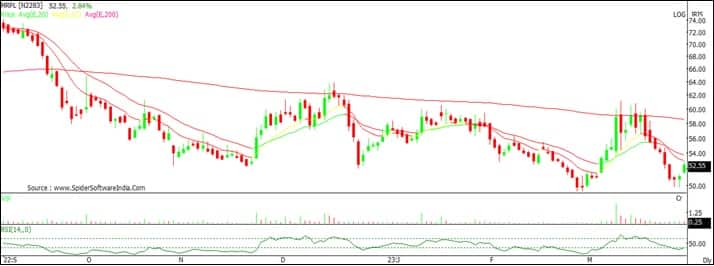
MRPL: Buy | LTP: Rs 52.55 | Stop-Loss: Rs 48.50 | Target: Rs 63 | Return: 20 percent
The daily timeframe chart of Mangalore Refinery and Petrochemicals (MRPL) indicates a larger swing movement of up and down over the last few months. The stock price seems to have formed a crucial bottom reversal at Rs 49.75 recently and moved up decently on Friday.
The daily candle pattern of the last 3-4 sessions indicate a bullish candlestick formation of Morning Star at the lows (not a classical one). This is positive indication and one may expect further upside in the short term.
Volume is expected to expand during further upside in the stock price and daily 14 period RSI shows positive indication. The overall chart pattern of MRPL signal long trading opportunity. One may look to create positional buy as per the levels mentioned above.
One may look to buy MRPL at CMP (Rs 52.55), add more on dips down to Rs 50.50 and wait for the upside target of Rs 57 and next 63 in the next 4-5 weeks. Place a stop-loss of Rs 48.50.
Expert: Shrikant Chouhan, Head of Equity Research (Retail) at Kotak Securities
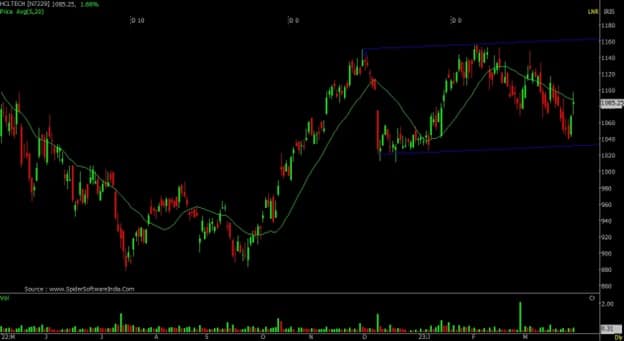
HCL Technologies: Buy | LTP: Rs 1,085 | Stop-Loss: Rs 1,039 | Target: Rs 1,200 | Return: 11 percent
It is in "Rising Running" corrective mode. The stock made a higher low at Rs 1,039 in the current month compared to Rs 1,011 in December 2022. It suggests being relatively strong compared to other top 3 giant IT companies.
Based on it the positional trader should be a buyer at current levels and add more on a decline to Rs 1,050. Keep the stop-loss at Rs 1,039 for a target of Rs 1,200.
Coromandel International: Buy | LTP: Rs 879 | Stop-Loss: Rs 830 | Target: Rs 1,040 | Return: 18 percent
Since the last 4 months, the stock is consolidating between Rs 840 and Rs 940 levels. In the month of March 2023, the stock formed a double bottom formation, which is a bullish sign for it. It has also completed a harmonic corrective pattern at Rs 841, which will pull the stock higher.
To validate the double bottom, the stock needs to cross Rs 940 level, which should be the minimum target for the positional trader. In the best-case scenario, the stock may go up to Rs 1,040 in the coming few months.
The strategy should be to buy at current levels and more if it falls to Rs 850. Place stop-loss at Rs 830.

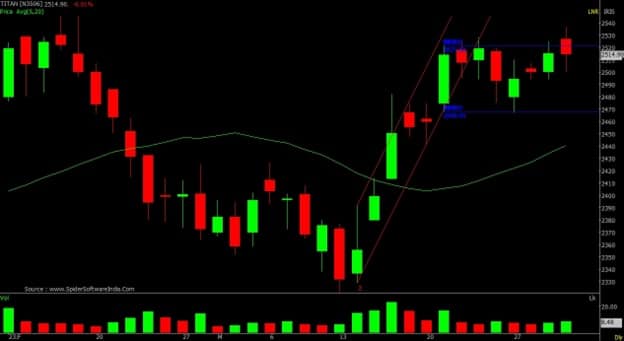
Titan Company: Buy | LTP: Rs 2,515 | Stop-Loss: Rs 2,460 | Target: Rs 2,630 | Return: 5 percent
The stock was at Rs 2,321 in mid-March 2023, it moved to Rs 2,521 within 7 trading sessions, which could be a pole formation for it. It later spent 7 days inside a narrow rectangle trading range of Rs 2,468 and Rs 2,528 which could be a flag for it.
It is a flag formation, which is a bullish continuation formation which will lift the stock towards Rs 2,600 or Rs 2,630 levels in the near term. At current levels, the reward to risk is favourable. Buy with a final stop-loss of Rs 2,460.
Expert: Ruchit Jain, Lead Research at 5paisa.com
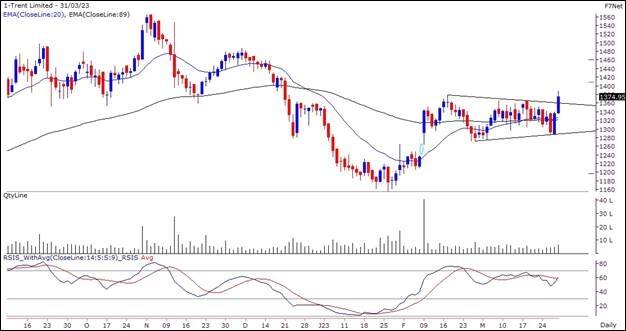
Trent: Buy | LTP: Rs 1,375 | Stop-Loss: Rs 1,330 | Target: Rs 1,460 | Return: 6 percent
The stock had seen an ‘Impulsive’ upmove in the month of February which was followed by a consolidation phase in last one month. The prices have now given a breakout from this consolidation indicating a continuation of its short term uptrend.
The RSI oscillator also has given a positive crossover indicating a bullish momentum and hence, we expect the stock to rally higher in the near term.
Traders can buy the stock in the range of Rs 1,375-1,365 for potential short term targets of Rs 1,425 and Rs 1,460. The stop-loss on long positions should be placed below Rs 1,330.
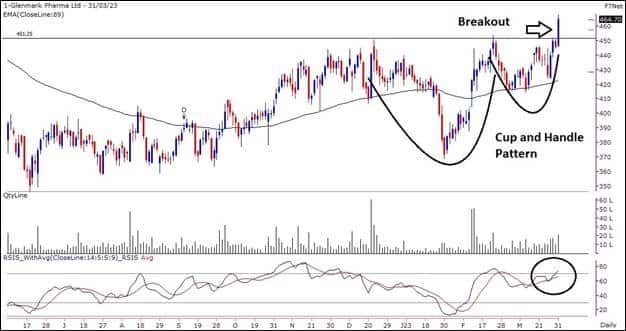
Glenmark Pharma: Buy | LTP: Rs 465 | Stop-Loss: Rs 444 | Target: Rs 485 | Return: 4 percent
The stock has recently seen a consolidation phase and has formed a ‘Cup and Handle’ pattern. Prices gave a breakout above the neckline of the pattern in Friday’s session and thus the near term trend has turned positive for the stock. The volumes along with the price breakout are good and the RSI oscillator is hinting at a positive momentum.
Traders can buy the stock on declines in the range of Rs 459-454 for potential short term targets of Rs 475 and Rs 485. The stop-loss on long positions should be placed below Rs 444.
Expert: Foram Chheda, Technical Research Analyst and Founder of ChartAnalytics.co.in
JBM Auto: Buy | LTP: Rs 644 | Stop-Loss: Rs 610 | Target: Rs 730 | Return: 13 percent
After forming a triple bottom at Rs 380-385 levels in September 2022, the stock price of JBM Auto has witnessed a gradual up-move that halted near the resistance level of Rs 670 which also led to the formation of a major double-top on the weekly chart.
The stock price has been consolidating in a range of Rs 600-660 and currently, it had been trading near the double-top. Any up move above Rs 660 with a thrust will lead to a multi-month breakout.
While the stock tests the crucial price levels, the volumes are higher than their 20-month average which supports the bullishness in the stock.
Additionally, the relative strength (RS) is at a 52-week; this indicates relative outperformance against the broader markets. The stock be bought above Rs 660 with a target of Rs 730 and a stop-loss of Rs 610.

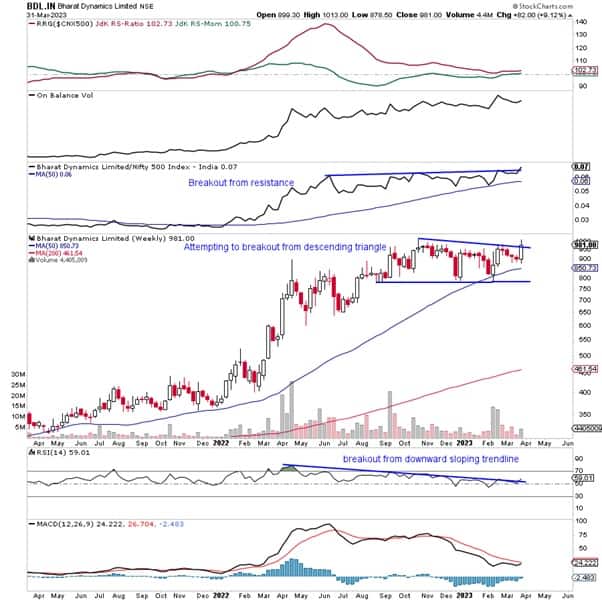
Bharat Dynamics: Buy | LTP: Rs 989 | Stop-Loss: Rs 923 | Target: Rs 1,045 | Return: 6 percent
Since the level of Rs 350, the price of Bharat Dynamics (BDL) has been in a secular uptrend. This up move halted near Rs 1,020-1,025 levels in October 2022. Since then, the stock has stayed under corrective consolidation; it has been moving sideways in a defined trading range.
While staying in this phase, the stock also took support at its 50-week MA (moving average); this is where it also formed a brief double bottom and resumed its up-move.
The stock has closed at a 52-week high; it is also attempting to break out from the sideways consolidation range with higher-than-average volumes. This potential breakout can trigger a potential up-move by close to 6 percent. The stock can be entered between the Rs 970-985 range with a target of Rs 1,045 while placing a stop-loss at Rs 923.
Manappuram Finance: Buy | LTP: Rs 123.7 | Stop-Loss: Rs 114 | Target: Rs 135 | Return: 9 percent
After forming a bottom at Rs 80-81 levels in June 2022, the stock price of Manappuram Finance moved higher. While finding resistance at Rs 125 levels more than once, the price formed higher bottoms which led to the development of an ascending triangle.
Currently, the stock is seen testing the neckline of the bullish ascending triangle. Any move above Rs 125 will lead to a breakout from this pattern. The Relative Strength has made a breakout from the horizontal trendline which indicates that a price breakout can be expected; it has also crossed above the 50-period MA.
Simultaneously, MACD (moving average convergence divergence) has also moved in the positive territory which adds bullishness to the stock. Thus one can consider buying the stock near Rs 125 levels with a stop-loss of Rs 114 and a target of Rs 135.

Disclaimer: The views and investment tips expressed by investment experts on Moneycontrol.com are their own and not those of the website or its management. Moneycontrol.com advises users to check with certified experts before taking any investment decisions.
Discover the latest Business News, Sensex, and Nifty updates. Obtain Personal Finance insights, tax queries, and expert opinions on Moneycontrol or download the Moneycontrol App to stay updated!
Find the best of Al News in one place, specially curated for you every weekend.
Stay on top of the latest tech trends and biggest startup news.


