


The market went into a sharp correction during the six-day week ended January 20, triggered by heavy selling in bank stocks after disappointing results from HDFC Bank, and amid concerns over Fed funds rate cut and weak global cues. The Nifty 50 has formed a long bearish candlestick pattern which resembles a bearish engulfing kind of pattern formation on the weekly charts at the top of the market upcycle, indicating the possibility of weakness, though higher high formation continued for eighth consecutive week.
Hence, if the index breaks the low of this month around 21,300, the crucial support, then further correction towards 21,000 mark can't be ruled out, while 21,850 will be crucial for further upside in the 'sell on rally' market, experts said.
The Nifty 50 fell 1.5 percent to 21,572 for the week, with strong volumes.
"Going forward, the crucial support for the index will be the weekly low at 21,285. If the level is breached, the bulls will lose their confidence and the panic will spread throughout the markets," Jigar Patel, senior manager - equity research at Anand Rathi said.
However, if Nifty recovers, the level of 21,800-21,900 will be a true test for the bulls as the daily scale has a gap area, he feels.
Ajit Mishra, SVP - technical research at Religare Broking expects the Nifty 50 to remain rangebound with bias on the negative side until the market sees improvement in the banking pack. On the higher side, 21,850-22,000 would be tough to cross while the 21,000-21,200 zone will act as a cushion, in case the decline resumes.
Meanwhile, Jigar continued to advise traders to be light from now on and stay stock specific.
Moneycontrol collated a list of 10 stock ideas from experts with 3-4 weeks perspective. The closing price of January 20 has taken for returns calculation.
Expert: Vinay Rajani, CMT, senior technical & derivative analyst at HDFC Securities
NLC India: Buy | LTP: Rs 242 | Stop-Loss: Rs 222 | Target: Rs 290 | Return: 20 percent
The stock price has broken out from symmetrical triangle on the daily chart. Price breakout is accompanied with jump in volumes. It has been forming higher tops and higher bottoms on the daily and weekly charts.
Stock price is placed above all important moving averages, indicating bullish trend on all time frames. Indicators and oscillators like DMI (directional movement index) and RSI (relative strength index) have turned bullish on the daily charts.

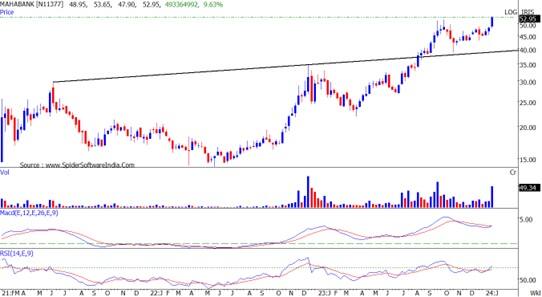
Bank of Maharashtra: Buy | LTP: Rs 53 | Stop-Loss: Rs 47.9 | Target: Rs 60 | Return: 13 percent
The stock price has found support on upward sloping trendline on the weekly chart. The stock has registered new 52-week high with higher volumes.
Indicators and oscillators like DMI and RSI have turned bullish on the daily charts. PSU Bank sector has started outperforming.
RPG Life Sciences: Buy | LTP: Rs 1,551 | Stop-Loss: Rs 1,428 | Target: Rs 1,799 | Return: 16 percent
The stock price has formed rounding bottom formation on the daily chart. Stock has registered fresh all-time high of Rs 1,580.
The stock is placed above all important moving averages, indicating bullish trend on all time frames. Indicators and oscillators like DMI and RSI have turned bullish on the daily charts. Price breakout is accompanied with jump in volumes.

Expert: Omkar Patil, technical & derivatives analyst - institutional equity at Ashika Group
Bharat Electronics: Buy | LTP: Rs 193.4 | Stop-Loss: Rs 186 | Target: Rs 210 | Return: 8.6 percent
The stock of BEL is currently trading at an all-time high, indicating robust momentum in its ongoing trend. Noteworthy is the recent breakout from a consolidation zone within the range of Rs 182-189, signaling a continuation of the prior uptrend.
The RSI above the 60 mark on the daily timeframe further confirms the presence of positive momentum in the stock's trend.
Going ahead, we expect the prices to move higher till the mark of Rs 210 where the stop-loss must be Rs 186 on a daily closing basis.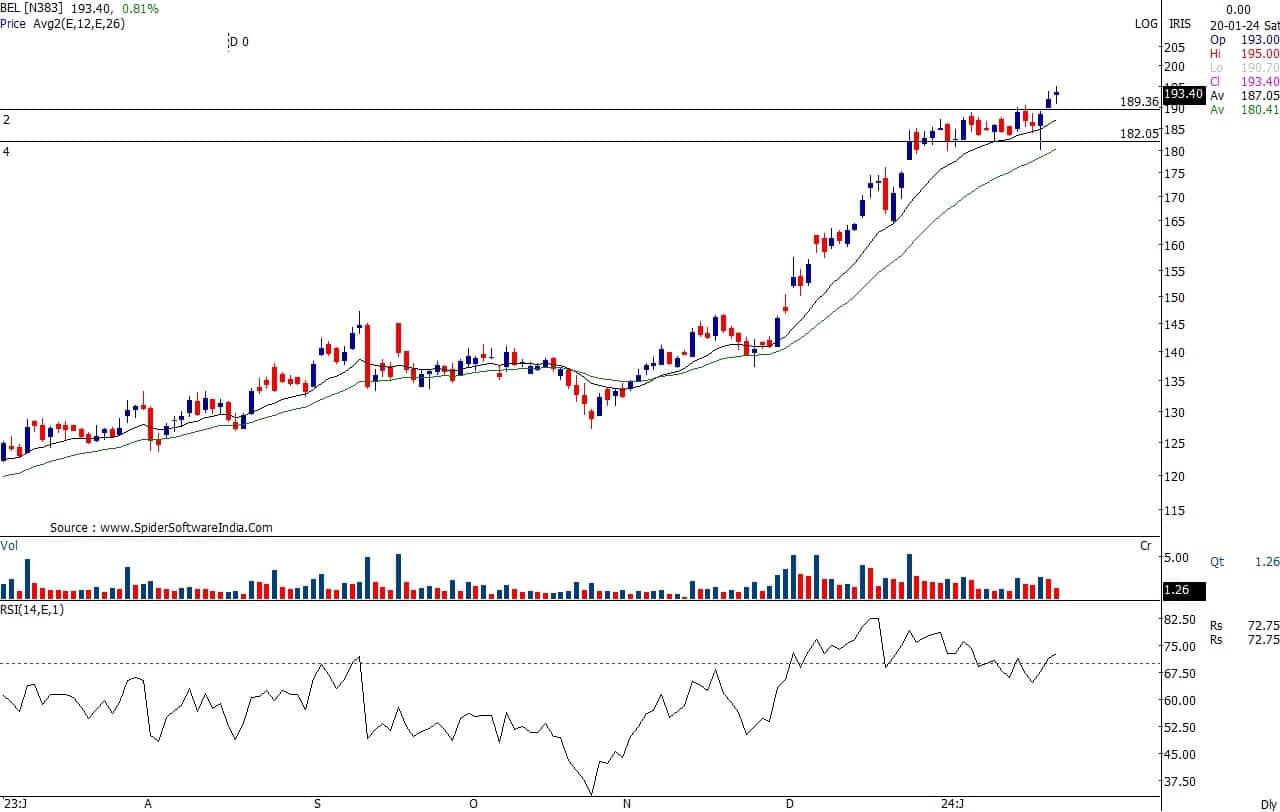
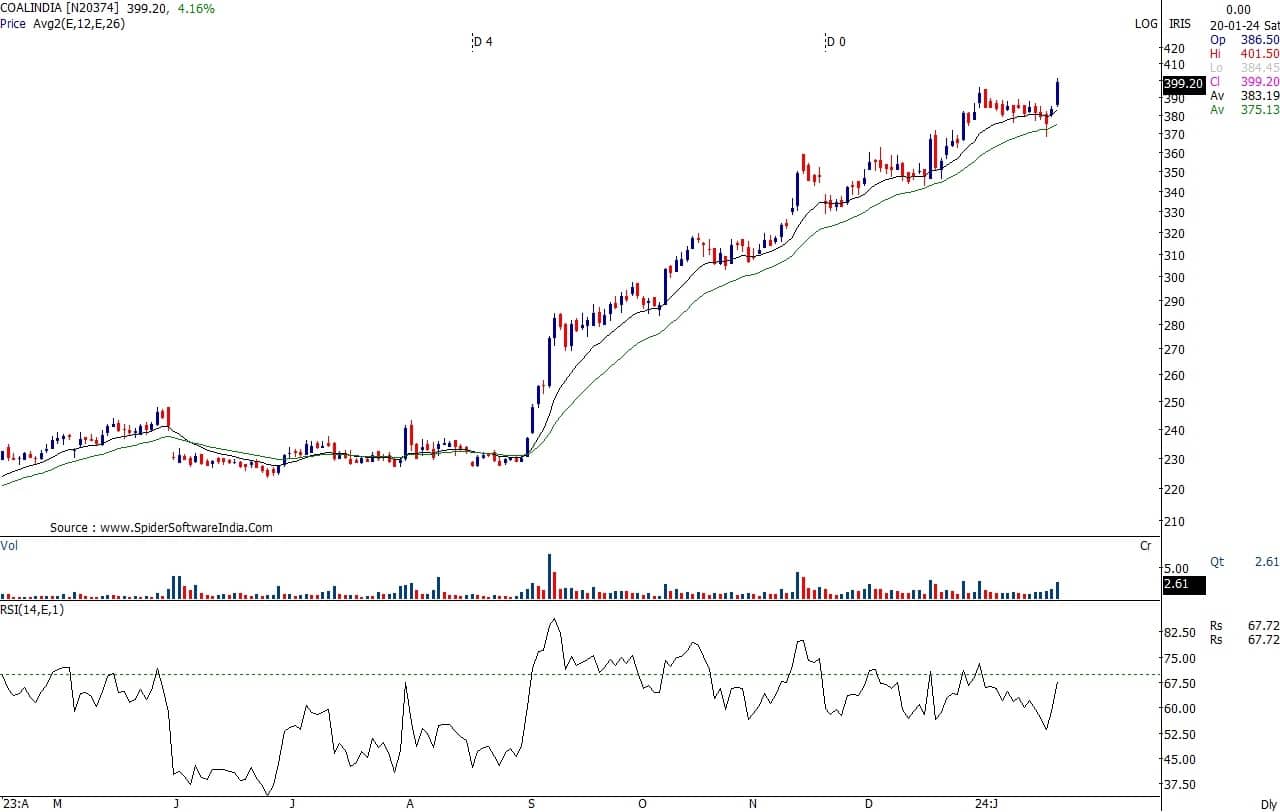
Coal India: Buy | LTP: Rs 399 | Stop-Loss: Rs 384 | Target: Rs 435 | Return: 9 percent
The stock of Coal India is presently trading at a multi-year high, marking its highest level since August 2015. The stock's upward movement from the lower levels of Rs 230 has been characterized by the formation of higher highs and higher lows, indicating a positive trend.
The recent upmove in the stock was accompanied by a surge in trading volume, suggesting strong participation.
Going ahead, we expect the prices to move higher till Rs 435 where the stop-loss must be Rs 384 on a daily closing basis.
By Shrikant Chouhan, head – equity research at Kotak Securities
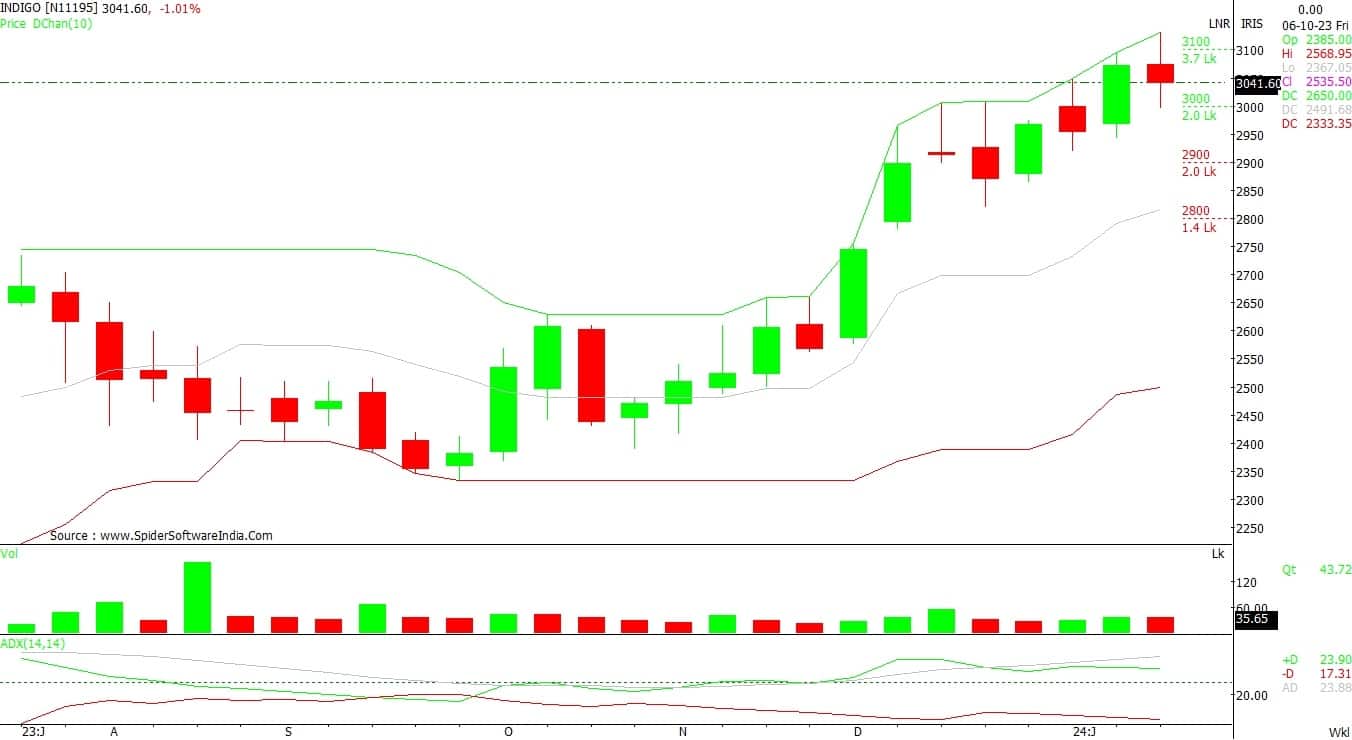
InterGlobe Aviation: Buy | LTP: Rs 3,044.65 | Stop-Loss: Rs 2,935 | Target: Rs 3,250 | Return: 7 percent
On the weekly charts, the counter is into a rising channel chart formation with higher high and higher low series pattern. Additionally, the technical indicators like ADX (average directional index) and RSI is also indicating further up trend from current levels which could boost the bullish momentum in the near future.
Bank of Baroda: Buy | LTP: Rs 232.5 | Stop-Loss: Rs 225 | Target: Rs 250 | Return: 7.5 percent
The stock has shown a decent rally from the lower levels in the recent trading sessions. Moreover, there is a fresh breakout along with incremental volume activity from the triangle chart formation. As a result, the comfortable close above its breakout levels suggest upward momentum to persist in the coming horizon.

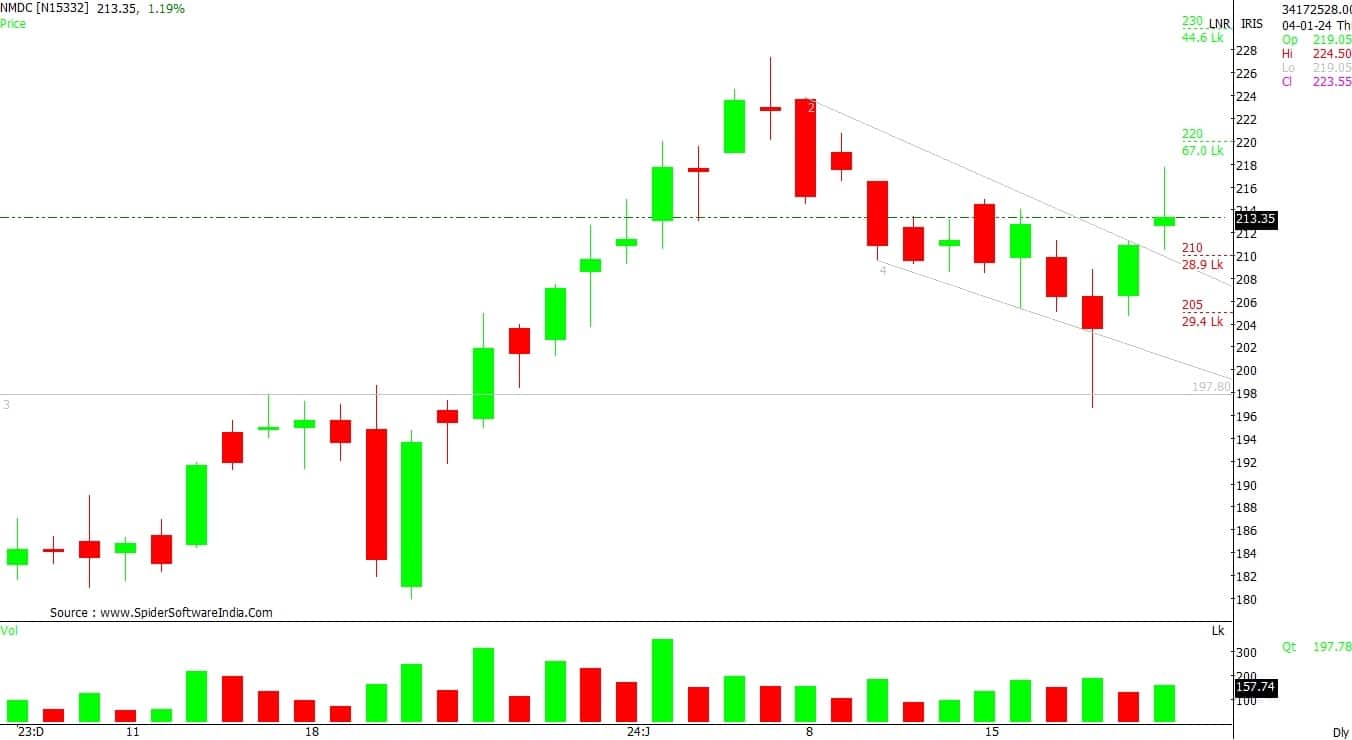
NMDC: Buy | LTP: Rs 213 | Stop-Loss: Rs 205 | Target: Rs 230 | Return: 8 percent
Post decline from the higher levels, the counter rebounded from its demand zone and witnessed a steady recovery from the lower levels. Additionally, on the daily charts, the counter has given a breakout from its sloping channel formation.
The up moves in the counter suggest a new leg of bullish trend from the current levels.
Expert: Jigar Patel, senior manager - equity research at Anand Rathi
Tanla Platforms: Buy | LTP: Rs 1,178 | Stop-Loss: Rs 1,107 | Target: Rs 1,300 | Return: 10 percent
Since the last 3 weeks or so, the said counter has been consolidating in zones Rs 1,070–1,150. On January 10, 2024, it took out the said range, thus making it lucrative at current levels.
On the indicator front, the weekly MACD (moving average convergence divergence) has given a bullish cross exactly above the zero line, which is a sign of further bullishness in the counter. Thus, one can buy in the range of Rs 1,165–1,180 with an upside target of Rs 1,300 and a stop-loss of Rs 1,107 on a daily close basis.

By Om Mehra, technical analyst at Samco Securities
Indian Hotels Company: Buy | LTP: Rs 479 | Stop-Loss: Rs 460 | Target: Rs 522 | Return: 9 percent
The Indian Hotels Company is currently trading at Rs 479, demonstrating a consistent upward trend within a positive rising channel. This bullish movement is further supported by its short-term moving averages of 20 and 50 indicating a favourable short-term momentum.
Additionally, weekly RSI stands at 74 and is trending upward suggesting increased buying participation and positive investor sentiment. Furthermore, the stock has recently surpassed a significant trendline resistance which had been acting as a formidable supply zone. This breakout is a strong indication of a potential upward surge in the stock price.
Hence, based on the above technical structure, one can initiate a long position at CMP Rs 479 for a target price of Rs 522. The stop-loss can be kept at Rs 460.
Disclaimer: The views and investment tips expressed by investment experts on Moneycontrol.com are their own and not those of the website or its management. Moneycontrol.com advises users to check with certified experts before taking any investment decisions.
Discover the latest Business News, Sensex, and Nifty updates. Obtain Personal Finance insights, tax queries, and expert opinions on Moneycontrol or download the Moneycontrol App to stay updated!
Find the best of Al News in one place, specially curated for you every weekend.
Stay on top of the latest tech trends and biggest startup news.


