
The Nifty remained bearish in the second half of the week after staying sideways in the first half to end lower as it slipped below the important support of 17,000.
On the weekly timeframe, the index made a bearish candle for the third consecutive time. If 16,850 is broken, the Nifty can slid to 16,500-16,400.
The immediate support on the downside is at 16,850-16,800, whereas the hurdle is at 17,100 where the highest open interest is built up on the Call side. Till the time Nifty is in this range, it is will remain sideways.
On the indicator front, the momentum indicator relative strength index (RSI 14) is showing a reading of 35 and the Nifty is trading below its 20/50/100/200 exponential moving averages (EMAs). The Ichimoku indicator, too, is also indicating bearishness.
On the options front, a short buildup was seen in in-the-money (ITM) Calls, while long unwinding was seen in out-of-the-money (OTM) Puts, which point to a bearish market. The highest short buildup was at 17,100 and 17,000 has and highest long buildup at 17,000 and 16,500.
Here are three buy calls for the short term:
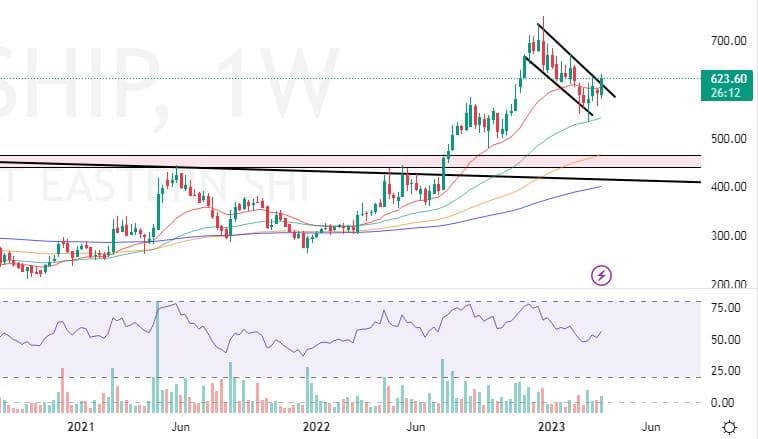
Great Eastern Shipping Company: Buy | LTP: Rs 624.5 | Stop-Loss: Rs 590 | Target: Rs 680 | Return: 9 percent
The stock has broken out of a downward-slopping parallel channel after five months, with a bullish candle on the weekly timeframe. On the daily timeframe, the stock traded above the highs of the last 10 days.
On the indicator front, the super-trend indicator is suggesting that bullish trend continuation on the weekly timeframe and the Ichimoku cloud is also suggesting a bullish move, as the stock is trading above the conversion and base line on the daily timeframe.
Momentum oscillator RSI (14) is at around 59 on the daily time frame, indicating strength by sustaining above 50. The above-mentioned factors indicate that a bullish move in GE Shipping is possible for targets of up to Rs 680. One can initiate a buy trade in the Rs 621-624 range, with a stop-loss of Rs 590 on a daily closing basis.
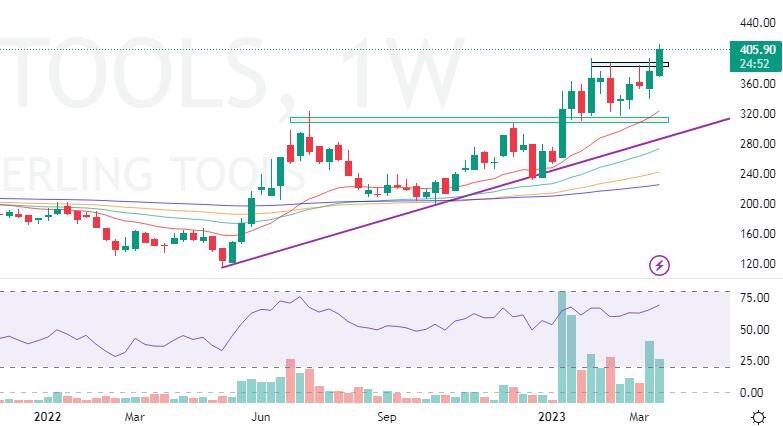
Sterling Tools: Buy | LTP: Rs 406 | Stop-Loss: Rs 380 | Target: Rs 440 | Return: 18 percent
Sterling Tools is making higher highs, higher lows on the weekly It recently broke out of a resistance zone after seven weeks with a strong bullish candle and the super-trend indicator is also pointing to the continuation of the bullish trend, which can be used as confluence towards the bullish view.
Momentum oscillator RSI (14) is at around 65 on the daily time frame, indicating strength by sustaining above 50 and the Ichimoku cloud is also suggesting a bullish move as the price is trading above the cloud.
These factors indicate that a bullish move in Sterling Tools is possible for targets of up to Rs 440. One can initiate a buy trade in the Rs 402-405 range with a stop-loss of Rs 380 on the daily closing basis.
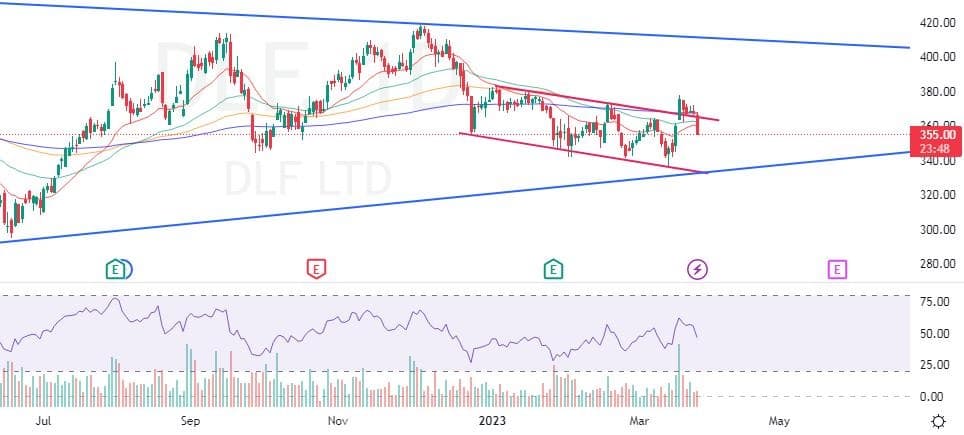
DLF: Sell | LTP: Rs 354 | Stop-Loss: Rs 369 | Target: Rs 335 | Return: 5 percent
DLF has decisively broken out of the upper threshold of the channel downward on the daily timeframe with a big bearish candle and the stock is rejecting and trading below its 20/50/100/200 EMAs on the daily time frame, which supports the bearish view.
Momentum oscillator RSI (14) is at around 46 on the daily time frame, indicating weakness by sustaining below 50 levels and at the same time, the Ichimoku cloud is also suggesting a bearish move as the price is trading above conversion and base line on the daily time frame.
These factors indicate that a bearish move in DLF is possible for targets of up to Rs 335. One can initiate a sell trade in the Rs 358-356 range with a stop-loss of Rs 369 on a daily closing basis.
Disclaimer: The views and investment tips expressed by experts on Moneycontrol.com are their own and not those of the website or its management. Moneycontrol.com advises users to check with certified experts before taking any investment decisions.

Discover the latest Business News, Sensex, and Nifty updates. Obtain Personal Finance insights, tax queries, and expert opinions on Moneycontrol or download the Moneycontrol App to stay updated!
Find the best of Al News in one place, specially curated for you every weekend.
Stay on top of the latest tech trends and biggest startup news.


