


The Nifty index closed in green for the ninth consecutive day above the strong resistance zone of 17,800 on April 13 and is expected to trade with a bullish bias in the coming week as the bulls continue to dominate for the third consecutive week.
17,700 mark is expected to act as a strong support zone and if held in the forthcoming week, Nifty will start moving towards 18,000 levels.
The support on the downside is at 17,700, 17,600 and 17,500, whereas the immediate hurdles are at 17,800, 17,900 and 18,050. Highest open interest is at 18,000 on the call side and 17,800 on the Put side and till the time Nifty is in this range, it is expected to remain sideways to bullish.
On the indicator front, the momentum indicator relative strength index (RSI 14) is showing a reading of 65 and Nifty is trading above its 200-day EMA (exponential moving average) at 17524 which indicates strength.
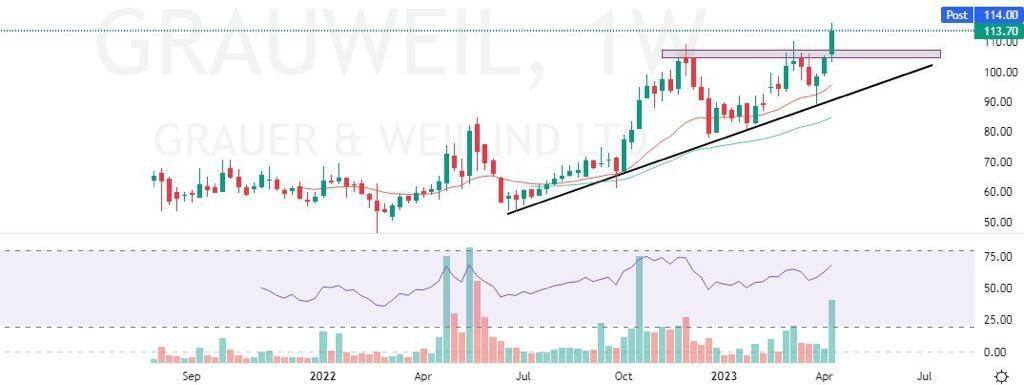
Here are three buy calls for short term:Grauer and Weil (India): Buy | LTP: Rs 113.70 | Stop-Loss: Rs 104 | Target: Rs 127 | Return: 12 percentThe stock has been trading in a higher high higher low formation on the weekly timeframe and has recently broken its previous swing high. It is trading above important EMAs of 20/50/100/200-day which can be used as a confluence towards the bullish view.
On the indicator front, the supertrend indicator is indicating a bullish reversal on the daily timeframe and the Ichimoku Cloud is also suggesting a bullish move as the price is trading above the conversion and base line on the daily timeframe.
Momentum oscillator RSI (14) is at around 69 on the daily time frame indicating strength by sustaining above 50. Observation of the above factors indicates that a bullish move in Grauer and Weil is possible for targets upto Rs 127.
One can initiate a buy trade in between the range of Rs 111-113, with a stop-loss of Rs 104 on daily closing basis.
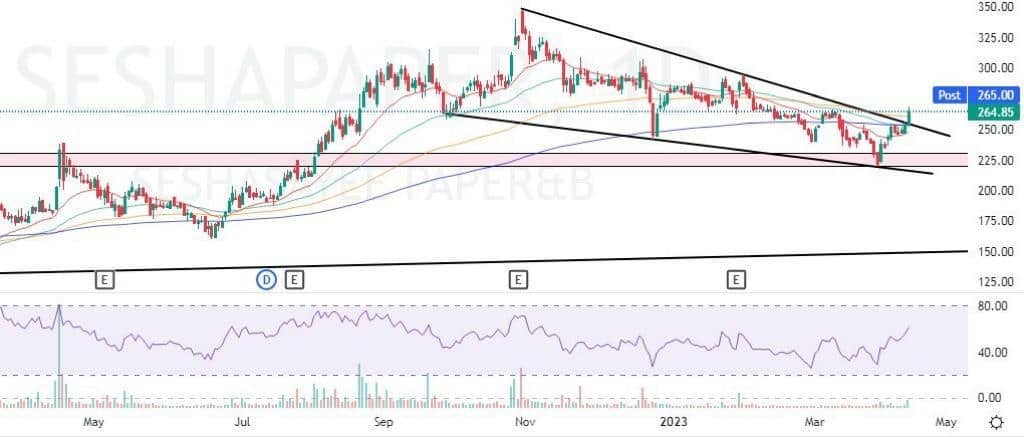
Seshasayee Paper has seen breaking out of a downward sloping wedge pattern on the daily timeframe after taking support from a crucial support zone.
On the indicator front, the stock is trading above important EMAs of 20/50/100/200 which indicates bullishness, and the supertrend indicator is indicating a bullish reversal.
Momentum oscillator RSI (14) is at around 61 on the daily time frame indicating strength by sustaining above 50 and the Ichimoku cloud is also suggesting a bullish move as the price is trading above the conversion and base line on the daily timeframe.
Observation of the above factors indicates that a bullish move in Seshasayee Paper is possible for targets upto Rs 300. One can initiate a buy trade in the range of Rs 262-265, with a stop-loss of Rs 243 on daily closing basis.
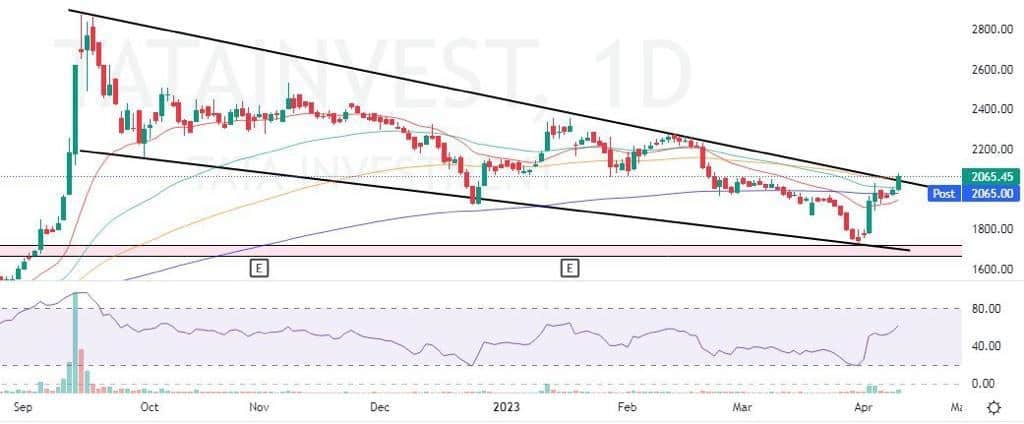
Tata Investment Corporation has seen breaking out of a wedge like pattern with a bullish candlestick on the daily timeframe and closing above the highs of last 4 weeks. The supertrend indicator is also indicating a bullish continuation which supports the bullish view.
Momentum oscillator RSI (14) is at around 61 on the daily time frame indicating strength by sustaining above 50 and the Ichimoku Cloud is also suggesting a bullish move as the price is trading above the conversion and base line.
Observation of the above factors indicates that a bullish move in Tata Investment Corporation is possible for targets upto Rs 2,212. One can initiate a buy trade in between the range of Rs 2,059-2,065, with a stop-loss of Rs 1,970 on daily closing basis.

Discover the latest Business News, Sensex, and Nifty updates. Obtain Personal Finance insights, tax queries, and expert opinions on Moneycontrol or download the Moneycontrol App to stay updated!
Find the best of Al News in one place, specially curated for you every weekend.
Stay on top of the latest tech trends and biggest startup news.


