
Raging bulls of Dalal Street kept the market in the green, four weeks on, despite a wave of consolidation. On the Nifty50, 19,600 acted as a strong support mark on the downside, while the 19,850-19,900 remained as a key resistance area on the higher side. Experts were consistent to say that these are important levels as a decisive breakout above 19,900 could open the doors for Summit 20,000.
The experts further advised to continue with the buy-on-dips strategy till the index holds 19,600-19,500 on the downside. The Nifty50 closed a tad below 19,800, rising 0.3 percent to 19,795, in the week ended November 24 at the highest closing level since the second week of September.
"Throughout the week, prices encountered resistance around the 19,850 - 19,900 zone, near the previous swing high. To initiate momentum, a convincing breakthrough beyond these levels is required, potentially paving the way for a fresh upward movement towards 20,000 and beyond in the short term," Sameet Chavan, vice-president for technical and derivatives at Angel One, said.
Conversely, prices had already surpassed a key trendline resistance, leading to a buy on a minor dip during the week. The breakout zone, coinciding with a bullish gap at 19,580 - 19,500, is seen as robust support, and prices also defended the 19,700 level during the week, serving as immediate support, he said.
Chavan advised traders to monitor these levels closely during the truncated expiry week and manage their trading strategies accordingly.
From a technical standpoint, nothing has altered last week as the Nifty was rangebound. "We continue to hold the belief that the outlook is to buy on dips," Jigar S Patel, senior manager of equity research at Anand Rathi, said.
He also agreed with Sameet, saying if the index shoots past 19,900, there is a chance that it may experience a prolonged upswing, leading to a new lifetime high.
Let's take a look at the top 10 trading ideas from experts for the next three-four weeks. Returns are based on the November 24 closing prices.
Expert: Viraj Vyas, CMT, Technical & Derivatives Analyst | Institutional Equity at Ashika Stock Broking
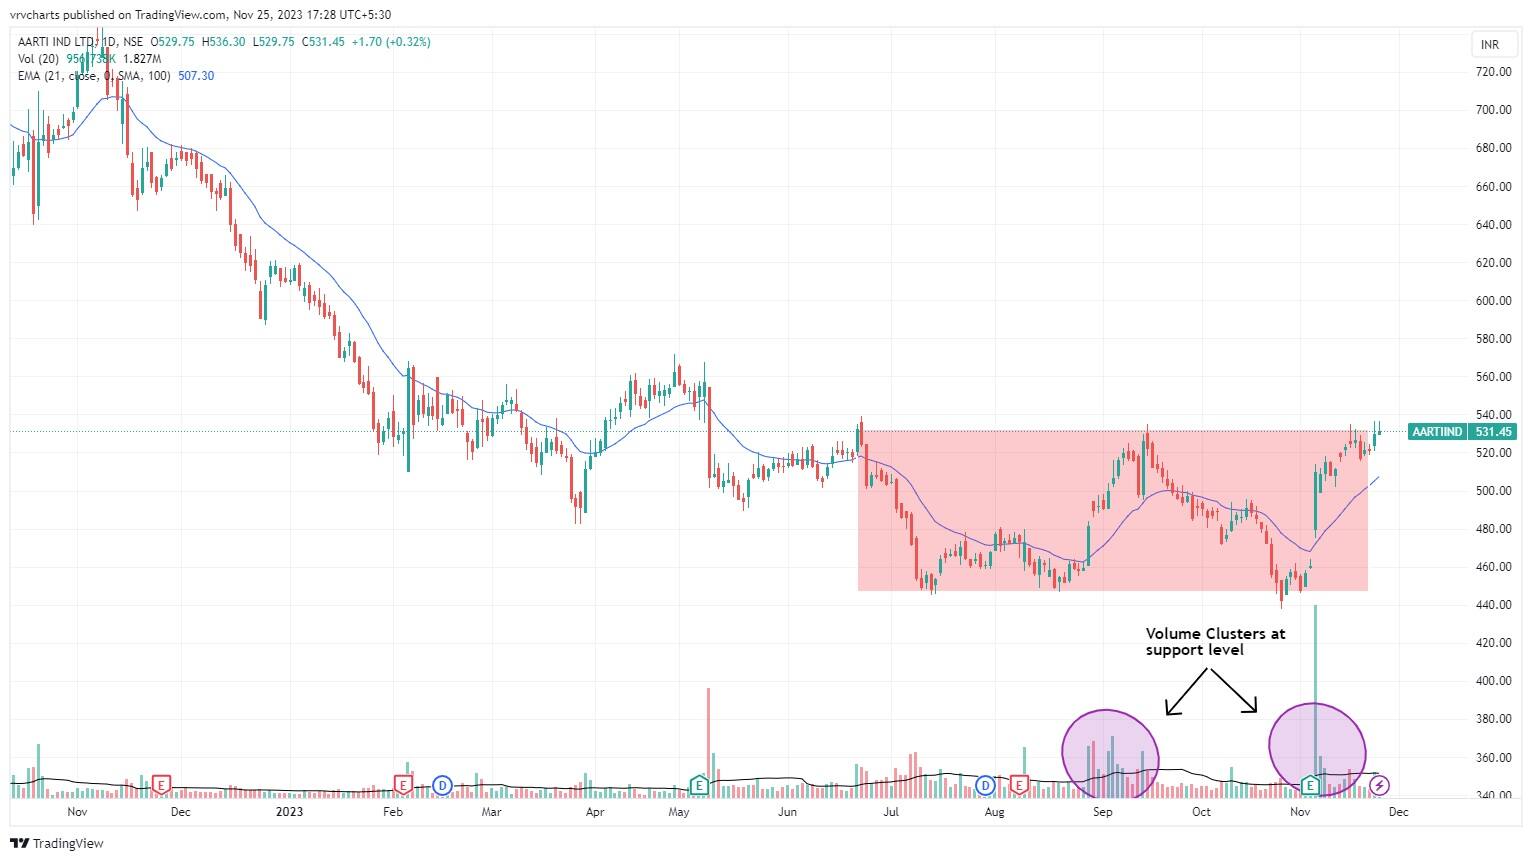
Aarti Industries: Buy | LTP: Rs 531 | Stop-Loss: Rs 505 | Target: Rs 590 | Return: 11 percent
The stock was a strong performer until October 2021, after which it experienced a decline from around Rs 960 to lows of Rs 440. Recently, the stock has been forming a base in the Rs 440-460 range with volume activity, and the latest move indicates bullish range expansion.
A breakout above Rs 531-533 level is considered significant and could trigger a bullish move in the stock, making it an interesting breakout pick for investors to watch.
Eicher Motors: Buy | LTP: Rs 3,849 | Stop-Loss: Rs 3,650 | Target: Rs 4,300 | Return: 12 percent
The stock witnessed a bullish move from around Rs 2,400 in April 2022 to approximately Rs 3,750 in October 2022. Following this, the stock entered a consolidation phase that formed a Cup and Handle pattern.
Breaking above the previous swing high and currently trading at all-time highs suggest strong momentum for the stock. This could be an encouraging signal for investors looking for bullish opportunities.

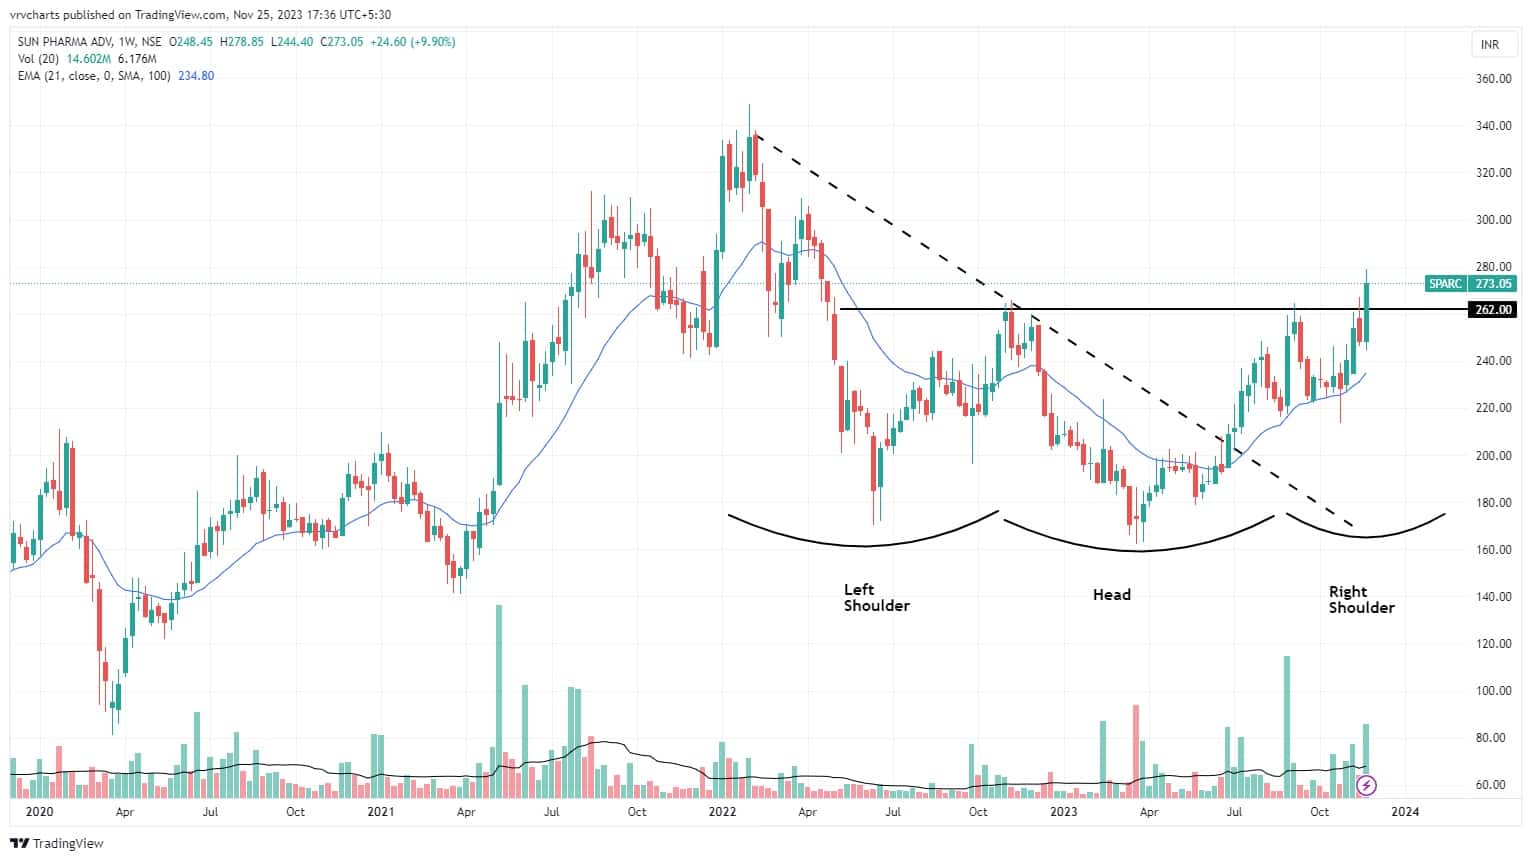
Sun Pharma Advanced Research Company: Buy | LTP: Rs 273 | Stop-Loss: Rs 258 | Target: Rs 305 | Return: 12 percent
The stock, part of the pharma sector, recently emerged from a brief downtrend. After consolidating both in terms of time and price from April 2023 to November of the same year, the stock staged a breakout. The formation of an Inverse Head and Shoulders pattern is notable, and the breakout above the neckline at Rs 262 is significant.
The strong weekly close and volume participation during the breakout add weight to the bullish signal. This might be an interesting development for investors seeking opportunities in the Pharma sector.
Expert: Jigar S Patel, Senior Manager - Equity Research at Anand Rathi
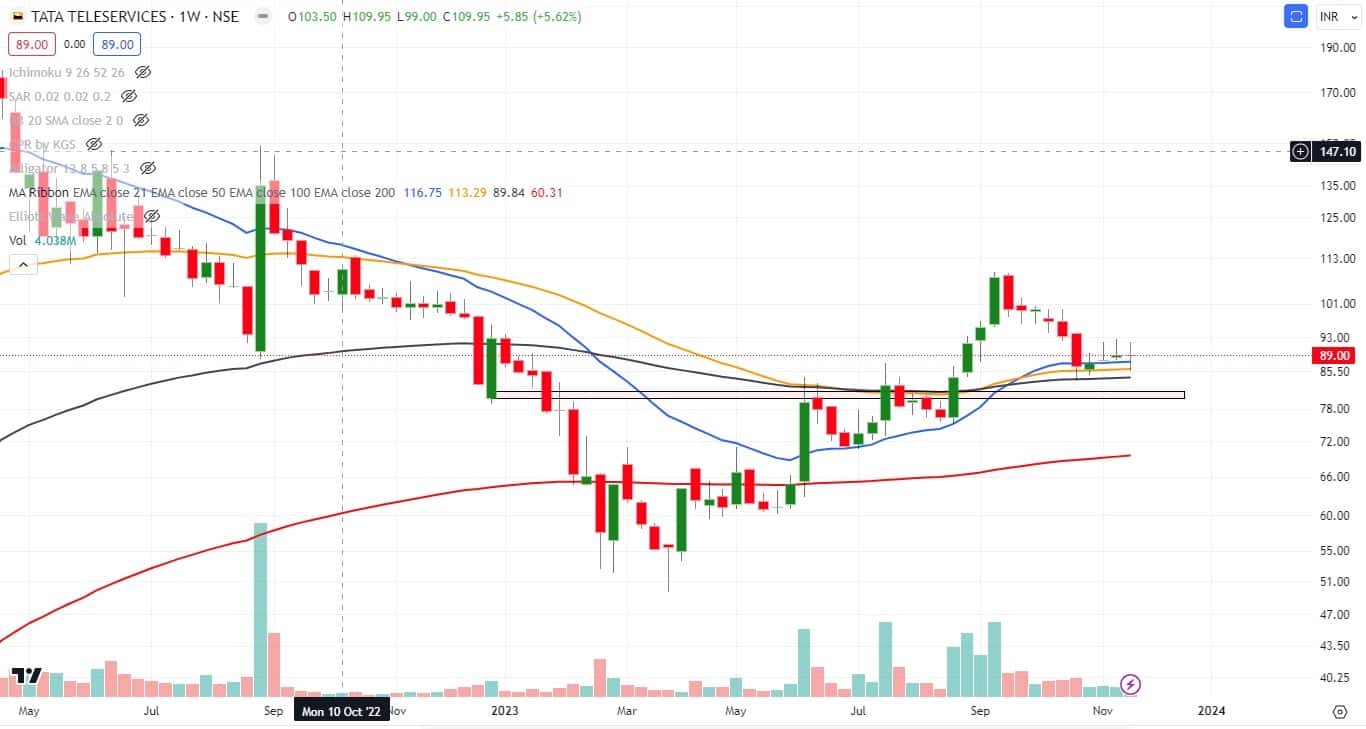
Tata Teleservices (Maharashtra): Buy | LTP: Rs 89 | Stop-Loss: Rs 78 | Target: Rs 105 | Return: 18 percent
It has corrected approximately 25 percent since reaching a high near Rs 110 on September 15, 2023. At the current juncture, it has taken support near the 200 daily exponential average, i.e., Rs 85 level, which is also the previous swing high.
On the indicator, the daily RSI has made an impulsive structure near the oversold zone of 30, which is looking lucrative. One can buy in the range of Rs 86–90 with a target of Rs 105, and the stop-loss would be Rs 78 on a daily close basis.
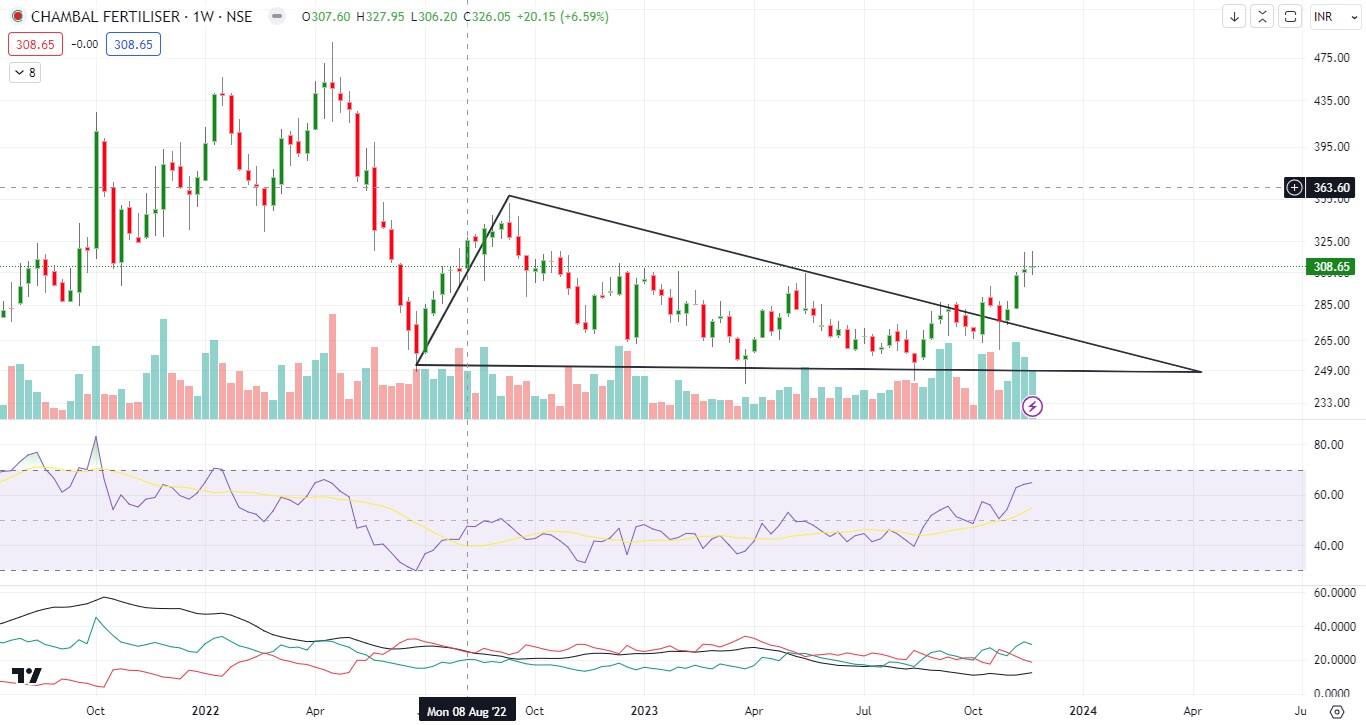
Chambal Fertilisers and Chemicals: Buy | LTP: Rs 308.65 | Stop-Loss: Rs 275 | Target: Rs 365 | Return: 18 percent
Chambal Fertilisers has been consolidating for some time on the weekly chart. Recently, it had a breakout with huge volume.
On the indicator front, weekly RSI is about to enter the 70 zone, along with weekly DMI (directional movement index), which has turned positive, thus looking lucrative.
Thus, we advise traders to go long in the stock in the range of Rs 305-310, with a stop-loss of Rs 275 and target of Rs 365.
Expert: Nandish Shah, technical/derivative research analyst at HDFC Securities
Bharat Forge: Buy | LTP: Rs 1,116 | Stop-Loss: Rs 1,040 | Target: Rs 1,200-1,250 | Return: 12 percent
The stock price has broken out from the downward sloping trendline on the daily chart. The stock price has been forming bullish higher top, higher bottom formation on the weekly chart. Momentum indicators and oscillators are showing strength in the stock.

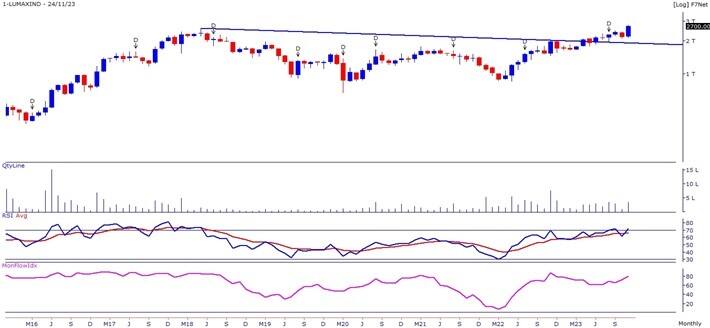
Lumax Industries: Buy | LTP: Rs 2,731 | Stop-Loss: Rs 2,500 | Target: Rs 2,920-3,000 | Return: 10 percent
The stock price closed at all-time high on the monthly chart with higher volumes. Stock price has broken out from the downward sloping trendline on the monthly chart, adjoining the high of month ending May 2018 and November 2022.
Oscillators like RSI (relative strength index 11) and MFI (money flow index 10) are sloping upwards and placed above 50 on the daily, weekly and monthly chart, indicating strength in the stock.
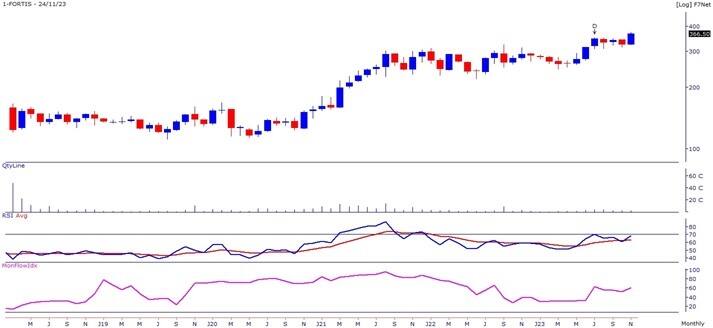
Fortis Healthcare: Buy | LTP: Rs 366 | Stop-Loss: Rs 340 | Targets: Rs 395-415 | Return: 13 percent
The stock price has broken out on the monthly chart with higher volumes. Stock price has broken out from the downward sloping trendline on the daily chart, adjoining the high of July 31 and September 28, 2023.
Plus DI (directional indicator) is trading above minus DI while ADX (average directional index) line is placed above 25, indicating stock price is likely to gather momentum in the coming days. Hospital as a sector is looking strong on the short to medium term charts.
Expert: Mitesh Karwa, Research Analyst at Bonanza Portfolio
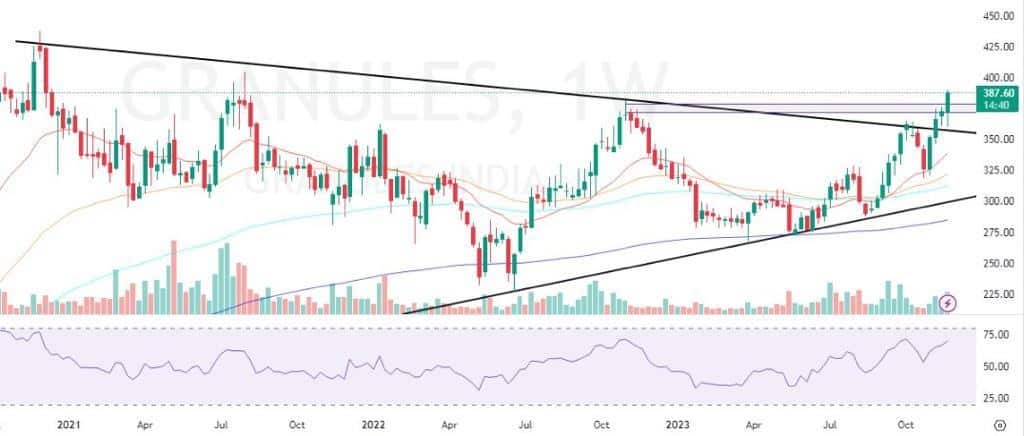
Granules India: Buy | LTP: Rs 387 | Stop-Loss: Rs 369 | Target: Rs 424 | Return: 10 percent
Granules has seen breaking out of a bullish pattern on the weekly timeframe with a bullish candlestick and above average volume after almost three years which indicates strength as the stock is also trading above all its important EMAs (exponential moving average) on the daily timeframe which acts as a confluence.
The Supertrend indicator is also indicating a bullish continuation which supports the bullish view. Momentum oscillator RSI (14) is at around 71 on the daily time frame indicating strength by sustaining above 50. The Ichimoku Cloud is also suggesting a bullish move as the price is trading above the conversion line, base line and cloud.
Observation of the above factors indicate that a bullish move in Granules is possible for target upto Rs 424. One can initiate a buy trade in between the range of Rs 386-387, with a stop-loss of Rs 369 on daily closing basis.
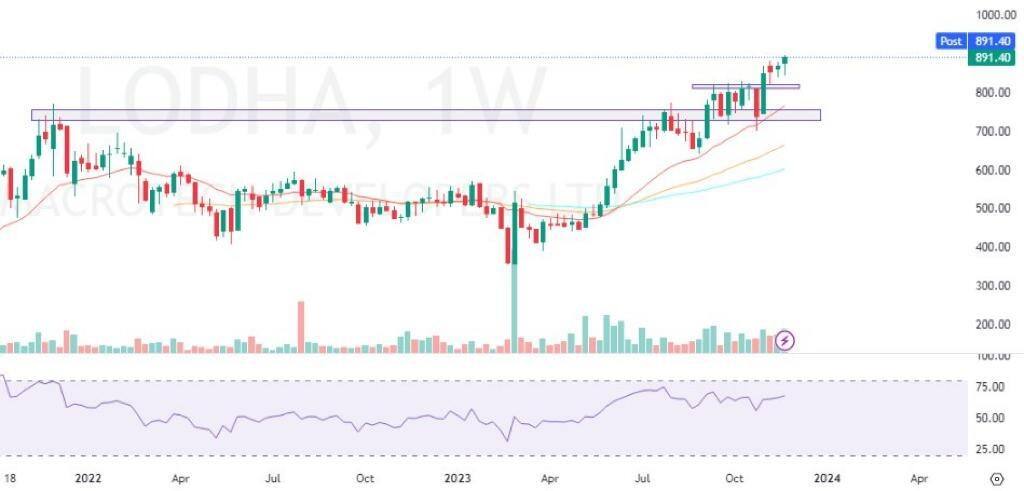
Macrotech Developers: Buy | LTP: Rs 891 | Stop-Loss: Rs 854 | Target: Rs 950 | Return: 6.6 percent
Lodha hsa seen breaking out of a resistance zone on the weekly timeframe with above average volumes and a bullish candlestick on the daily timeframe. In addition, the stock is trading above important EMAs of 20/50/100/200 on the daily timeframe which indicates strength.
On the indicator front, momentum oscillator RSI (14) is at around 69 on the daily time frame indicating strength by sustaining above 50. The Ichimoku Cloud is also suggesting a bullish move.
Observation of the above factors indicate that a bullish move in Lodha is possible for target upto Rs 950. One can initiate a buy trade in the range of Rs 888-891 with stop-loss of Rs 854 on daily closing basis.
Disclaimer: The views and investment tips expressed by investment experts on Moneycontrol.com are their own and not those of the website or its management. Moneycontrol.com advises users to check with certified experts before taking any investment decisions.
Discover the latest Business News, Sensex, and Nifty updates. Obtain Personal Finance insights, tax queries, and expert opinions on Moneycontrol or download the Moneycontrol App to stay updated!


