The Nifty 50 seems to be in a consolidation phase with higher highs, higher lows for yet another session and consistently faced resistance at the 21,000 mark. The support has shifted a bit higher to 20,900 now, followed by 20,850. Hence, as long as it holds this support area, the index may make an attempt to hit 21,100 in the coming sessions as the momentum indicators relative strength index (RSI) and moving average convergence divergence (MACD) showed positive bias on all time frames (daily, weekly and monthly), experts said.
On December 11, the Nifty rose 28 points to 20,997, and the BSE Sensex was up 103 points at 69,929, while the Nifty Midcap 100 and Smallcap 100 indices outperformed the benchmarks, rising 0.74 percent and 0.84 percent.
Stocks that recorded a healthy performance and outperformed broader markets included RBL Bank, Tube Investments of India, and IRFC. RBL Bank extended the uptrend and showed a higher highs, higher lows formation for the sixth consecutive session. The stock rallied 3.4 percent to Rs 277 and formed a bullish candlestick pattern with an upper shadow on the daily charts with above-average volumes. The stock has seen a breakout of long downward sloping resistance trendline adjoining highs of January 8, 2021 and November 16, last week and maintained the upward trend.
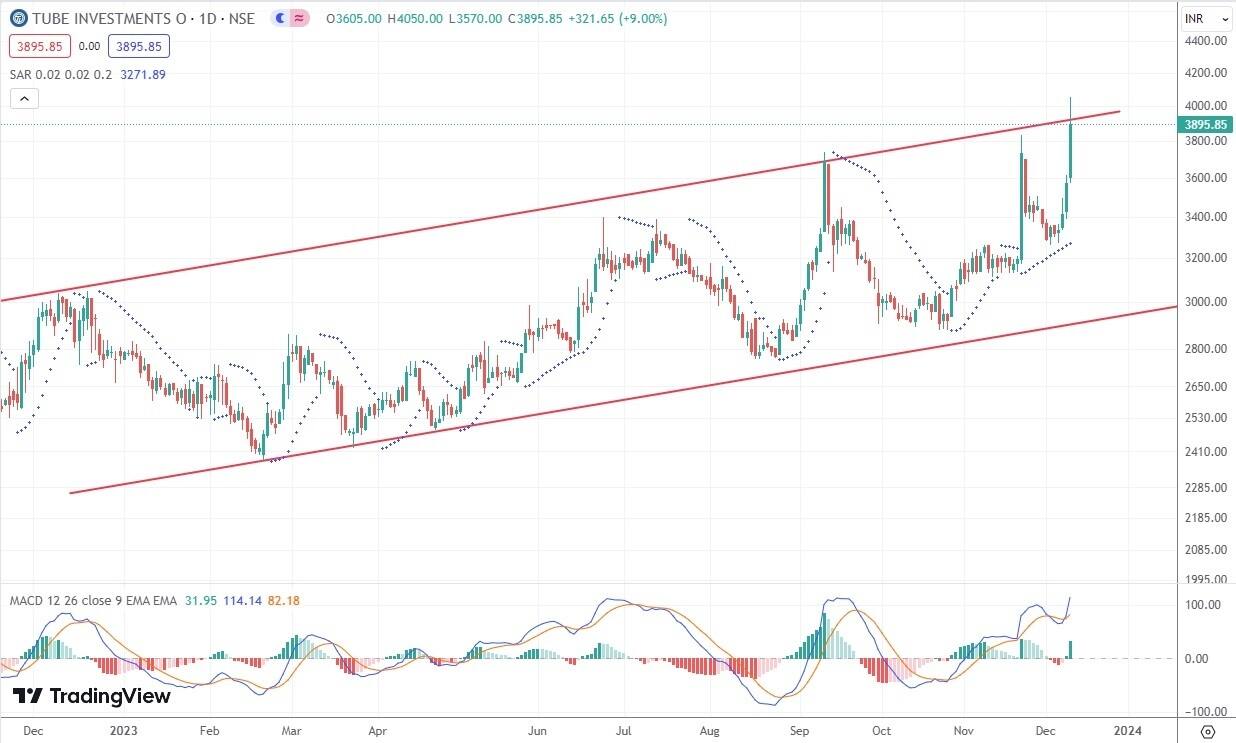
Tube Investments of India rallied 9 percent to end at record closing high of Rs 3,896 and formed robust bullish candlestick pattern with upper shadow on the daily charts. The stock sustained uptrend with strong volumes for four days in a row, and traded well above all key moving averages (20, 50, 100 and 200-day EMA - exponential moving average), which is a positive sign.
IRFC has seen a consolidation breakout and recorded more than 7 percent gains at Rs 82 on the NSE. The stock has formed long bullish candlestick pattern on the daily charts with robust volumes and traded above all key moving averages.
Here's what Ashish Kyal of Waves Strategy Advisors recommends investors should do with these stocks when the market resumes trading today:
In the previous session, the stock made a fresh record high near Rs 4,050 levels. Prices, though, were unable to close above the resistance of the channel. Price can rise even more if it closes above it.
Since December 7, the stock has continuously giving a close above previous day’s high. This keeps overall tone positive as long as we do not see a close below previous day’s low. On the other hand, MACD (moving average convergence divergence) has shown bullish crossover which is acting as a double confirmation.
In short, outlook for Tube Investments remains positive. A close above Rs 3,906 is must for further bullish momentum to continue with the targets of Rs 4,070-4,100. While on the downside, Rs 3,740 is the nearest support.
RBL Bank has shown a classic rally over a past few days. It is following classic Elliott wave theory, wherein, primary wave (3) is moving on the upside which is subdividing in nature. Wherein, internal wave 3 is ongoing on the upside. Wave 3 has retraced 61.8 percent as compared to wave 1.
The next target comes near Rs 302 levels which will be 78.6 percent of wave 1 which we expect to achieve in coming months. Volumes are picking up. Stock is making fresh highs daily. So, it would be wiser to use buy on dips approach and avoid catching tops.
In short, trend for this stock is positive. Use dips as a buying opportunity for a move towards Rs 285 levels as long as Rs 258 holds on the downside.

Recently, the Indian Railway Finance Corporation (IRFC) has been rising and staying in a strong uptrend. The stock looks to have formed a Symmetrical Triangle Pattern. A Symmetrical Triangle chart pattern represents a period of consolidation before the price is forced to breakout or breakdown.
Price has closed above Rs 78 level which indicate breakout of the said pattern. MACD is above 0 and MACD line crossed above the MACD signal line which indicates that bullish momentum has increased in this stock and may continue in the coming session.
In short, trend for this stock is positive. A break above Rs 83.50 can lift price higher towards Rs 89-90 as long as Rs 79 holds on the downside.
Follow Ashish Kyal on Twitter - @kyalashish
Disclaimer: The views and investment tips expressed by investment experts on Moneycontrol.com are their own and not those of the website or its management. Moneycontrol.com advises users to check with certified experts before taking any investment decisions.
Discover the latest Business News, Sensex, and Nifty updates. Obtain Personal Finance insights, tax queries, and expert opinions on Moneycontrol or download the Moneycontrol App to stay updated!