The Nifty is displaying a strong bullish momentum, with the index approaching the significant level of 19,800, which coincides with the highest open interest zone. However, the recent candlestick formation indicates indecision among traders. While the overall market structure remains bullish, it is worth considering some factors that might impact the market.
The elevated Put-Call ratio and the rise in India's volatility index suggest a cautious sentiment and the possibility of profit-booking at higher levels. It is important to monitor these indicators closely. In terms of immediate support levels, 19,500 is expected to act as a strong base, followed by 19,300.
If the Nifty50 managers to sustain itself above the 19,800 mark, it would confirm further bullishness, with the next target level being 20,000.
Turning our attention to the Bank Nifty, the index experienced a notable rebound from its 20-day moving average (20-DMA of 44,613). However, it now faces a psychological hurdle at the 46,000 level. On the downside, 45,000 is an immediate support level, while 44,500 is a key support level to watch out for.
In the event that the Bank Nifty surpasses the 46,000 level, the next target to consider would be 46,600.
Here are three buy calls for next 2-3 weeks:
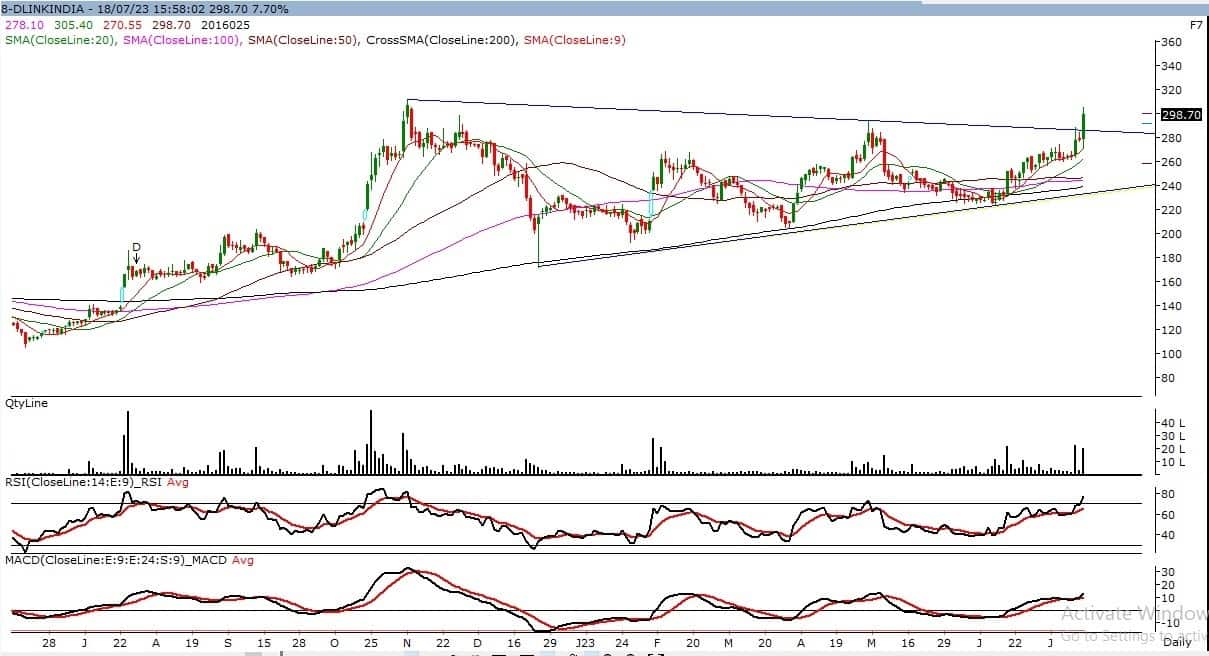
D-Link India: Buy | LTP: Rs 299 | Stop-Loss: Rs 270 | Target: Rs 348 | Return: 16 percent
The stock has recently broken out of a Symmetrical triangle formation on the daily chart, accompanied by significant trading volume. This breakout suggests a positive outlook for the stock in the short to long term. Additionally, the stock is trading above its important moving averages, further reinforcing its bullish sentiment.
Both the RSI (relative strength index) and MACD (moving average convergence divergence) indicators are supportive of the current strength in the stock's momentum.
In terms of price levels, the range of Rs 310–312 holds psychological significance as a key resistance level. If the stock manages to surpass this level, it could potentially rally toward Rs 340 or higher. On the downside, Rs 270 is a strong demand zone during any correction.
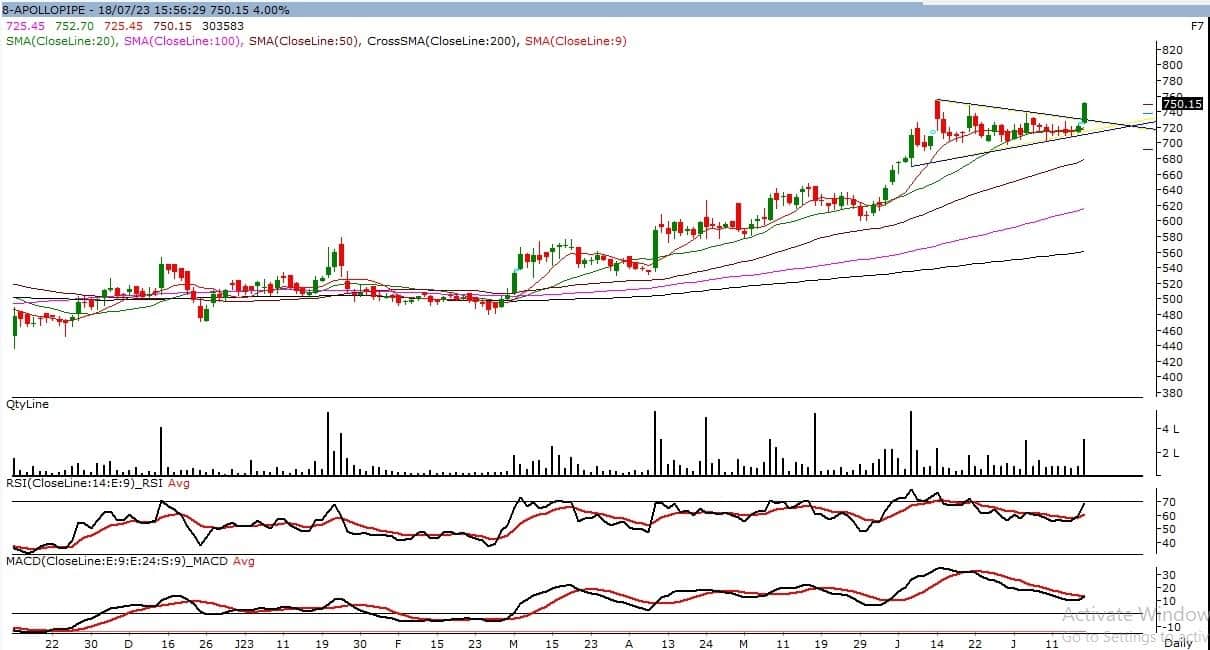
Apollo Pipes: Buy | LTP: Rs 750 | Stop-Loss: Rs 700 | Target: Rs 854 | Return: 14 percent
The counter has experienced a breakout of a Symmetrical triangle formation on the daily chart with strong volume and a breakout of a Flag pattern formation on the weekly chart. The overall structure of the counter looks lucrative for the short to long term, as it is trading above all its important moving averages.
The momentum indicator RSI is also positively poised, whereas MACD is supporting the current strength.
On the upside, Rs 780 is an important psychological level; above this, we can expect a move towards Rs 850+. On the downside, a cluster of moving averages at around Rs 700 is a strong demand zone during any correction.
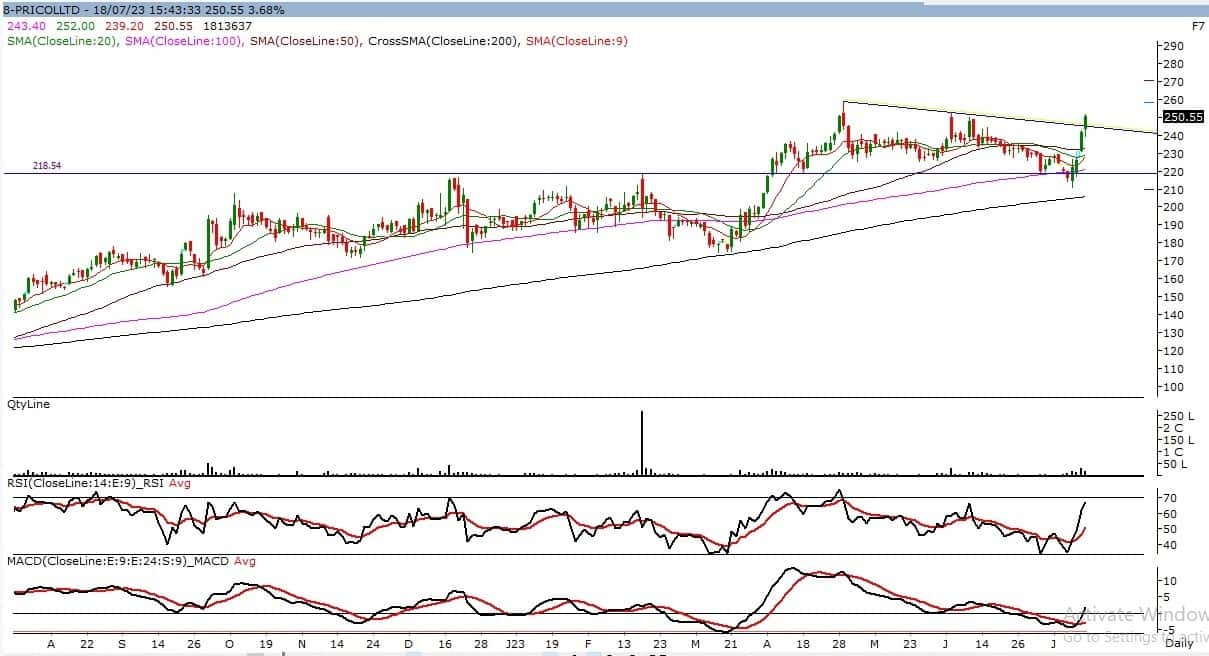
Pricol: Buy | LTP: Rs 250.55 | Stop-Loss: Rs 230 | Target: Rs 284 | Return: 13 percent
The stock is currently in a long-term uptrend, as it resumes its classical upward movement after a significant correction. It recently formed a solid support base around the Rs 210 level and is now breaking through a key trendline resistance at Rs. 245. This breakout has the potential to generate renewed bullish momentum, potentially pushing the stock towards the Rs 280 level.
In case of a downside correction, Rs 230 is expected to provide strong support to the stock. Furthermore, the stock is trading above its crucial moving averages and the momentum indicators are displaying a positive bias.
Disclaimer: The views and investment tips expressed by investment experts on Moneycontrol.com are their own and not those of the website or its management. Moneycontrol.com advises users to check with certified experts before taking any investment decisions.

Discover the latest Business News, Sensex, and Nifty updates. Obtain Personal Finance insights, tax queries, and expert opinions on Moneycontrol or download the Moneycontrol App to stay updated!