


Corporate India is in fine fettle. Its balance sheet is in much better shape than what it was before the pandemic.
Cast your eyes on Table 1. It shows that the average Return on Capital Employed (RoCE) for non-financial firms in the September 2021 quarter, at 8.21 percent, is far higher than the 3.02 percent RoCE in September 2019, before the pandemic. India’s corporate sector seems to have risen phoenix-like from the ashes of COVID-19.
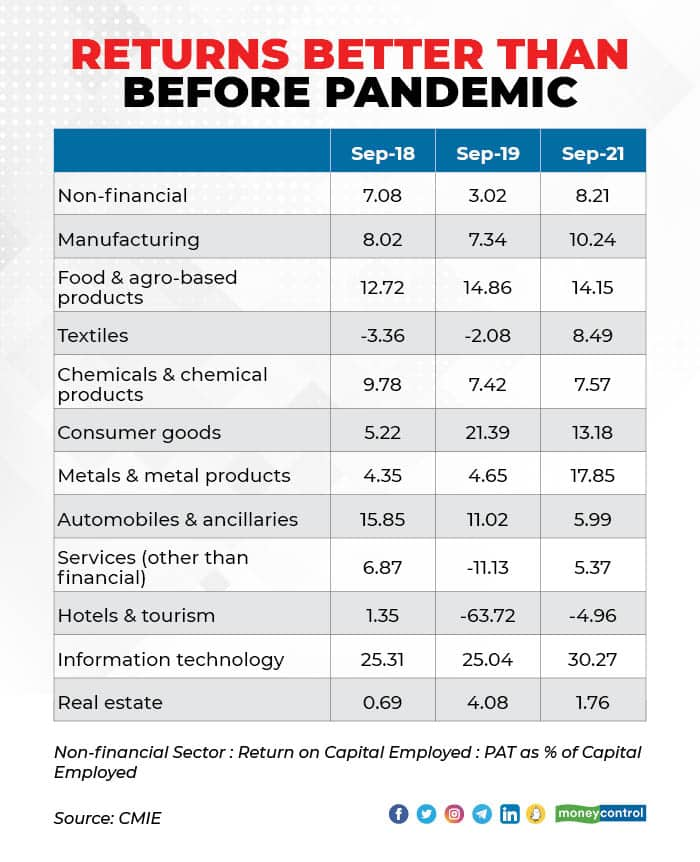
The numbers are taken from the CMIE database and they include the results of 3142 non-financial firms in the September 2021 quarter.
Of course, there are big differences between sectors. Manufacturing, for instance, has an RoCE of 10.24 percent, compared to 7.34 percent in the September 2019 quarter and 8.02 percent in the September 2018 quarter. The RoCE of the metals sector, in particular, is even better than during 2011, thanks to the sharp rise in metal prices.
On the other hand, the present RoCE of the services sector is much lower, at 5.37 percent. As Table1 shows, the hotels sector has a negative RoCE, but even that is better than the RoCE two years ago, before the pandemic.
Indeed, if we leave out the March 2021 results, when non-financial firms had an even higher RoCE of 8.89 percent, then the last time non-financial firms had RoCE of over 8 percent was way back in the March 2011 quarter, when GDP growth at constant prices was as high as 10.33 percent.
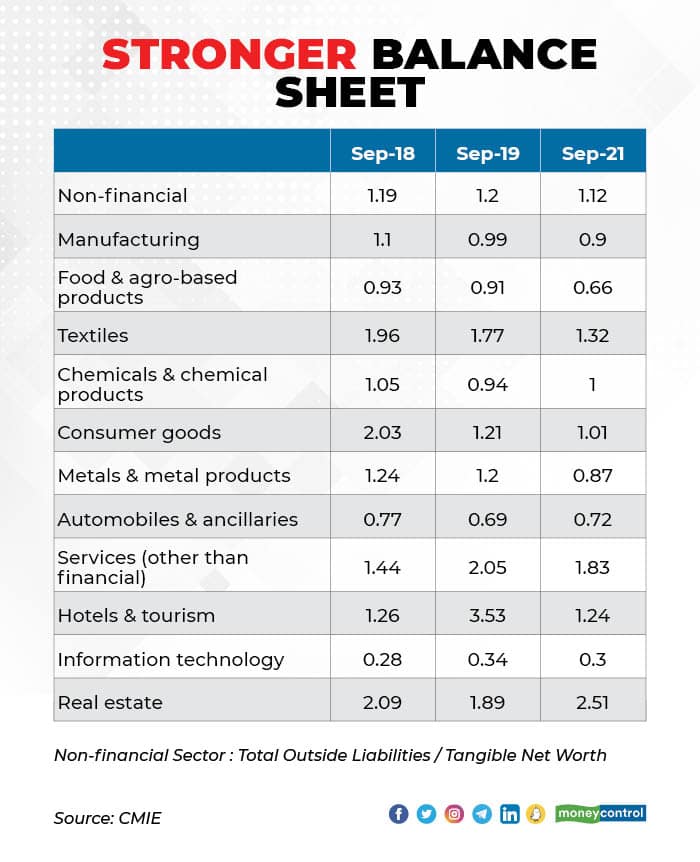
India Inc has also been able to reduce the debt on its balance sheet. The Total Outside Liabilities/Tangible Net Worth (TOL/TNW) ratio is a measure of a company’s leverage. This ratio was 1.12 in the September 2021 quarter, the lowest, and best, since the September 2016 quarter. Firms have used the buoyant capital markets to raise funds and repay debt. Table2 has the details—it also shows that not all sectors are equal and the TOL/TNW ratio has deteriorated for the real estate sector.
Interest cover measures how easily a company can pay on its outstanding debt. The combination of a lower debt and very low interest rates, which many firms used to refinance their debt, has resulted in the interest cover for non-financial firms being the highest since the March 2011 quarter. Table 3 has the details.

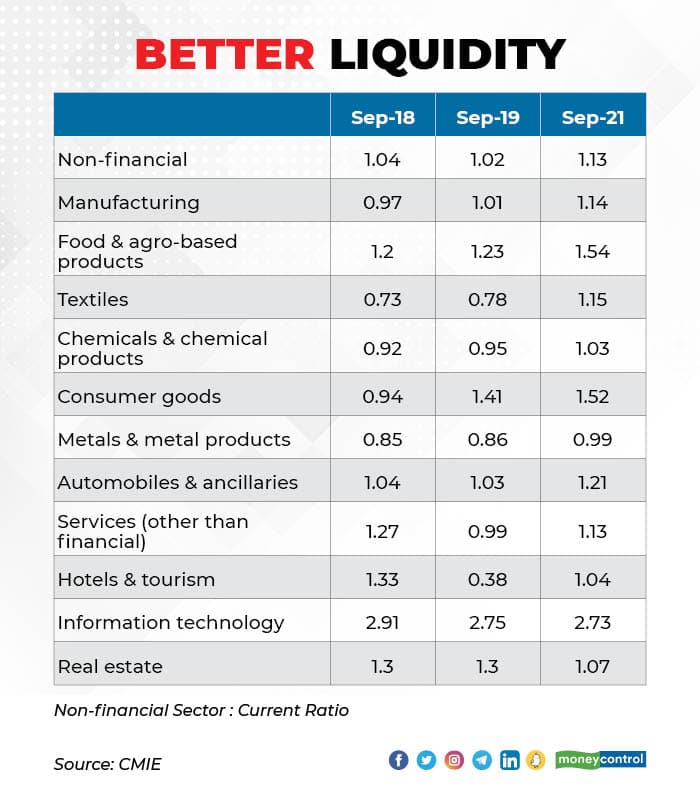
And finally, the liquidity position of firms has also improved substantially. The current ratio of a firm is a measure of liquidity and measures its ability to pay short-term obligations. As Table 4 shows, the current ratio of non-financial firms has gone up to 1.13, the highest and best ratio since the September 2016 quarter.
One reason for GDP growth being dragged down in the years before the pandemic was because India suffered from the twin balance sheet problem—the balance sheets of both the corporate sector and banks were under strain. But now, corporates have repaired their balance sheets, while bank balance sheets too have improved, with a reduction in bad loans and higher loan loss provisions.
That should set the stage for the next phase of growth. Small wonder that analysts are predicting the beginning of a multi-year investment cycle in India.

Discover the latest Business News, Sensex, and Nifty updates. Obtain Personal Finance insights, tax queries, and expert opinions on Moneycontrol or download the Moneycontrol App to stay updated!
Find the best of Al News in one place, specially curated for you every weekend.
Stay on top of the latest tech trends and biggest startup news.


